Complete mitogenomes of two species of Cephenemyia and Pharyngomyia picta, and a comparison with other Oestrinae
Gaël Aleix-Mata, Pablo Mora, Paloma Prieto-Yerro, Roser Velarde, Alexander P. Saveljev, Antonio Sánchez-Camacho, Einer F. Mendoza, Eugenia E. Montiel, Jesús M. Pérez, Antonio Sánchez

TL;DR
This study sequenced and compared the complete mitochondrial genomes of three bot fly species, revealing insights into their genetic structure and evolutionary relationships.
Contribution
The first complete mitogenome sequences for Cephenemyia auribarbis, C. ulrichii, and Pharyngomyia picta are reported and compared with other Oestridae species.
Findings
All three mitogenomes have a conserved gene content and structure typical of Oestridae, with high A+T content.
Phylogenetic analysis confirmed the monophyly of Cephenemyia and its close relationship with Pharyngomyia, Oestrus, and Rhinoestrus.
The D-loop region showed the highest sequence variability, useful for evolutionary studies.
Abstract
This study reports for the first time the complete sequencing of the mitogenome of three Oestridae species: Cephenemyia auribarbis, C. ulrichii, and Pharyngomyia picta (Diptera: Oestridae). These three mitogenomes were assembled and annotated from specimens collected in southern and northern Spain (C. auribarbis and P. picta, respectively) and in Russia (C. ulrichii). They were then compared with the mitogenomes of 18 other Oestridae species available in GenBank. All three analyzed mitogenomes exhibited a conserved gene content and structure comprising 13 protein-coding genes, 22 tRNAs, two rRNAs, and a control region, with a high A + T content characteristic of the Oestridae. Intraspecific variability in length and sequence was detected in C. ulrichii and P. picta. Comparative analyses revealed conserved start/stop codons and consistent PCGs, tRNA, and rRNA gene organization. The…
Genes, proteins, chemicals, diseases, species, mutations and cell lines named across the full text — each resolved to its canonical identifier and authoritative record.
Click any figure to enlarge with its caption.
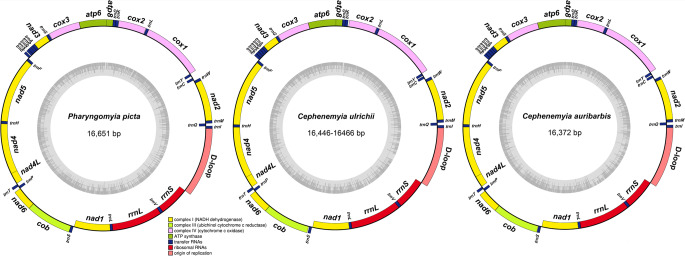 Figure 1
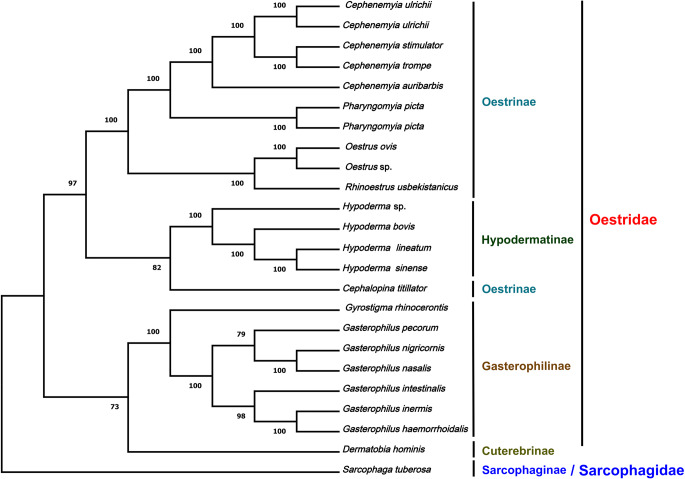 Figure 2
- —Universidad de Jaén
Peer Reviews
No public reviews on file for this paper yet. If you reviewed it on a platform where reviews are public (OpenReview, ICLR, NeurIPS, ICML), you can paste yours below so the community can read it here.
Videos
No videos yet. Explain this paper in a talk, walkthrough, or lecture? Add one.
Taxonomy
TopicsForensic Entomology and Diptera Studies · Diptera species taxonomy and behavior · Genomics and Phylogenetic Studies
Introduction
Oestrids (Diptera: Oestridae Leach, 1815) are obligate parasites of mammals during their larval stage. The females of nasal/pharyngeal bots (subfamily Oestrinae) are larviparous and deposit or eject packets of larvae into the nostrils of their hosts. The larvae move into the nasal, pharyngeal, and frontal cavities of the host, where they feed on cellular debris and mucosal secretions until maturity (Colwell 2001). The family Oestridae includes four subfamilies: Cuterebrinae, Gasterophilinae, Hypodermatinae, and Oestrinae (Pape 2001; Scholl et al. 2019), and the subfamily Oestrinae includes nine genera: Cephenemyia (Latreille, 1818), Cephalopina (Strand, 1928), Gedoelstia (Rodhain and Bequaert, 1913), Kirkioestrus (Rodhain and Bequaert, 1915), Oestrus (Linnaeus, 1758), Pharyngobolus (Brauer, 1866), Pharyngomyia (Schiner, 1861), Rhinoestrus (Brauer, 1886), and Tracheomyia (Townsend, 1916) (Angulo-Valadez et al. 2010).
The genus Cephenemyia contains eight species: C. auribarbis (Meigen, 1824), C. ulrichii (Brauer, 1863), C. stimulator (Hunter, 1916), C. trompe (Modeer, 1786), C. jellisoni (Townsend, 1941), C. pratti (Hunter, 1916), C. apicata (Bennett and Sabrosky, 1962), and C. phorbifer (Clark, 1815). These species parasitize various cervid hosts (family Cervidae): C. auribarbis and C. stimulator parasitize red deer Cervus elaphus (Linnaeus, 1758) and roe deer Capreolus capreolus (Linnaeus, 1758), respectively; C. ulrichii is found in moose Alces alces (Linnaeus, 1758); C. trompe parasitizes both moose and reindeer Rangifer tarandus (Linnaeus, 1758); C. jellisoni has been reported in white-tailed deer Odocoileus virginianus (Zimmermann, 1780), moose, elk Cervus canadensis (Erxleben, 1777), and mule deer Odocoileus hemionus (Rafinesque, 1817); C. pratti has been found in white-tailed deer and mule deer; C. apicata in mule deer; and C. phorbifer in white-tailed deer (Morrondo et al. 2021).
The genus Pharyngomyia includes two species: P. dzerenae (Grunin, 1950) and P. picta (Meigen, 1824). The former parasitizes Mongolian gazelle Procapra gutturosa (Pallas, 1777) (Pape 2006), while the latter, which is widely distributed throughout Europe and central Asia, parasitize red deer, sika deer Cervus nippon (Temminck, 1838), roe deer, fallow deer Dama dama (Linnaeus, 1758), and moose (Colwell 2001; Sreejith et al. 2012). Concomitant infestations by both C. auribarbis and P. picta in red deer and fallow deer have been reported (Vicente et al. 2004; Leitner et al. 2016).
The genome of Oestridae species remains poorly studied. Most of the available data are related to the characterization and analysis of the molecular markers used to identify the larvae of these species, which are generally morphologically very similar (Moreno et al. 2015; de la Fuente et al. 2021). The specific identification of Oestridae larvae is challenging, largely due to interspecific morphological similarities, sample degradation, and the scarcity of diagnostic morphobiometric traits. Thus, the mitogenome marker (cytochrome c oxidase subunit I gene (cox1), nuclear markers (28S gene and internal transcribed spacers (ITS) of rDNA), and the complete mitogenome have been characterized and are now used in population genetics and phylogenetic analyses (de la Fuente et al. 2021).
The analysis of complete mitogenomes has proven to be a highly valuable tool in the phylogenetic reconstruction of various groups of organisms, given that the mitogenome is only inherited maternally. To date, the complete mitogenome has been reported for only 18 oestrid species. The characterization of additional mitogenomes, along with comparative analyses, may provide new molecular markers that will help determine the phylogenetic relationships between Oestridae genera and species (Li et al. 2020). For species of the genera Pharyngomyia and Cephenemyia, molecular markers such as cox1 (from the mitogenome) and sequences of the 28S, 18S, ITS1, and ITS2 of the nuclear ribosomal RNA genes (rDNAs) are already available (de la Fuente et al. 2021). In addition, the mitogenomes of C. stimulator (Aleix-Mata et al. 2021a) and C. trompe (Li et al. 2020) are also available for the genus Cephenemyia.
The main objective of the present study was to describe the complete mitogenomes of three Oestrinae species, Cephenemyia auribarbis, C. ulrichii, and Pharyngomyia picta. In addition, we compared these mitogenomes with those from other Oestrinae species available in GenBank.
Material and method
Larvae collection and storage
Larvae of Cephenemyia auribarbis collected from red deer (Cervus elaphus) from Barcelona (Spain), of Cephenemyia ulrichii from moose (Alces alces) from Kirov (Russia), and of Pharyngomyia picta from red deer from the Sierras de Cazorla, Segura and Las Villas Natural Park (Spain) were used for this study. Larvae were fixed individually in 70–90% ethanol and stored at 4 °C and then identified on the basis of the shape of their posterior peritremes and dorsal and ventral spinulation (Zumpt 1965; Colwell 2006). Vouchers were deposited in the Department of Experimental Biology at the University of Jaén (Spain).
Extraction of genomic DNA and illumina sequencing
Genomic DNAs were extracted using the ZR Tissue & Insect DNA MiniPrep kit (Zymo Research). The total genomic DNA of one larva of C. auribarbis, two larvae of C. ulrichii, and two larvae of P. picta were sequenced using the Illumina^®^ Hiseq™ 2000 or Illumina NovaSeq X Plus platform by Novogene (UK). The genomic DNA of one C. ulrichii larva and two P. picta larvae was used to construct a library of 350-bp-length fragments; a total of 7 Gb of paired-end reads (2 × 150 bp) were obtained from P. picta samples and of 8 Gb from C. ulrichii samples. The genomic DNA of one C. ulrichii larva and one C. auribarbis larva were used to construct a library of 750-bp-length fragments; in all, 2 Gb of paired-end reads (2 × 250 bp) were obtained.
Mitogenome assembly and annotation
Raw reads were quality-trimmed, and sequencing adapters were removed using Trimmomatic v.0.36 (Bolger et al. 2014). A set of around 1.5 million clean reads for each species was employed for mitogenome assembly via NOVOplasty v.3.7 (Dierckxsens et al. 2017) using the mitogenomes of C. stimulator (Aleix-Mata et al. 2021a) as a reference. Several k-mers were tested for each mitogenome assembly and the best one in terms of mitogenome completeness was chosen for downstream analyses. The resulting mitogenomes were annotated with MITOS (http://mitos.bioinf.uni-leipzig.de) (Bernt et al. 2013) and tRNAscan-SE (http://lowelab.ucsc.edu/tRNAscan-SE) (Lowe and Eddy 1997). The annotations of protein coding genes (PCGs) and the transfer RNAs (tRNAs) and ribosomal RNA genes (rRNAs) were manually refined by comparison with the available mitogenomes of Oestridae species. The circular representation of the assembled mitogenomes was created using the OrganellarGenomeDRAW tool (https://chlorobox.mpimp-golm.mpg.de/OGDraw.html) (Greiner et al. 2019). Pairwise identities were calculated using Clustal Omega (https://www.ebi.ac.uk/Tools/msa/clustalo/) (Sievers and Higgins 2021; Madeira et al. 2022). The nucleotide bias was calculated from the base composition of the mitogenomes using the following formulas: AT-skew: A-T/A + T and GC-skew: G-C/G + C.
Phylogenetic analysis
For the phylogenetic analysis, we employed the complete mitogenomes of 18 Oestridae species available from GenBank and the mitogenomes described in this study, with the mitogenome of Sarcophaga tuberosa (Pandellé, 1896) (family Sarcophagidae) as an outgroup (Supplementary Table S1).
Sequences of the complete mitogenomes were aligned using Clustal omega (https://www.ebi.ac.uk/Tools/msa/clustalo/) (Sievers and Higgins 2021; Madeira et al. 2022), and poorly aligned positions and divergent regions were removed using the Gblocks program v 0.91.1 (https://ngphylogeny.fr/tools/tool/276/form) (Talavera and Castresana 2007). Several sequence fragments were removed with the Gblocks program, specifically, approximately 190 bp from the end of the 12 S rRNA gene, the entire D-loop region, and several small fragments of variable length at various locations in the mitogenome. The length of the aligned sequences after running Gblocks was 14,096 bp. The nucleotide substitution models were evaluated using MEGA version 11 (Tamura et al. 2021). Phylogenetic relationships were reconstructed using the Maximum Likelihood (ML) method (Nei and Kumar 2000) implemented in MEGA version 11 (Tamura et al. 2021). Node supports were assessed with 1000 bootstrap replicates.
In addition, a further phylogenetic analysis was performed with different partitions and substitution models for the genes following the same approach as in Lorite et al. (2025). Briefly, all the PCGs were aligned using MAFFT (Katoh and Standley 2013) v7.453, and the phylogenetic relationships were inferred via the Maximum Likelihood partitioned method (Chernomor et al. 2016) in IQTree2 (Minh et al. 2020) using different models for each gene (Supplementary Table S2). The best model for each gene was calculated with ModelFinder (Kalyaanamoorthy et al. 2017), with 1000 ultrafast bootstrap replicates (Hoang et al. 2018) to assess branch support.
Results and discussion
In addition to the description of the mitogenomes of C. auribarbis, C. ulrichii, and P. picta, we performed a comparative analysis with the mitogenomes of 18 species of Oestridae available in GenBank (see Phylogenetic analysis in the Material and Methods section).
Genome organization and nucleotide composition
Five mitogenomes were assembled and annotated, one from each of two larvae of P. picta and two larvae of C. ulrichii and one from a larva of C. auribarbis (Genbank accession numbers: PV856279-PV856283) (Tables 1, 2 and 3). The two mitogenomes of P. picta had the same length but differed in their sequences, while the two mitogenomes of C. ulrichii differed in length and sequence due in both cases to base substitutions and insertions/deletions (Tables 1 and 2). The length of the described mitogenomes lie in the range of the previously described Oestridae mitogenomes, which vary in length between 14,854 bp in G. inermis and G. haemorrhoidalis (Yan et al. 2019) and 16,769 bp in Oestrus sp. (Aleix-Mata et al. 2025) (Supplementary Table S3).
Table 1. Gene organization of the two Pharyngomyia picta mitogenomesGeneStart positionStop positionLength(bp)Intergenicnucleotides (bp)AnticodonStart codonStopcodonStrand trnI 16464−3GATH trnQ 6213069−1TTGL trnM 130197680CATH nad2 1981,2141,017−2ATCTAAH trnW 1,2131,2796725TGAH trnC 1,3051,3686447–55GCAL trnY 1,416-1,4241,480-1,48865−2GTALcox11,479-1,4873,012 − 3,0201,5340TCGT--HtrnL(UUR)3,013 − 3,0213,078 − 3,086666TAAHcox23,085 − 3,0933,771-3,782687–6905ATGTAAH trnK 3,777-3,7883,847-3,85871−1CTTH trnD 3,847-3,8583,912-3,923660GTCH atp8 3,913-3,9244,077 − 4,088165−7ATC/ATTTAAH atp6 4,071 − 4,0824,748-4,759678−1ATGTAAHcox34,748-4,7595,536-5,5477896ATGTAAH trnG 5,543-5,5545,611-5,622690TCCH nad3 5,612-5,6235,965-5,9763541ATCTAAH trnA 5,967-5,9786,031 − 6,04265−1TGCH trnR 6,031 − 6,0426,093 − 6,104631TCGH trnN 6,095 − 6,1066,158-6,169640GTTHtrnS(AGN)6,159-6,1706,226-6,2376817GCTH trnE 6,244-6,2556,308-6,3196518TTCH trnF 6,327-6,3386,393-6,404671GAALnad56,395-6,4068,126-8,1371,732−1ATTT--L trnH 8,126-8,1378,193-8,204680GTGL nad4 8,194-8,2059,532-9,5431,339−7ATGT--L nad4L 9,526-9,5379,822-9,83329720ATGTAAL trnT 9,843-9,8609,907-9,924650TGTH trnP 9,908-9,9259,973-9,990662TGGLnad69,976-9,99310,500 − 10,517525−1ATTTAAH cob 10,500 − 10,51711,636 − 11,6531,137−2ATGTAGHtrnS(UCN)11,635 − 11,65211,702 − 11,7196816TGAH nad1 11,719 − 11,73612,666 − 12,6839481TTGTAGLtrnL(CUN)12,668 − 12,68512,731 − 12,748640TAGL rrnL 12,732 − 12,74914,062 − 14,0771,331-1,3290L trnV 14,063 − 14,07814,134 − 14,149720TACL rrnS 14,135 − 14,15014,929 − 14,9447950LD-loop14,930 − 14,94516,6511,722-1,707H
Table 2. Gene organization of the two Cephenemyia ulrichii mitogenomesGeneStart positionStop positionLength(bp)Intergenicnucleotides (bp)AnticodonStart codonStopcodonStrand trnI 16565−3GATH trnQ 6313169−1TTGL trnM 13119868CATH nad2 1991,2151,017−2ATTTAAH trnW 1,2141,2816837–55TGAH trnC 1,319-1,3371,381-1,3996321 − 20GCAL trnY 1,403-1,4201,467-1,48465−2GTALcox11,466-1,4832,999-3,0161,534TCGT--HtrnL(UUR)3,000–3,0173,065 − 3,0826627TAAHcox23,093 − 3,1103,776-3,79368426ATGTAAH trnK 3,803-3,8203,873-3,89071CTTH trnD 3,874-3,8913,936-3,953631GTCH atp8 3,938-3,9554,099 − 4,116162−7ATTTAAH atp6 4,093 − 4,1104,770-4,787678−1ATGTAAHcox34,770-4,7875,558-5,5757896ATGTAAH trnG 5,565-5,5825,629-5,64665TCCH nad3 5,630-5,6475,983-6,000354−2ATTTAGH trnA 5,982-5,9996,046 − 6,06365−1TGCH trnR 6,046 − 6,0636,107-6,12462TCGH trnN 6,108-6,1256,171-6,18864GTTHtrnS(AGN)6,172-6,1896,239-6,25668GCTH trnE 6,240-6,2576,305-6,3226618TTCH trnF 6,324-6,3416,391-6,40868GAALnad56,392-6,4098,123-8,1401,732ATTT--L trnH 8,124-8,1418,188-8,20565GTGL nad4 8,189-8,2069,527-9,5441,339−7ATGT--L nad4L 9,521-9,5389,814-9,8312947ATGTAAL trnT 9,822-9,8399,884-9,90163TGTH trnP 9,885-9,9029,950-9,967662TGGLnad69,953-9,97010,477 − 10,494525−1ATTTAAH cob 10,477 − 10,49411,613 − 11,6301,13717ATGTAAHtrnS(UCN)11,631 − 11,64811,698 − 11,7156816TGAH nad1 11,715 − 11,73212,662 − 12,6799482ATGTAGLtrnL(CUN)12,665 − 12,68212,729 − 12,746651TAGL rrnL 12,731 − 12,74814,059 − 14,0781,329-1,331L trnV 14,060 − 14,07914,131 − 14,15072TACL rrnS 14,132 − 14,15114,919 − 14,938788LD-loop14,920 − 14,93916,446 − 16,4661,527-1,528H
Table 3. Gene organization of the Cephenemyia auribarbis mitogenomeGeneStart positionStop positionLength (bp)Intergenicnucleotides (bp)AnticodonStart codonStopcodonStrand trnI 16666−3GATH trnQ 6413269−1TTGL trnM 132199680CATH nad2 2001,2161,017−2ATTTAAH trnW 1,2151,2826859TGAH trnC 1,3421,4046326GCAL trnY 1,4311,49464−2GTALcox11,4933,0261,5340TCGT--HtrnL(UUR)3,0273,092664TAAHcox23,0973,7806848ATGTAAH trnK 3,7893,858700CTTH trnD 3,8593,923650GTCH atp8 3,9244,085162−7ATTTAAH atp6 4,0794,756678−1ATGTAAHcox34,7565,5447894ATGTAAH trnG 5,5495,614660TCCH nad3 5,6155,968354−2ATTTAGH trnA 5,9676,03165−1TGCH trnR 6,0316,092620TCGH trnN 6,0936,156640GTTHtrnS(AGN)6,1576,224680GCTH trnE 6,2256,2896518TTCH trnF 6,3086,372650GAALnad56,3738,1041,7320ATTT--L trnH 8,1058,168640GTGL nad4 8,1699,5071,339−7ATGT--L nad4L 9,5019,7942949ATGTAAL trnT 9,8049,866630TGTH trnP 9,8679,932662TGGLnad69,93510,459525−1ATTTAAH cob 10,45911,5951,1376ATGTAAHtrnS(UCN)11,60211,6686716TGAH nad1 11,68512,6299452ATGTAGLtrnL(CUN)12,63212,696650TAGL rrnL 12,69714,0191,3230L trnV 14,02014,091720TACL rrnS 14,09214,8797880LD-loop14,88016,3721,493H
The gene organization found in our study is identical to that of the mitogenomes of all previously described Oestridae species. It contains the typical 13 protein-coding genes (PCGs), two rRNA genes, 22 tRNA genes, and a control region (CR or D-loop region) (Fig. 1; Tables 1, 2 and 3) (Gao et al. 2016; Li et al. 2020; Aleix-Mata et al. 2021a, b, 2025). Most of the genes are encoded on the heavy strand, and just four PCGs (nad1, nad4, nad4L, and nad5), the two rRNA genes, and eight of the tRNAs are encoded on the light strand (Fig. 1; Tables 1, 2 and 3) (Supplementary Table S3) (Gao et al. 2016; Li et al. 2020; Aleix-Mata et al. 2021a, b, 2025).
Fig. 1. Map of the mitogenomes of Pharyngomyia picta, Cephenemyia ulrichii, and Cephenemyia auribarbis. Genes encoded by the heavy strand (H) are shown outside the circle and those encoded by the light strand (L) are shown inside the circle. The inner ring shows the GC content of this genome
The base composition and the A + T content of the three complete mitogenomes described here were very similar to the average base composition and A + T content of all previously analyzed Oestridae mitogenomes (Supplementary Table S4). A high A + T bias content is a general characteristic of the mitogenomes of the Oestridae and other dipteran species (Junqueira et al. 2004; Aleix-Mata et al. 2025). In addition, Oestridae mitogenomes show a slight bias toward A in relation to T (positive AT-skew average 0.06) and are clearly biased toward C in relation to G (negative GC-skew average − 0.28). These biases have been described in the mitogenomes of other dipteran species (Junqueira et al. 2004; Aleix-Mata et al. 2025).
Protein-Coding genes (PCGs) and codon usage
The 13 PCGs encoded by the five described mitogenomes range in size from 294 bp (nad4L) to 1534 bp (cox1). The size of most of the genes was identical in the five mitogenomes, the exceptions being cox2, atp8, nad1, and nad4L. The two mitogenomes of P. picta differed in the size of cox2 (687 bp and 690 bp) caused by a three-bp deletion at the 3´ end that does not change the reading frame.
In general, when comparing the PCGs of all Oestridae mitogenomes, only three genes (cox1, cox3, and cob) share the same length in all species. The remaining genes vary in length between the species, although this variation does not affect all the genes to the same extent (Supplementary Table S3).
The comparison of the 13 PCG genes from all mitogenomes described here and those from the 18 Oestridae species demonstrates that, in terms of the nucleotide sequences, the most conserved genes were cox1, cox3, and nad1, and the least conserved were atp8 and nad6.
Regarding the start codons, the two P. picta mitogenomes shared the same start codons in all genes except atp8, which initiated with either ATC or ATT (Table 1). However, the three Cephenemyia mitogenomes described here shared identical start codons in all genes, except the nad3, which used ATT in C. ulrichii and ATC in C. auribarbis (Tables 2 and 3). It is interesting to note that in all the described mitogenomes, the cox1 gene uses the TCG start codon, which differs from the standard invertebrate mitogenome code but is a common feature in this gene in the mitogenomes of the species of the family Oestridae. This feature has also been described in the mitogenomes of species from the families Calliphoridae, Tephritidae, and Culicidae (Gao et al. 2016; Junqueira et al. 2004).
In the 23 mitogenomes analyzed from the Oestridae family, seven genes conserved the same start codons: genes cox2, atp6, cox3, nad4, nad4L, while cob used ATG and cox1 the codon TCG. In the remaining genes, the start codon varied, although in general one start codon was found to be the most frequent (Supplementary Table S3). In general, in Oestridae species analyzed, of the start codons (ATG, ATA, ATT, ATC, TTG, GTG, and TCG) the most commonly used are ATG (49.50%) and ATT (29.76%) and the least used are GTG (0.67%) and TTG (1.34%).
In relation to the stop codons, 10 genes in the C. ulrichii, C. auribarbis (C. trompe and C. stimulator) and P. picta mitogenomes used the same stop codons, the exceptions being the gene nad3, which used TAG in C. ulrichii, C. auribarbis, and C. stimulator, T– in C. trompe, and TAA in P. picta, and the gene cob, which used TAA in all the mitogenomes of Cephenemyia species and TAG in P. picta mitogenome.
In the 23 Oestridae mitogenomes analyzed, only four genes shared the same stop codon, while the remaining genes varied in their stop codons (Supplementary Table S3). Overall, the frequencies of stop-codon usage were TAA (58.19%), the incompletes T– (22.74%), TA- (2.01%), and TAG (17.06%), whereas the AGA codon was never used.
Ribosomal RNA genes and transfer RNA
In the mitogenomes of the Oestridae species, rrnL and rrnS are located between the D-loop and trnL, and are separated by trnV. The rrnS length was 795 bp in P. picta and 788 bp in C. ulrichii and C. auribarbis (Tables 1, 2 and 3) but was 789 bp in C. trompe and C. stimulator (Li et al. 2020; Aleix-Mata et al. 2021a). Variation in this gene in Oestridae species ranges between 597 bp in Gasterophilus nigricornis (Yan et al. 2019) and 795 bp in P. picta (Supplementary Table S3).
The rrnS in the mitogenomes of C. ulrichii, C. auribarbis, and P. picta have an A + T content of 78.40, 79.10, and 78%, respectively. In general, the 23 Oestidae mitogenomes analyzed were A + T rich (with an A + T content average of 76.08%) (Zhang et al. 2016; Li et al. 2020).
The length of the rrnL gene was 1,323 bp in C. auribarbis, and 1,329 bp and 1,331 bp in the mitogenomes of C. ulrichii and P. picta, respectively (Tables 1 and 2, and 3). The variation in this gene in Oestridae species ranged between 1296 bp in an undescribed species of Hypoderma sp. (Zhang et al. 2025) and 1331 bp in P. picta and C. ulrichii (Supplementary Table S3).
The rrnL in the C. auribarbis mitogenome had an A + T content of 82.10%. The two C. ulrichii mitogenomes had 81.40% and 81.30%, while the two P. picta mitogenomes had 81.40% and 81.50%. In general, the 23 analyzed Oestridae mitogenomes were A + T rich (with an A + T content average of 78.99%) like other dipteran species (Weigl et al. 2010; Zhang et al. 2014; Li et al. 2020).
All 22 typical tRNAs were identified in the mitogenomes described here and in all the other mitogenomes of Oestridae species. They had highly conserved lengths ranging from 61 bp (trnC) to 72 bp (trnV) (Supplementary Table S3), which add up on average to 1457 bp in length.
Non-Coding regions
The mitogenome genes of the species described here overlap or have intergenic non-coding nucleotides in several positions. The overlapping nucleotides vary from one to seven in 10 to 12 positions depending on the mitogenome; the intergenic nucleotides vary from 1 to 59 bp in 11 to 14 positions between genes (Tables 1, 2 and 3).
The D-loop region, located between the rrnS gene and trnI gene, varied in length: 1527 bp and 1528 bp in C. ulrichii, 1493 bp in C. auribarbis, and 1707 bp and 1722 bp in P. picta (Tables 1 and 2, and 3). In Oestridae mitogenomes, the D-loop region length varies between 58 bp in Gasterophilus inermis and G. haemorrhoidalis (Yan et al. 2019) and 1,722 bp in P. picta (Supplementary Table S3).
The D-loop region is the most variable region of the Oestridae mitogenomes and the variation in length and in sequences makes sequence alignment very difficult. Indeed, the average of identity is 51.48%. The D-loop region in all the analyzes of Oestridae species has an average of 80.58% of A + T content, ranging from 62.1% in G. inermis and G. haemorrhoidalis (Yan et al. 2019) to 89.5% in Hypoderma bovis (Chen et al. 2023).
Phylogenetic analysis
The phylogenetic relationships were studied with a Maximum-Likelihood (ML) tree using the complete mitogenomes (Supplementary Fig. S1) and with different partitions and substitution models for the PCGs (Fig. 2). In total 24 mitogenomes were included in the analyses, five of which were those of C. ulrichii, C. auribarbis, and P. picta newly described here. The remaining 18 mitogenomes from Oestridae species were available in GenBank; the mitogenome of Sarcophaga tuberosa (Diptera: Sarcophagidae) was included as an outgroup (Kai et al. 2019) (Supplementary Table S1).
Fig. 2. Phylogenetic tree inferred with the Maximum Likelihood partitioned method in IQTree2 using different models for each PCG gene sequences of the mitogenomes of Pharyngomyia picta, Cephenemyia ulrichii,* Cephenemyia auribarbis*, and 18 other Oestridae species. The data at the nodes correspond to Bootstrap supports of 1000 replicates and represent the statistical support
The same topology and almost identical support were obtained either in the complete mitogenomes tree (Supplementary Fig. S1) or the PCGs partitioned tree (Fig. 2), the only difference being the association of C. titillator with the Gasterophilinae in the former and with Hypodermatinae in the latter. The four subfamilies of Oestridae, including their respective genera and species, are grouped into clear well-differentiated branches with high statistical support. The species of the genus Cephenemyia grouped into one cluster, with Pharyngomyia as a sister genus, and clustered with another group including the genera Oestrus and Rhinoestrus. This association between the genera Oestrus, Rhinoestrus, and Cephenemyia has been previously documented in other phylogenetic analyses (Pape 2001; Moreno et al. 2015; Pape et al. 2017; Aleix-Mata et al. 2025). In general, our data agree with previous analyses of the phylogenetic relationships between genera in the family Oestridae (Moreno et al. 2015; de la Fuente et al. 2021; Aleix-Mata et al. 2025). However, Cephalopina titillator (Clark, 1816) from the Oestrinae family clusters with the stomach bot flies (Gasterophilinae) or with warble flies (Hypodermatinae), thereby splitting this subfamily Oestrinae into two separate groups. Phylogenies carried out with mitogenome genes demonstrated both the association between C. titillator and Gasterophilinae (Shamsi et al. 2023; Yao et al. 2025) and the association between C. titillator and species of Oestrinae (Li et al. 2020; Chen et al. 2023).
Conclusions
This study presents the first complete description and characterization of the mitogenomes for Cephenemyia auribarbis, C. ulrichii, and Pharyngomyia picta. Our comparative analysis shows that these mitogenomes have a highly conserved structure and gene order, similar to other Oestridae species. While protein-coding genes and ribosomal RNAs are highly conserved, significant intraspecific variability was found in the length and sequence of the D-loop region, confirming it as the most divergent part of the bot fly mitogenome. Phylogenetic analysis of both complete mitogenomes and partitioned protein-coding genes clearly resolved the evolutionary relationships of these species. Our results confirm the monophyly of Cephenemyia and place Pharyngomyia as its closest sister genus, forming a well-supported clade with Oestrus and Rhinoestrus. These findings highlight the value of mitogenome data in understanding Oestridae evolution. The described mitogenomes provide essential resources for future studies on taxonomy, population genetics, and molecular evolution of these specialized parasites.
Supplementary Information
Below is the link to the electronic supplementary material.
Supplementary Material 1