Circulating tumour DNA (ctDNA) as a predictor of progression-free and overall survival in non-resectable pancreatic cancer: a systematic review and meta-analysis
Mette M. Steiniche, Louise B. Callesen, Elizabeth H. Vlk, Lise Ventzel, Signe Timm, Rikke F. Andersen, Sidsel C. Lindgaard, Torben F. Hansen, Morten Ladekarl, Karen-Lise G. Spindler

TL;DR
This study reviews evidence showing that circulating tumor DNA (ctDNA) can predict survival outcomes in patients with non-resectable pancreatic cancer, but more standardized methods are needed for clinical use.
Contribution
The study provides a meta-analysis showing strong prognostic value of ctDNA in non-resectable pancreatic cancer, highlighting the need for standardized thresholds.
Findings
High baseline ctDNA levels are linked to shorter overall and progression-free survival.
Unfavorable ctDNA changes during treatment are associated with worse survival outcomes.
Many studies had high risk of bias due to methodological inconsistencies.
Abstract
This systematic review and meta-analysis synthesised current evidence on circulating tumour DNA (ctDNA) for predicting clinical outcomes in patients with non-resectable pancreatic ductal adenocarcinoma (PDAC). PubMed, Embase, and Cochrane databases were searched up to 31/01/2025. Eligible studies reported prognostic value of ctDNA in patients with non-resectable PDAC. Meta-analyses evaluated associations between baseline ctDNA and changes in ctDNA during treatment (ctDNA kinetics) and survival outcomes. Risk of bias was assessed using the Quality in Prognosis Studies (QUIPS) tool. Sixty-four studies involving 5652 patients with non-resectable PDAC were included, with 24 studies contributing to meta-analyses. High baseline ctDNA level implied shorter overall survival (OS; HR = 2.3, 95 % CI 1.9–2.8; n = 1883) and progression-free survival (PFS; HR = 2.1, 95 % CI 1.8–2.4; n = 1196).…
Genes, proteins, chemicals, diseases, species, mutations and cell lines named across the full text — each resolved to its canonical identifier and authoritative record.
Click any figure to enlarge with its caption.
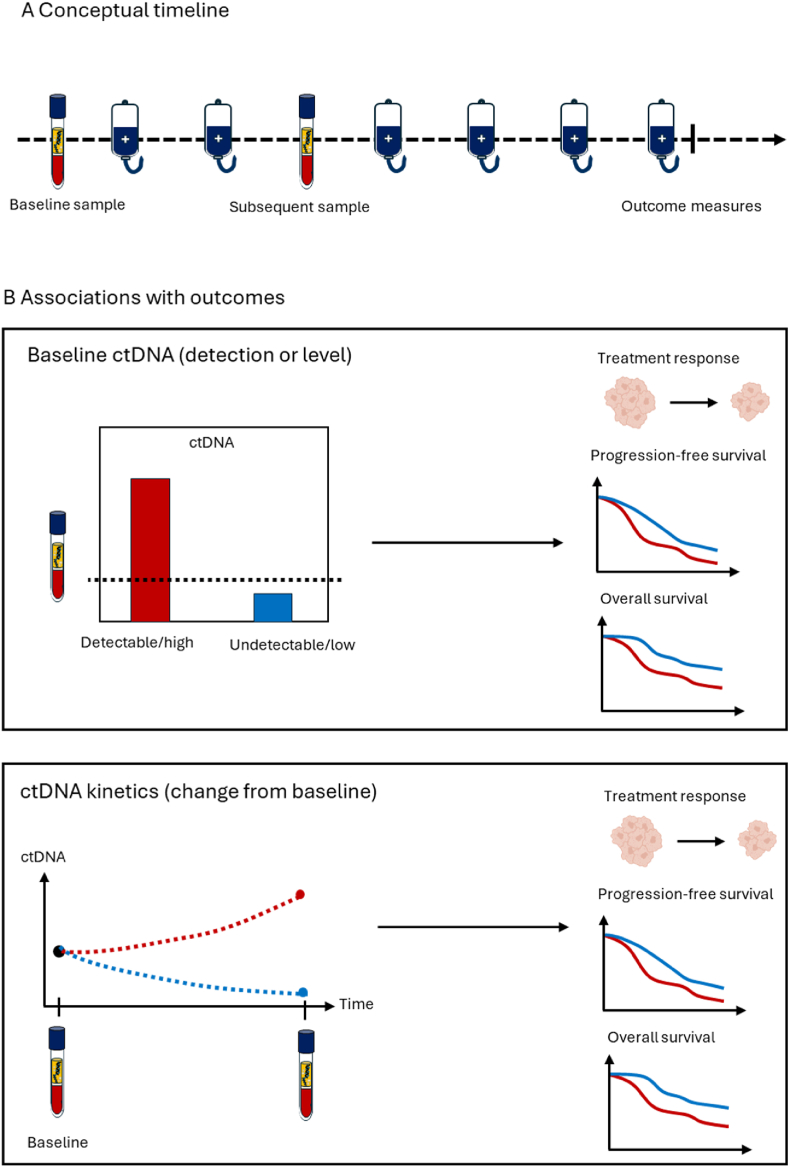 Figure 1
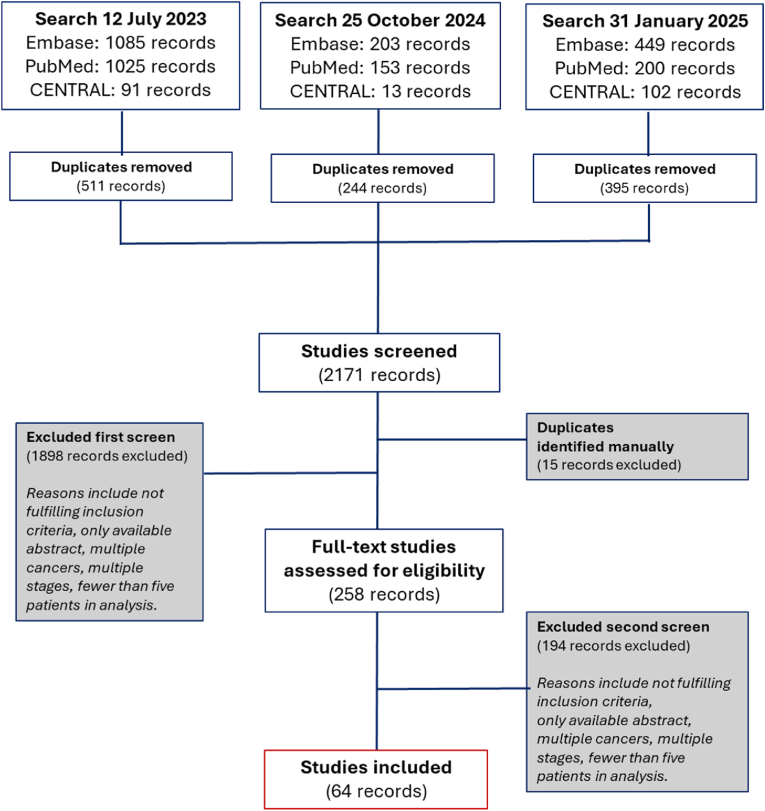 Figure 2
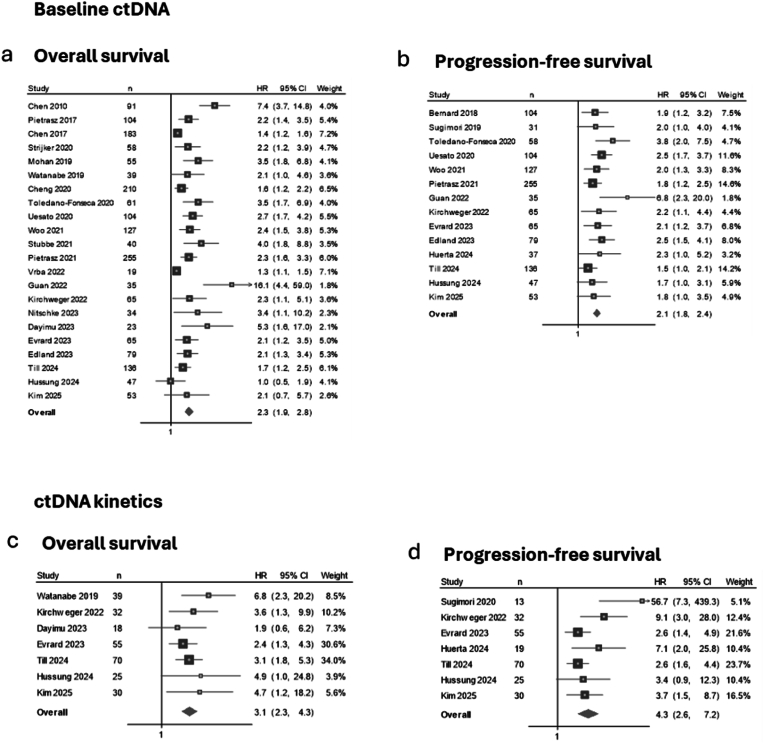 Figure 3
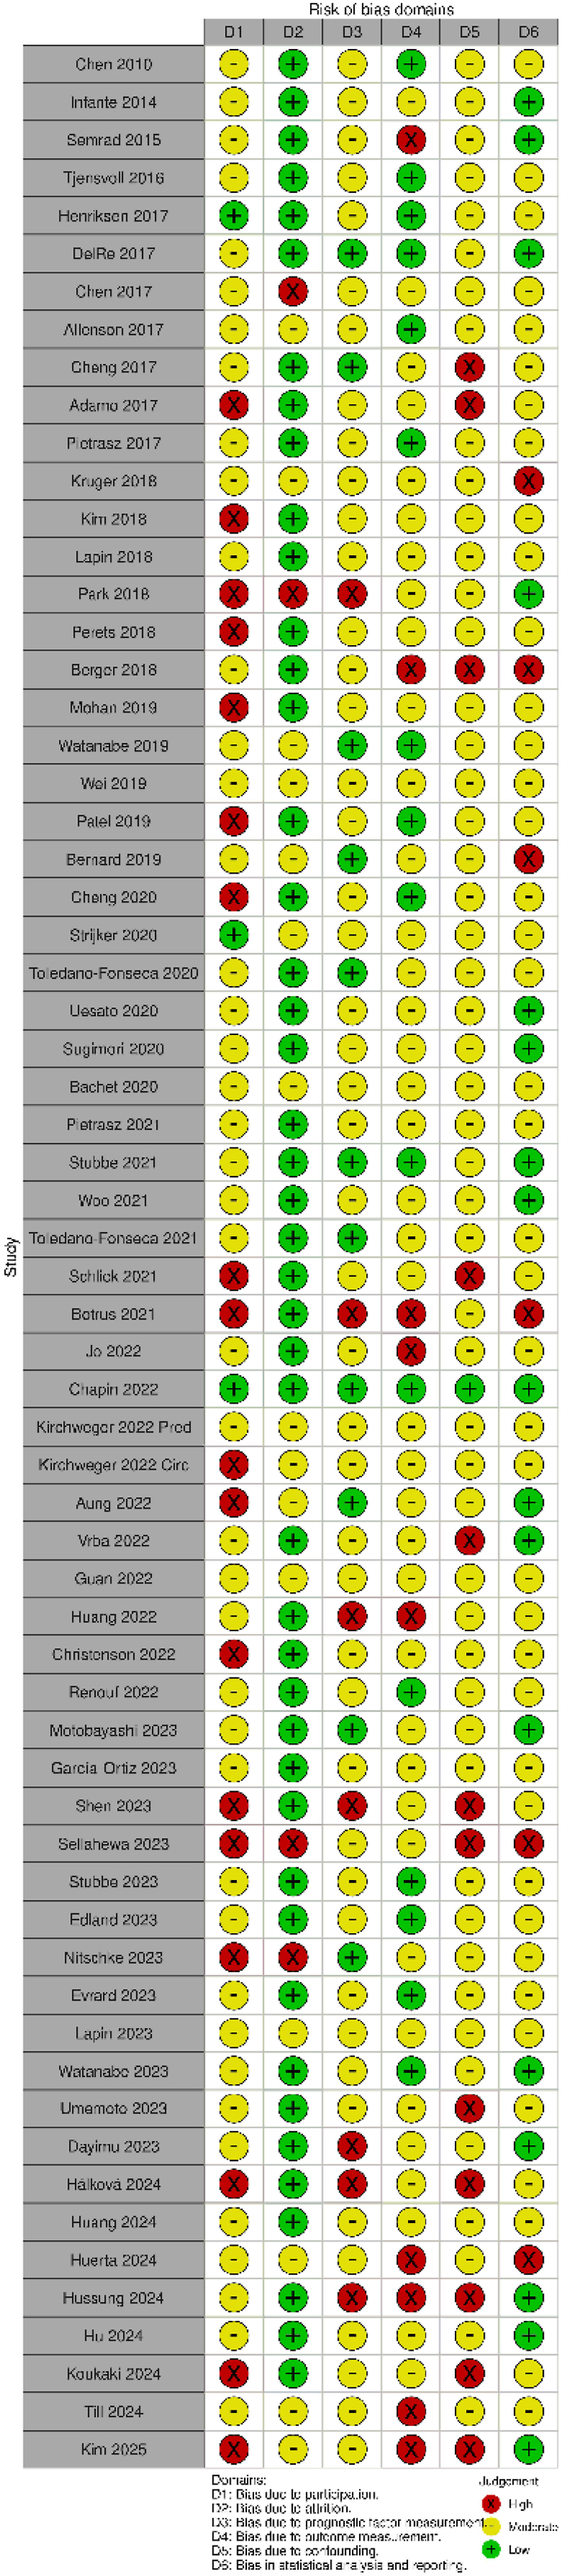 Figure 4
Peer Reviews
No public reviews on file for this paper yet. If you reviewed it on a platform where reviews are public (OpenReview, ICLR, NeurIPS, ICML), you can paste yours below so the community can read it here.
Videos
No videos yet. Explain this paper in a talk, walkthrough, or lecture? Add one.
Taxonomy
TopicsCancer Genomics and Diagnostics · Pancreatic and Hepatic Oncology Research · Multiple and Secondary Primary Cancers
Introduction
1
Pancreatic ductal adenocarcinoma (PDAC) is a highly lethal malignancy, with a 5-year survival rate of only 13 % [1]. More than 80 % of patients present with non-resectable disease, facing a median overall survival (OS) of under 1 year [2,3]. While combination chemotherapy improves OS, its benefits are often offset by toxicity, and many patients, already frail and malnourished, may not tolerate second-line treatment upon disease progression [[3], [4], [5], [6]]. This therapeutic challenge underscores the urgent need for reliable tools to evaluate treatment benefits in this patient population.
Current standard response evaluation relies on imaging, which has several limitations in PDAC. Objective response, as defined by Response Evaluation Criteria in Solid Tumors (RECIST), correlates only modestly with OS, and many patients have non-measurable disease, e.g., confined to the peritoneum or the primary tumour in the pancreas. In the latter case, the reproducibility and accuracy of measurements are usually compromised by the dense fibrotic stroma and peritumoral inflammatory changes [[7], [8], [9], [10]]. In addition, the treatment efficacy is first evaluated after 8–12 weeks of chemotherapy, potentially exposing patients to prolonged toxicity of an ineffective treatment. The only approved biomarker in PDAC, the tumour marker CA19–9, has inconsistent predictive value and is influenced by non-malignant conditions such as pancreatitis and cholestasis [[11], [12], [13]]. Moreover, 10–15 % of the population are non-expressors, which further reduces the clinical utility [[11], [12], [13]]. These limitations emphasise the need for more reliable and universally applicable biomarkers to inform treatment decisions.
Liquid biopsies have emerged as a promising approach to meeting this need. Circulating tumour DNA (ctDNA) in the blood has been studied for several years, and recent clinical studies have validated specific ctDNA assays for use across various tumour types [[14], [15], [16], [17]]. Being minimally invasive, rapidly measurable, and easily repeatable, ctDNA holds promise as a tool to optimize clinical management of patients with PDAC across various treatment settings. In the palliative context, its short half-life may allow earlier assessment of treatment benefits, enable timely treatment modifications, and support discontinuation of ineffective therapy [14,15], all of which are of particular importance in this patient population. However, while current ESMO guidelines recognise ctDNA as a promising tool for assessment of treatment efficacy, they do not endorse its routine use in PDAC [8,17].
This study presents a systematic review and meta-analysis evaluating the associations between ctDNA levels and kinetics and clinical outcomes, including response and survival, in patients with incurable, non-resectable PDAC.
Materials and methods
2
Eligibility criteria
2.1
Studies were eligible for inclusion if they met all the following criteria pre-specified in the review protocol: (1) studies involving patients with non-resectable PDAC; (2) studies reporting on the clinical value of ctDNA measured in blood plasma or serum at baseline and/or during systemic treatment; and (3) studies in which ctDNA was associated with OS, progression free survival (PFS) and/or treatment response. The review protocol was registered in PROSPERO (CRD42023438774) and follows the PRISMA reporting guidelines [18], checklist in Supplementary material 1. For criterion (1), studies including both non-resectable and resectable or borderline resectable disease were eligible if outcomes for the non-resectable subgroup were reported separately. For criterion (2), studies had to report the ctDNA levels or detectability at baseline, or changes in ctDNA levels or detectability during systemic treatment.
Search strategy
2.2
The databases PubMed, MEDLINE, EMBASE, and Cochrane Central Register of Controlled Trials were searched to identify relevant studies up to July 12th, 2023. Updated searches were conducted until January 31st, 2025. No restrictions were applied regarding language, study design, publication year, or publication type. All identified studies were screened for eligibility, but only studies with full-text data available were eligible for inclusion. The complete search strategy, including specific search strings, is presented in the Supplementary material 2**.**
Study screening and inclusion
2.3
Literature screening, data extraction, and quality assessment were conducted using the web-based software platform Covidence [19]. Each stage of the review process (screening, eligibility, inclusion, and data extraction) was independently performed by at least two researchers (MMS, LBC, EHV, LV). Following import from the selected databases, duplicates were automatically removed. Title and abstract screening was performed to categorise studies for inclusion, exclusion, or further assessment in cases of uncertainty. Full-text articles were then assessed within Covidence. Eligibility screening followed the predefined inclusion criteria, with disagreements resolved through discussion to reach consensus. Notably, no non-English studies were identified during screening.
Data extraction was conducted using a customised template to capture key study details, including first author, publication year, study design, number of patients, treatment (type and line), analytical method for ctDNA measurement, ctDNA marker, evaluated cut-off, treatment response, applied statistical test, and hazard ratios (HRs) for PFS and OS, along with 95 % confidence intervals (CIs), and p-values. Observational studies with prospectively collected data and samples for biomarker analysis were defined as prospective biomarker studies. Phase I/II trials tested investigational treatments and were classified as single-arm trials if lacking a comparator. Combined prospective biomarker study and randomized controlled trial (RCT) included biomarker discovery or validation sub-studies nested within RCTs, while exploratory studies focused on hypothesis generation.
Quality assessment
2.4
The risk of bias was evaluated across the following domains: study participation, study attrition, ctDNA measurement, outcome measurement, study confounding, and statistical analysis and reporting, following the Quality in Prognosis Studies (QUIPS) tool [20]. Three researchers (MMS, LBC, LV) independently assessed quality, and all papers were assessed by at least two researchers. Any discrepancies were resolved through discussion, involving a third party when necessary.
Synthesis of results
2.5
The clinical relevance of ctDNA as a prognostic biomarker in patients with non-resectable PDAC was evaluated based on two approaches: (1) baseline ctDNA levels or detection, and (2) on-treatment changes in ctDNA levels or detectability (referred to as ctDNA kinetics). Baseline ctDNA was defined as the level or detection of ctDNA before initiating systemic therapy. ctDNA kinetics referred to changes observed from baseline to a time point during treatment as reported in the individual studies (Fig. 1).Fig. 1. Conceptual illustration of ctDNA assessments and associations with clinical outcomes.Conceptual timeline illustrating sampling time points including baseline sample prior to initiation of the current treatment line and a subsequent sample later in the treatment course. In eligible studies, baseline ctDNA detection or level and/or change in ctDNA detection or level from baseline (ctDNA kinetics) were correlated to treatment response, progression-free survival and/or overall survival.Fig. 1
Core data were summarised in tables, including assessments of the association between baseline ctDNA or ctDNA kinetics and clinical outcomes. For meta-analyses, univariate HRs for PFS and OS were extracted as reported in the individual studies and presented in forest plots, with studies ordered chronologically by publication date. The HRs reflected comparisons based on study-specific thresholds for dichotomisation. Changes in ctDNA during treatment are referred to as favourable or unfavourable ctDNA kinetics.
In studies reporting multiple results for the same clinical outcome, for example, using different ctDNA markers or cut-offs, all results were included if they were derived from independent cohorts. If multiple results originated from the same cohort, pre-specified cut-offs were priorities; if not available, the analysis with the most complete data (HRs, 95 % CIs, p-value, and sample size) was included. In cases where data completeness was equal, the result covering the largest patient population across studies was prioritised. This selection principle was applied consistently across the meta-analyses. No quantitative synthesis was performed for treatment response outcomes due to limited reporting.
Statistical analysis
2.6
Studies providing HRs with corresponding 95 % CIs from univariate survival analyses were eligible for inclusion in meta-analyses estimating the association between ctDNA and clinical outcomes, specifically PFS and OS.
Clinical and methodological heterogeneity was assessed based on differences in study design, patient populations, blood sampling time points, ctDNA analytical method, ctDNA markers, and cut-off values. Study-specific results were visualised in forest plots.
Statistical heterogeneity was evaluated using visual inspection of forest plots and quantified using I^2^ statistics, with values above 50 % and 70 % considered indicative of moderate and high heterogeneity, respectively [21]. In line with the aim of summarising the existing literature, pooled estimates were reported unless the observed clinical or methodological heterogeneity exceeded expectations based on the pre-defined eligibility criteria. To account for the variability, a random-effects model was applied [22]. In parallel, a structured descriptive synthesis summarised findings from all included studies.
All analyses were conducted using Stata software version 18.5 (Stata Corp, College Station, TX, USA). A two-sided p-value <0.05 was considered statistically significant.
Results
3
Study selection and clinical context
3.1
A total of 2156 unique studies were identified and screened based on the eligibility criteria. Only studies with published full texts were included, resulting in 258 studies undergoing full-text review. The reasons for exclusion during this review included studies that reported on multiple cancer types, multiple disease stages, including resectable disease, no treatment or survival outcomes, used sample materials other than plasma or serum, or fewer than five in the analysis (Fig. 2). Ultimately, 64 studies met the inclusion criteria and were included in the final review (Fig. 2).Fig. 2. Flowchart of the study selection process.Overview of the identification, screening, eligibility assessment, and inclusion of studies.Fig. 2
The studies included 6422 patients, 5652 of whom had non-resectable PDAC – 4814 patients (85 %) with metastatic disease (stage IV), and 838 (15 %) with locally advanced disease (stage III). Two studies did not specify the disease stages among patients with non-resectable PDAC. The association between ctDNA and treatment or survival outcomes was reported for at least 2073 patients receiving palliative systemic treatment of non-resectable PDAC. Of the included studies, 24 contributed to at least one meta-analysis.
Across studies, the most frequently reported treatments were gemcitabine-based, either alone or combined with nab-paclitaxel. FOLFIRINOX and other 5-FU-based therapies (e.g., FOLFOX, FOLFIRI, oral fluoropyrimidines) were also frequently used. Most studies focused on first-line treatment; only two included later-line therapies.
Baseline ctDNA and clinical outcomes
3.2
Study characteristics
3.2.1
Sixty-three studies evaluated the prognostic impact of ctDNA detection or level before initiation of first- or later-line treatment (Table 1) [[23], [24], [25], [26], [27], [28], [29], [30], [31], [32], [33], [34], [35], [36], [37], [38], [39], [40], [41], [42], [43], [44], [45], [46], [47], [48], [49], [50], [51], [52], [53], [54], [55], [56], [57], [58], [59], [60], [61], [62], [63], [64], [65]]. These studies varied in study design, treatment line, analytical method, ctDNA marker, and ctDNA positivity threshold.Table 1. Studies reporting on association between baseline ctDNA level or detection and treatment response and/or survival.Table 1. First authorYearStudy designLine of treatmentAnalytical methodPDAC (n)Baseline ctDNA associated withReference numberTreatment responseProgression free survivalOverall survivalChen2010PBSFirst-linePCR amplification/direct sequencing91NANAYes39Infante2014Prospective phase II trialFirst-linedPCR/BEAMing160NANAD82Semrad2014Prospective phase II trialFirst-lineARMS PCR30NAYesYes43Tjensvoll2015PBSFirst-lineqPCR14DYesNo54Pietrasz2016PBSFirst-lineddPCR/targeted sequencing135DNAYes74Allenson2017PBSVarious/unknownddPCR127NANANo57Cheng2017PBSVarious/unknownddPCR/targeted sequencing211DNAMixed64Del Re2017PBSFirst-lineddPCR27NoNoNo40Adamo2017PBSFirst-lineTargeted sequencing33NANAD69Henriksen2017PBSFirst-lineMethylation specific PCR95NANAYes38Chen2017PBSFirst-lineTargeted sequencing189DYesYes42Berger2017PBSVarious/unknownTargeted sequencing20NANANA86Perets2018PBSFirst-lineTargeted sequencing17NANAYes72Park2018PBSFirst-lineDeep sequencing/ddPCR17DNANA60Bernard2018PBSFirst-lineddPCR194YesDYes78Kim2018PBSFirst-lineddPCR106NANoNo51Wei2018PBSFirst-lineTargeted sequencinga38NANAYes55Kruger2018PBSFirst-lineBEAMing54YesYesYes45Lapin2018PBSFirst-lineFragment length analysis61NAYesYes56Strijker2019PBSFirst-lineNGS/targeted sequencing60DNAYes58Mohan2019PBSFirst-lineddPCR/targeted sequencinga55NANAYes48Patel2019PBSVariousTargeted sequencing112NANAYes79Sugimori2019PBSFirst-linedPCR47NANoNA70Watanabe2019PBSFirst-lineddPCR78NAYesYes50Cheng2020PBSFirst-lineddPCR210NANAYes53Bachet2020Phase II RCTSecond-lineTargeted sequencing141YesYes****Yes85Toledano-Fonseca2020PBSFirst-lineBEAMing61DYesYes66Uesato2020PBSVarious/unknownTargeted sequencing104DYesYes73Toledano-Fonseca2021PBSFirst-lineBEAMing58NAYesYes49Schlick2021PBSVarious/unknownqPCR42NANAYes62Woo2021PBSFirst-lineWhole genome sequencing315DYesYes61Stubbe2021PBSFirst-lineMethylation specific PCR100NANAYes36Pietrasz2021PBS/RCTFirst-lineddPCR/targeted sequencing510NAYesYes35Kirchweger2021PBSVarious/unknownddPCR107NANAMixed68Botrus2022PBSFirst-lineTargeted sequencing104YesYesMixed81Vrba2022PBSVarious/unknownqPCR19NANAYes75Jo2022Single-arm phase I/IIFirst-lineTargeted sequencing34DNANA52Huang2022PBSFirst-lineTargeted sequencinga74DNANA77Chapin2022PBSFirst-lineddPCR104NANAYes63Guan2022PBSFirst-lineTargeted sequencinga40NAYesYes76Renouf2022RCT (treatment arm)First-lineTargeted sequencing180NAYesYes84Kirchweger2022PBSVarious/unknownddPCR70YesYesYes65Christenson2022PBSFirst-lineTargeted sequencing12YesNoMixed80Aung****2022Phase IISecond-lineTargeted sequencing16DNA****NA67Nitschke2023PBSVarious/unknownddPCR108NANAYes44Lapin2023PBSFirst-lineTargeted sequencing56DYesYes47Umemoto2023PBSVarious/unknownTargeted sequencing540NANAYes71Dayimu2023PBS/RCTFirst-lineddPCR146NoNAYes83Sellahewa2023PBSFirst-lineddPCR81NANAYes34Watanabe2023PBSFirst-lineddPCR61NANAYes59Stubbe2023PBSFirst-lineqPCR96NANAMixed37Evrard2023PBSFirst-lineddPCR69YesYesYes46Edland2023PBSFirst-lineqPCR81YesYesYes41Garcia-Ortiz2023PBSFirst-lineddPCR/BEAMing44NAYesYes32Shen2023PBSVarious/unknownTargeted sequencing153DNANA33Motobayashi2024PBSFirst-lineddPCR20NADNA31Hu2024Prospective phase IIVarious/unknownTargeted sequencing24DNANA26Huang2024PBSFirst-lineTargeted sequencinga43NAYesMixed29Koukaki2024PBSFirst-lineqPCR105NANAMixed24Huerta2024PBSFirst-lineddPCR80NAYesNo25Till2024PBS/phase I/IIFirst-lineddPCR214NAYesYes28Halkova2024PBSFirst-linePCR118NANAMixed27Hussung2024Exploratory studyFirst-lineddPCR47DMixedNo23Kim2025PBSFirst-lineTargeted sequencing64NANoNo30Abbreviations: PBS, prospective biomarker study, RCT, randomised controlled trial, PCR, polymerase chain reaction, dPCR, digital PCR, ddPCR, digital droplet PCR, NGS, next generation sequencing, qPCR, quantitative PCR, CGE, capillary gel electrophoresis, NA, not applicable, D, descriptive, PFS, progression-free survival, OS, overall survival. Studies eligible for meta-analysis marked with bold.aComprehensive genome profile assays (>300 genes).
Study design and population
3.2.2
The studies were primarily designed as prospective biomarker studies (n = 52) ([24,25,27,[29], [30], [31], [32], [33], [34],[36], [37], [38], [39], [40], [41], [42]], [[44], [45], [46], [47], [48], [49], [50], [51],[53], [54], [55], [56], [57], [58], [59], [60], [61], [62], [63], [64], [65], [66]], [[68], [69], [70], [71], [72], [73], [74], [75], [76], [77], [78], [79], [80], [81]]), followed by phase II trials (n = 5) [26,43,67,82,85], a combination prospective biomarker study and randomised controlled trial (RCT) (n = 2) [28,35], single-arm trials (n = 2) [52,84], and exploratory studies (n = 2) [23,83]. The sample sizes ranged from 12 to 540 patients, with 38 studies (60 %) enrolling fewer than 100 patients ([23,25,26,[29], [30], [31], [32], [33], [34], [35], [36], [37], [38], [39], [40]], [[41], [42], [43], [44], [45], [46], [47], [48], [49], [50], [51], [52], [53], [54], [55], [56], [57], [58], [59], [60], [61], [62], [63], [64], [65], [66], [67], [68], [69], [70], [71], [72], [73], [74], [75], [76], [77], [78], [79], [80], [81], [82], [83]]).
In 49 studies, patients received first-line systemic treatment ([[23], [24], [25],[27], [28], [29], [30], [31], [32],[34], [35], [36], [37], [38], [39], [40], [41], [42], [43],[45], [46], [47], [48], [49], [50], [51], [52], [53], [54], [55], [56],[58], [59], [60], [61]], [63,66,69,70,72,74], [[76], [77], [78],[80], [81], [82], [83], [84]]). Only two studies reported on second-line treatment [67,85]. In the remaining studies, the treatment lines were either various or unknown [26,33,44,57,62,64,65,68,71,73,75,79].
Analytical methods, ctDNA markers, and detection rates
3.2.3
For detection and quantification of ctDNA, most studies used either polymerase chain reaction (PCR) based analytical methods (n = 34) [[23], [24], [25],28,[30], [31], [32],34,[36], [37], [38], [39], [40], [41],[43], [44], [45], [46],49,50,53,54,57,59,62,63,65,66,68,70,75,78,82,83], targeted sequencing, e.g., Next Generation Sequencing (NGS) (n = 20) [26,29,30,33,42,47,52,55,58,67,[71], [72], [73],76,77,[79], [80], [81],84,85], or a combination of those (n = 6) [35,39,48,60,64,74]. Other approaches comprised capillary gel electrophoresis (n = 1) [27] and whole-genome sequencing (n = 1) [61].
A tumour-agnostic approach targeting KRAS mutations was the most widely used method of ctDNA detection and quantification (n = 36) [23,25,27,28,31,33,34,[39], [40], [41], [42], [43], [44], [45],[48], [49], [50], [51],53,54,57,59,62,63,[65], [66], [67], [68], [69], [70],72,77,78,[82], [83], [84]]. Five studies used small gene panels including up to eight genes (including KRAS) [46,55,58,64,80] Larger gene panels were used in 11 studies [26,30,52,71,73,74,76,77,79,81,85], and aberrant methylation patterns in one or more genes were used in 7 studies [24,32,[35], [36], [37], [38],75]. Of the five studies employing comprehensive genomic profiling assays [29,48,55,76,77], four focused on a limited gene subset [48,55,76,77], while only one reported results for the entire panel [29].
In 32 studies reporting specifically on patients with metastatic PDAC [[23], [24], [25], [26],30,32,33,36,38,[49], [50], [51],57,58,[64], [65], [66], [67], [68],[72], [73], [74], [75], [76], [77], [78], [79], [80], [81], [82], [83], [84], [85]], the baseline ctDNA detection rate ranged from 29 % to 100 %, with a 100 % detection rate observed in studies using large gene panels [29,76], KRAS-targeted sequencing [67] and methylation-specific PCR assays [75]. Studies presenting data from patients with locally advanced and metastatic PDAC combined (n = 25) [31,37,[39], [40], [41], [42], [43], [44], [45], [46], [47], [48],[52], [53], [54], [55], [56],59,62,63,70,71,74,77,81] found a ctDNA detection rate ranging from 33 % to 94 %. Only two studies reported the ctDNA detection rate specifically for locally advanced PDAC, with, respectively, 31 % and 74 % detection rates [57,81]. The remaining studies reported the detection rate across multiple disease stages or did not report it.
Most studies reported ctDNA status at baseline based on the assay's detection limit, either as the sole cut-off or as one of several reported thresholds (n = 51) ([[23], [24], [25]], [27,28,30,31,[33], [34], [35], [36], [37], [38], [39], [40], [41]], [43,45,48,[50], [51], [52], [53], [54], [55],57], [58,60,[62], [63], [64], [65]], [[67], [68], [69], [70], [71], [72], [73], [74], [75], [76],78,79], [[81], [82], [83], [84], [85]]). Six studies reported on a specific ctDNA concentration [42,44,46,49,59,66], and each of the remaining used a continuous ctDNA value, a genomic instability score, the median fragment length, the median mutant allele frequency, or only reported descriptive results [26,56,61,77,80].
Overall survival
3.2.4
Thirty-six studies found a statistically significant association between baseline ctDNA above the chosen threshold and shorter OS [28,32,[34], [35], [36],38,39,[41], [42], [43], [44], [45],[47], [48], [49], [50],53,55,56,58,59,[61], [62], [63],65,66,[71], [72], [73],75,76,78,79,[83], [84], [85]], whereas six studies did not support this association [23,25,30,40,51,57]. In 10 studies reporting multiple analyses, results were diverging, depending on the disease stage, the chosen cut-off, or the ctDNA marker evaluated [24,27,37,46,54,64,68,77,80,81]. The remaining studies either presented baseline ctDNA in relation to OS descriptively without a statistical test or did not evaluate the association [26,31,33,52,60,67,69,70,77,82,86].
Progression-free survival
3.2.5
In 17 studies, baseline ctDNA above the study-defined threshold implied a shorter PFS [25,28,32,35,41,47,49,50,61,65,66,73,77,78,81,84,85], whereas five studies did not find a statistically significant correlation [23,30,40,46,51,54,70,76,80]. Results were diverging in four studies, where multiple analyses within the same study led to varying associations with PFS(23,46,54,76). The remaining studies either presented the association without a statistical test or did not assess it [24,26,27,31,33,34,[36], [37], [38], [39],44,48,52,53,55,[57], [58], [59], [60],[62], [63], [64],[67], [68], [69],71,72,74,75,[77], [78], [79],82,83,86].
Treatment response
3.2.6
Ten studies reported on treatment response assessed by imaging in relation to pre-treatment ctDNA status or level. Eight studies reported an association [41,45,46,65,78,80,81,85], while two failed to support it [40,83]. No common effect estimate was reported, precluding further quantitative analyses.
ctDNA kinetics and clinical outcomes
3.3
Study characteristics
3.3.1
Forty of the included studies assessed the association between ctDNA kinetics during treatment and clinical outcomes (Table 2) [23,25,26,[28], [29], [30], [31], [32], [33],[40], [41], [42],[45], [46], [47],[50], [51], [52],54,55,[58], [59], [60], [61], [62],[64], [65], [66], [67],70,72,74,[76], [77], [78],80,81,83,85,86]. They were characterised by variation in sampling time points, analytical methods, ctDNA markers, and the cut-off for ctDNA kinetics.Table 2. Studies reporting on association between ctDNA kinetics and treatment response and/or survival.Table 2. First authorYearStudy designCut-off dynamicsNSecond samplectDNA kinetics associated withReferenceTreatment responseProgression-free survivalOverall survivalnumberTjensvoll2015PBSD104 weeksDNANA54Pietrasz2016PBSD830–45 daysDNANA74Cheng2017PBSD138 weeksYesNANA64Del Re2017PBSIncrease vs. Stability/reduction2515 daysNoYesYes40Chen2017PBSD32EvalDNANA42Berger2017PBSIncrease vs. decline in MAF204 weeksNAYesNA86Perets2018PBSctDNA slope15VarNANAYes72Park2018PBSD8VarDNANA60Bernard2018PBSMAF>1 %34VarYesNANA78Kim2018PBSIncrease563 monthsNANoNo30Wei2018PBSD17EvalDNANA55Kruger2018PBSAny increaseNRSerialYesYesYes45Strijker2019PBSD4VarDNANA58Sugimori2019PBSClearance vs. Persistence21****4–8 weeksNAYesNA70Watanabe2019PBSEmergence393 monthsNAYesYes50Bachet2020Phase II RCTIncrease vs. decrease in VAF7128 daysYesYesYes85Toledano-Fonseca2020PBSVar7NRDNANA66Schlick2021PBSKRAS Cq ratioNR1 month/EvalDNANA62Woo2021PBSBinary I-score groups182 monthsDNANA61Botrus2022PBSClearance23SerialYesYesYes81Jo2022Single-arm phase I/IID18After C2DNANA52Huang2022PBSDNRAfter C2DNANA77Guan2022PBSD24VaryingDNANA76Kirchweger2022PBSReduction >57,9 % vs. <57,9 %322 weeksYesYesYes****65Christenson2022PBSContinuous KRAS122 monthsYesMixedYes80Aung2022Phase II trialD10C2D1, day 22DNANA67Lapin2023PBSReduction >10-fold vs. <10-fold251–2 monthsDMixedYes47Dayimu2023Explorative biomarker in RCTAny increase vs. Decrease184 weeksNoBAYes****83Watanabe2023PBSmolecularPD/SD vs. neg/CR6142 daysNANAYes59Evrard2023PBSKRAS detection554 weeksNoYesYes****46Edland2023PBSVar594 weeksDNANA41Garcia-Ortiz2023PBSVar15SerialDNANA32Shen2023PBSDetection12NRDNANA33Motobayashi2024PBSMAF increase13SerialNADNA31Hu2024Phase II trialD94–7 daysDNANA26Huang2024PBSIncrease31SerialDNANA29Huerta2024PBSReduction > 84,75 %50EvalNAYesYes25Till2024Phase Ib/2 and PBSClearance708 weeksNAYesYes28Hussung2024Single-center explincrease vs decrease/stable2555 daysDYesYes23Kim2025PBSClearance53EvalNAYesYes****51Abbreviations: PBS, prospective biomarker study, RCT, randomised controlled trial, NR, nor reported, NA, not applicable, D, descriptive, PFS, progression-free survival, OS, overall survival. Studies eligible for meta-analysis marked with bold.
Study design and population
3.3.2
A few studies were exploratory [23,83], four studies were phase II trials [26,28,67,85], one study was a single-arm phase I/II [52], whereas the majority of studies were prospective biomarker study [23,25,26,[28], [29], [30], [31], [32], [33],[40], [41], [42],[45], [46], [47],[50], [51], [52],54,55,[58], [59], [60], [61], [62],[64], [65], [66], [67],70,72,74,[76], [77], [78],80,81,83,85,86].
Thirty-two studies included patients receiving first-line systemic treatment [23,25,26,[28], [29], [30], [31], [32], [33],[40], [41], [42],[45], [46], [47],[50], [51], [52],54,55,[58], [59], [60], [61], [62],[64], [65], [66], [67],70,72,74,[76], [77], [78],80,81,83,85,86]. In two studies, patients were treated in the second line [67,85], while treatment lines were various or not reported in six studies [26,33,62,64,65,86].
In all but three studies [59,80,86], ctDNA kinetics were analysed for a subset of the included cohort. The sample size varied from 4 to 71 patients.
Analytical methods and ctDNA markers
3.3.3
The analytical methods used for measuring changes in ctDNA largely mirrored those applied at baseline with PCR-based methods [23,25,28,31,32,40,41,46,50,51,54,59,62,65,66,70,78,83], and targeted sequencing [26,29,30,33,42,47,52,55,58,67,72,76,77,80,81,85,86] being the predominant methods. KRAS mutation was the most frequently targeted ctDNA marker in studies assessing ctDNA kinetics, either alone or in combination with a few other gene mutations [23,25,28,[30], [31], [32], [33],[40], [41], [42],[45], [46], [47],[49], [50], [51],54,55,58,59,62,[64], [65], [66], [67], [68],70,72,76,78,80,81,83,86], followed by multiple gene panels [26,29,52,60,74,85].
Sampling timepoints and thresholds for ctDNA kinetics
3.3.4
In the analysis of ctDNA kinetics during systemic treatment, all studies evaluated a change in ctDNA in a blood sample collected at a time point during the treatment course (the subsequent sample) compared to the ctDNA in the baseline blood sample. The second sample was most frequently collected approximately 4 weeks after treatment start [41,46,47,54,62,83,85,86] but the time interval varied from 4 days [26] to 3 months [50,51] or the time of the first treatment response evaluation [25,30,42,55,80]. Several studies collected serial samples [26,29,31,32,45,65,81], while others analysed samples from various, unspecified time points [33,58,60,66,72,76,78].
In the further analysis of the association between ctDNA kinetics and clinical outcomes, studies dichotomised the populations differently. Nine studies compared patients with an increase versus a decrease/stability in the ctDNA level [23,29,31,40,45,51,83,85,86], four studies based on the change in ctDNA detectability [28,30,70,81], and three studies based on a data-driven cut-off for a decrease in the ctDNA level [25,47,65]. Three studies reported on various cut-offs [32,41,66], and a single study had pre-defined categories for molecular response based on change in ctDNA level [59]. Other presentations comprised a ctDNA slope [72], a mutant allele frequency above 1 % [78], a KRAS quantification cycle ratio [62], dichotomised instability score groups [61], KRAS as a continuous value [80], or descriptive presentations without statistical tests [26,42,52,54,55,58,60,64,67,74,76,77].
Overall survival
3.3.5
Among 17 studies with a statistical assessment of the association between favourable ctDNA kinetics (e.g., clearance or decline) and longer OS, or unfavourable kinetics (e.g., increase, persistence or decline below a chose threshold) and shorter OS, 16 studies [23,25,28,30,40,45,46,50,56,59,65,72,80,81,83,85] found the association significant, while one study did not [51].
Progression-free survival
3.3.6
In 13 studies, ctDNA kinetics were significantly associated with PFS [23,25,28,30,40,45,46,50,65,70,81,85,86]. In two studies analyses had diverging results depending on sampling interval [47] or ctDNA marker and cut-off [80], and one study did not find an association [51]. One study presented an association descriptively with no statistical test [31].
Treatment response
3.3.7
The relationship between ctDNA kinetics and treatment response was evaluated using statistical analysis in 10 studies, of which seven found a significant association between ctDNA changes and response to treatment [45,64,65,78,80,81,85], while three did not [40,46,83]. There was no common effect estimate across studies, preventing comparative analyses. An additional 20 studies presented the relationship descriptively [23,26,29,32,33,41,42,47,52,54,55,58,[60], [61], [62],66,67,74,76,77].
Meta-analyses
3.4
Baseline ctDNA levels above the specified thresholds were significantly associated with shorter OS in a meta-analysis of 22 studies including 1883 patients with advanced PDAC (pooled HR = 2.3, 95 % CI 1.9–2.8) (Fig. 3a). This analysis showed high statistical heterogeneity (I^2^ = 75 %). Similarly, higher/present baseline ctDNA was associated with shorter PFS in 14 studies (n = 1196), with a pooled HR of 2.1 (95 % CI 1.8–2.4) and low heterogeneity (I^2^ = 9 %) (Fig. 3b). For ctDNA kinetics, seven studies contributed data on OS, revealing minimal heterogeneity (I^2^ = 0 %). Unfavourable ctDNA kinetics, characterised by increases, persistence, or insufficient decline below the threshold, were associated with shorter OS (pooled HR = 3.1, 95 % CI 2.3–4.3, n = 269) (Fig. 3c). In the meta-analysis of ctDNA kinetics and PFS, also based on seven studies (n = 244), moderate heterogeneity was observed (I^2^ = 50 %), with unfavourable kinetics related to shorter PFS (pooled HR = 4.3, 95 % CI 2.6–7.2) (Fig. 3d).Fig. 3. Associations between ctDNA and survival outcomes.Forest plots of the association between baseline ctDNA levels and overall survival (a) and progression-free survival (b), between ctDNA kinetics and overall survival (c) and progression-free survival (d) using the random-effects model. Heterogeneity assessed by I^2^ statistics was 75 % (a), 9 % (b), 0 % (c), and 50 % (d). Studies are presented in chronological order by publication date. Baseline ctDNA refers to the level or detection of ctDNA prior to initiation of systemic therapy. ctDNA kinetics refer to changes in ctDNA levels from baseline to a specific time point during treatment. The HRs reflect comparisons based on study-specific thresholds. ctDNA kinetics are denoted as favourable or unfavourable based on these thresholds. Abbreviations: n, number of patients included in the analysis; HR, hazard ratio; CI, confidence interval.Fig. 3
Quality assessment
3.5
Overall, the risk of bias across studies was rated moderate. Among the included studies, 33 were identified as having a high risk of bias in at least one domain. Study participation had the highest number of studies rated as high risk, with 18 studies falling into this category, followed by study confounding with 11 studies. In contrast, study attrition had an overweight of studies rated as low risk, with 47 studies in this category, while the other domains were predominantly rated as moderate. (Fig. 4).Fig. 4. Quality assessment.Summary of risk of bias assessment assessed using the Quality in Prognosis Studies tool across included studies and domains. Each cell represents the risk of bias rating. Green indicates low risk, yellow indicates moderate risk, and red indicates high risk of bias.Fig. 4
Discussion
4
This systematic review and meta-analysis, comprising 5652 patients with non-resectable PDAC across 64 studies, found consistent associations between baseline ctDNA levels and poorer survival outcomes. Additionally, ctDNA clearance or decline during treatment was associated with improved OS and PFS. Despite the inter-study heterogeneity, the direction of the associations was remarkably consistent, supporting the potential of ctDNA as a prognostic biomarker in advanced PDAC.
The prognostic significance of baseline ctDNA aligns with findings from previous meta-analyses [[87], [88], [89], [90]]. However, the prognostic implications of ctDNA kinetics during palliative systemic treatment remain less explored.
Most studies included patients with metastatic disease, and only two studies reported outcomes separately for patients with locally advanced PDAC, limiting interpretation in a subgroup where radiological assessment can be particularly challenging [[7], [8], [9]]. In patients with metastatic PDAC, pre-treatment detection rates varied from 29 % to 100 %. Prior research found lower ctDNA levels in patients without distant metastases or with metastases confined to lungs, lymph nodes, or peritoneum compared to patients with liver metastases [71], underscoring the need to investigate biological variability. Low ctDNA levels may reflect limited shedding both in early-stage disease and in advanced PDAC without liver metastases [57,71,81]. This could be due to the typically desmoplastic nature of the primary tumor and represents a clinical challenge in this disease, placing high demands on the technical management of ctDNA analysis.
Additionally, methodological factors should be considered. Most studies used PCR-based techniques to analyse KRAS mutations, whereas targeted sequencing of broader gene panels, and more recently methylation-specific assays, reflect ongoing developments in ctDNA methods. With the highest detection rates found across different methods and targets, PCR-based tumour-agnostic approaches may be especially suitable for longitudinal monitoring of ctDNA in palliative treatment due to their feasibility, shorter turnaround times, and capacity to detect continuous changes.
KRAS mutations occur in more than 90 % of PDAC ([91]), making it an attractive target as a ctDNA biomarker. However, background noise in hotspot-targeted KRAS assays may compromise specificity. Increasing the threshold for a positive sample can limit false positives and improve reliability, but at the cost of sensitivity. Such a trade-off may contribute to the proportion of patients with ctDNA-negative samples, representing a central barrier to clinical utility. Further investigation of biological and methodological factors is needed, including assay refinement, error suppression techniques, and longitudinal ctDNA measurements.
In the present review, studies with low detection rates demonstrated associations with clinical outcomes, indicating that valuable prognostic information can be derived even in settings with limited detection. Given the wide variation in ctDNA detection rates, further investigation into the prognostic value of the ctDNA levels beyond dichotomised classifications is warranted. In addition, a comparison of ctDNA and CA19-9 at baseline and longitudinally is warranted to assess the value of either biomarker. However, this is challenged by the absence of well-defined thresholds for interpreting CA19-9 fluctuations during treatment.
Across the studies reporting on ctDNA kinetics, definitions of ctDNA response varied, with terms such as “clearance”, “decline,” and “undetectability” applied inconsistently. The timing of the second sample also ranged from a few days to several months after treatment initiation, adding to the methodological variability. In aggressive diseases such as PDAC, rapid clinical deterioration may preclude subsequent sampling, introducing a selection and immortal time bias. Nevertheless, the interstudy consistency of findings is notable. Future prospective studies with pre-defined early or longitudinal sampling and intention-to-treat analyses are warranted to confirm the associations.
Thresholds for ctDNA kinetics varied widely, were mainly data-dependent, and lacked external validation. Despite this variation, forest plots were visually consistent with similar effect sizes. This may indicate that the observed associations are robust despite methodological differences. However, the lack of standardised and validated criteria for ctDNA response remains a central barrier to clinical translation. Recently proposed predefined criteria, such as the ctDNA Response Evaluation Criteria in Solid Tumors (ctDNA-RECIST) [92], could provide a basis for standardization and should be prospectively validated in future studies.
Evidence from this review suggests an association between ctDNA kinetics and radiological response. However, the limited data constrain interpretability. Understanding the relationship between ctDNA kinetics and imaging may reveal insights into metastatic patterns and disease biology. Well-designed prospective studies with synchronised ctDNA and imaging assessments are needed to evaluate concordance and determine the distinct or complementary value of ctDNA.
The included studies were heterogeneous in design, methodology, and sample size. Most were retrospective, exploratory, and based on single-centre data. Most patients received standard first-line systemic treatment, which supports comparability across studies but limits insights into the value of ctDNA in later lines. ctDNA kinetics were often only reported for a subset of patients, reducing statistical power and potentially contributing to variability in the observed results. These selective analyses introduce a risk of immortal time bias, potentially affecting the estimated impact of ctDNA kinetics.
Another limitation is the moderate risk of bias across included studies. Notably, 33 studies had a high risk of bias in at least one domain, mainly concerning study participation and insufficient control of confounding. This could influence ctDNA levels and outcomes, limiting generalisability and introducing uncertainty into effect estimates. Consequently, results should be interpreted with that consideration in mind. In contrast, attrition bias was generally low, possibly reflecting the retrospective design of many studies, including patients with available ctDNA and outcome data.
The prognostic association between baseline ctDNA and survival was consistent with previous findings in other meta-analyses of both resectable and advanced PDAC [87], [88], [89], [90]. However, the meta-analysis of the association between baseline ctDNA and OS had the highest statistical heterogeneity (I^2^ = 75 %), indicating a high degree of variability in results. In addition, a proportion of studies were excluded from the analysis, introducing a risk of selection bias. This warrants cautious interpretation of the estimated effect size. The results are supported by the narrative synthesis with an in-depth description of the clinical and methodological variation, and the relation to survival outcomes across all studies.
In contrast, the meta-analyses of ctDNA kinetics showed low to moderate statistical heterogeneity (I^2^ = 0 % for OS and ctDNA kinetics; I^2^ = 50 % for PFS and ctDNA kinetics), which suggests a consistent association across the varying clinical and methodological characteristics of the included studies.
However, the selection bias inherent in retrospective studies may systematically exclude patients with poor performance status and prognosis, thereby limiting the generalisability to this group. Thus, findings may not be representative of all clinical scenarios [21] but do demonstrate the presence and direction of association among included patients.
As expected in a dataset dominated by retrospective analyses and exploratory approaches, many sources of heterogeneity contributed to a highly diverse overview. Current guidelines advocate for cautious interpretation of pooled estimates, supplemented by descriptive or narrative reporting to ensure clarity and transparency. Here, the objective was to summarise the existing literature, with less strict caution warranted than if the aim is to inform clinical decisions [93]. Thus, we judiciously presented pooled estimates, as they provide valuable insights to guide future research, despite the heterogeneity of the data.
This review highlights the prognostic relevance of baseline ctDNA and ctDNA kinetics in advanced PDAC, supporting its potential as a minimally invasive, early-response biomarker. Several studies demonstrate significant associations with OS, in some cases within two weeks of treatment initiation, indicating that ctDNA may offer earlier insight into treatment benefit than imaging.
While these findings support the clinical validity of ctDNA, prospective studies using standardised criteria and robust methodology are needed to establish clinical utility, specifically, whether ctDNA-guided treatment decisions improve outcomes over current standards [94].
Key areas for future research include underexplored populations such as patients with locally advanced PDAC, assay optimisation, the significance of ctDNA-negative status, and the predictive value of baseline levels for ctDNA response. A crucial next step will be the prospective validation of pre-defined thresholds, such as those proposed in ctDNA-RECIST [92], as well as the identification of optimal sampling time points and clinically relevant cut-offs. This will pave the way for assessing the real-world utility of ctDNA, including the impact on survival and quality of life of early treatment adaptation.
Author contributions
MMS contributed to protocol writing, literature search, screening, data extraction, risk of bias assessment, manuscript drafting, and preparation of tables and figures. LBC supervised protocol writing and literature search, contributed to screening, data extraction, bias assessment, conducted statistical analyses, prepared figures, and reviewed the manuscript. EHV contributed to protocol writing, literature search, screening, figure preparation, and manuscript review. LV contributed to data extraction, bias assessment, and manuscript review. ST provided expertise on data presentation and statistical analyses and reviewed the manuscript. RFA provided expertise on molecular methodology and reviewed the manuscript. TFH, ML, and SCL advised on protocol development and reviewed the manuscript. KLS was responsible for conceptualisation, protocol supervision, overall project oversight and supervision, and manuscript review.
All authors contributed to the conception or interpretation of the work, drafted or revised the manuscript, approved the final version, and agree to be accountable for all aspects of the work.
Ethical approval and consent to participate
This article is a systematic review and meta-analysis based solely on previously published studies. No new data were collected from human participants or animals. Therefore, ethical approval and informed consent were not applicable.
Declaration of generative AI and AI-assisted technologies in the manuscript preparation process
During the preparation of this work the author(s) used ChatGPT (OpenAI) in order to improve the language of the manuscript. After using this tool/service, the author(s) reviewed and edited the content as needed and take(s) full responsibility for the content of the published article.
Funding
This work was supported by grants from the Health Research Foundation of Central Denmark Region (A4796, A3656), The Novo Nordisk Foundation (NNF23OC0085224) and the Danish Cancer Society (R343-A19765). The funders had no role in the design or conduct of the study.
Declaration of competing interest
The authors declare the following financial interests/personal relationships which may be considered as potential competing interests:Mette M. Steiniche reports financial support was provided by The Health Research Foundation of the Central Denmark Region. Karen-Lise Garm Spindler reports financial support was provided by The Health Research Foundation of the Central Denmark Region. Karen-Lise Garm Spindler reports financial support was provided by The 10.13039/501100009708Novo Nordisk Foundation. Karen-Lise Garm Spindler reports financial support was provided by 10.13039/100008363The Danish Cancer Society. If there are other authors, they declare that they have no known competing financial interests or personal relationships that could have appeared to influence the work reported in this paper.
The reference list from the paper itself. Each links out to its DOI / PubMed record.
- 1Siegel R.L.Kratzer T.B.Giaquinto A.N.Sung H.Jemal A.Cancer statistics, 2025 CA Cancer J Clin 7512025 Jan 1610453981767910.3322/caac.21871 PMC 11745215 · doi ↗ · pubmed ↗
- 2Mizrahi J.D.Surana R.Valle J.W.Shroff R.T.Pancreatic cancer Lancet 395102422020 Jun 200820203259333710.1016/S 0140-6736(20)30974-0 · doi ↗ · pubmed ↗
- 3Park W.Chawla A.O'Reilly E.M.Pancreatic cancer JAMA 32692021 Sep 78513454708210.1001/jama.2021.13027 PMC 9363152 · doi ↗ · pubmed ↗
- 4Bicakli D.H.Uslu R.Güney S.C.Coker A.The relationship between nutritional status, performance status, and survival among pancreatic cancer patients Nutr Cancer 7222020 Feb 172022083127130210.1080/01635581.2019.1634217 · doi ↗ · pubmed ↗
- 5Taieb J.Prager G.W.Melisi D.Westphalen C.B.D'Esquermes N.Ferreras A.First-line and second-line treatment of patients with metastatic pancreatic adenocarcinoma in routine clinical practice across Europe: a retrospective, observational chart review study ESMO Open 512020 e 00058710.1136/esmoopen-2019-000587 PMC 700339631958291 · doi ↗ · pubmed ↗
- 6Kleeff J.Korc M.Apte M.La Vecchia C.Johnson C.D.Biankin A.V.Pancreatic cancer Nat Rev Dis Primers 212016 Apr 211602210.1038/nrdp.2016.2227158978 · doi ↗ · pubmed ↗
- 7Elbanna K.Y.Jang H.J.Kim T.K.Imaging diagnosis and staging of pancreatic ductal adenocarcinoma: a comprehensive review Insights Imaging 1112020 Apr 25583233579010.1186/s 13244-020-00861-y PMC 7183518 · doi ↗ · pubmed ↗
- 8Conroy T.Pfeiffer P.Vilgrain V.Lamarca A.Seufferlein T.O'Reilly E.M.Pancreatic cancer: ESMO clinical practice guideline for diagnosis, treatment and follow-up Ann Oncol 34112023 Nov 98710023767867110.1016/j.annonc.2023.08.009 · doi ↗ · pubmed ↗