Identification and analysis of the connection network structure between the components of the immune system in children
D.S. Grebennikov, A.P. Toptygina, G.A. Bocharov

TL;DR
This study explores the network connections between immune system components in young children using a statistical method to handle small sample sizes.
Contribution
The paper introduces the use of the DSPC algorithm to analyze immune system networks in children with limited data.
Findings
The choice of statistical significance threshold strongly affects the network structure with small sample sizes.
Graph visualization and topological analysis revealed key relationships between immune cells, cytokines, and antibodies.
Larger sample sizes and mechanistic models are needed to confirm the network's immunological accuracy.
Abstract
Identification of the connections between the various functional components of the immune system is a crucial task in modern immunology. It is key to implementing the systems biology approach to understand the mechanisms of dynamic changes and outcomes of infectious and oncological diseases. The data characterizing an individual’s immune status typically have a high-dimensional state space and a small sample size. To study the network topology of the immune system, we utilized previously published original data from Toptygina et al. (2023), which included measurements of the immune status in 19 healthy individuals (children, 9 boys and 10 girls, aged 1 to 2 years), i. e., the immune cells (42 subpopulations) obtained by flow cytometry; cytokine levels (13 types) obtained by multiplex analysis; and antibody levels (4 types) determined by using enzyme immunoassay. To correctly identify…
Genes, proteins, chemicals, diseases, species, mutations and cell lines named across the full text — each resolved to its canonical identifier and authoritative record.
Click any figure to enlarge with its caption.
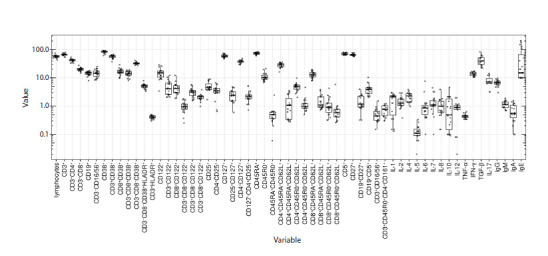 Fig. 1
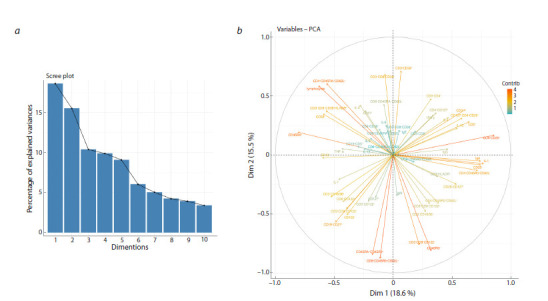 Fig. 2
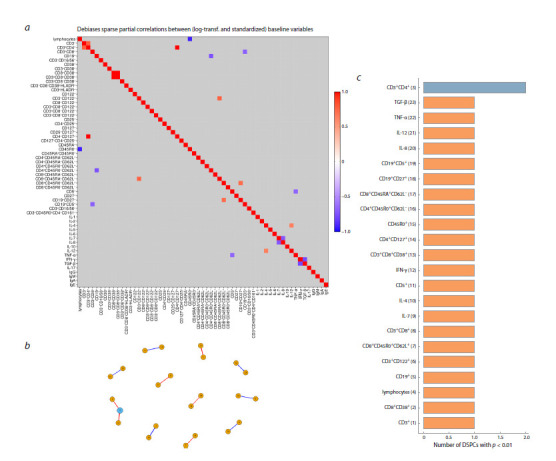 Fig. 3
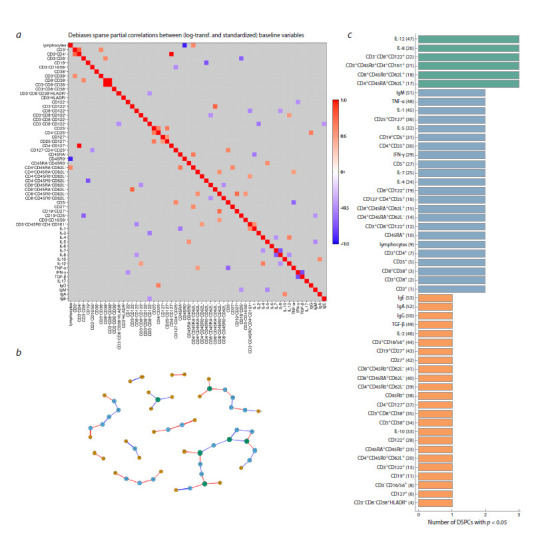 Fig. 4
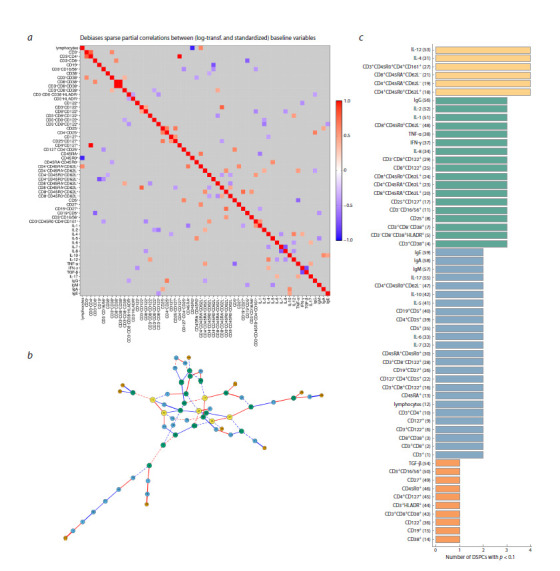 Fig. 5
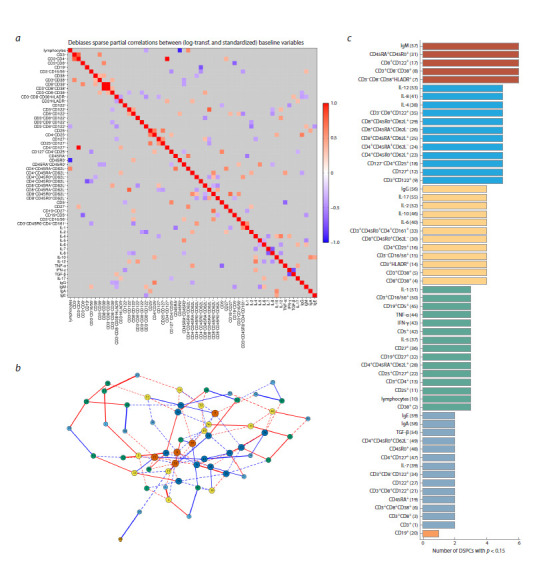 Fig. 6
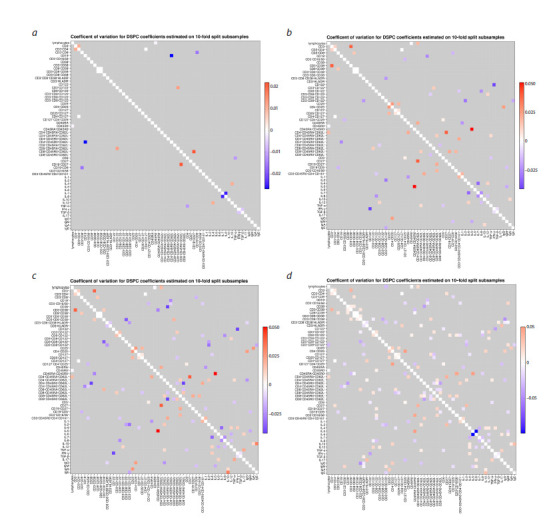 Fig. 7
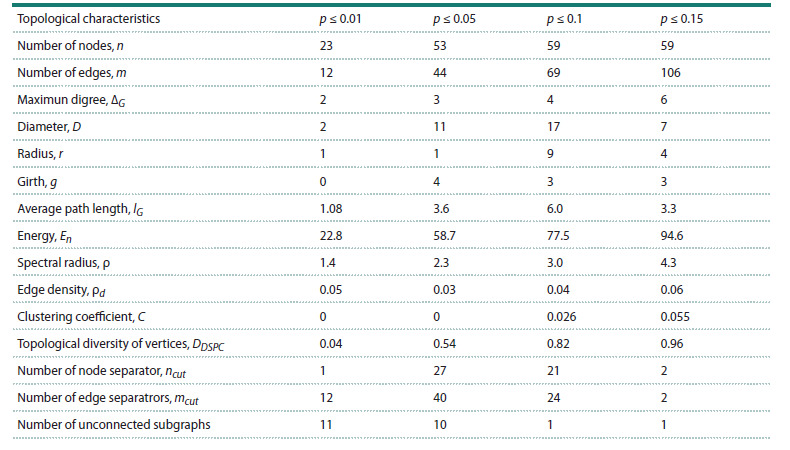 Table 1
Peer Reviews
No public reviews on file for this paper yet. If you reviewed it on a platform where reviews are public (OpenReview, ICLR, NeurIPS, ICML), you can paste yours below so the community can read it here.
Videos
No videos yet. Explain this paper in a talk, walkthrough, or lecture? Add one.
Taxonomy
Topicsvaccines and immunoinformatics approaches · Artificial Immune Systems Applications · Advanced Biosensing Techniques and Applications
Introduction
The human immune system functions to maintain the antigenic homeostasis of the body’s internal environment. It is a system with distributed parameters reflecting the spatial organization, phenotypic and clonal structure of its constituent cell populations. The cells of the immune system continuously interact with each other, and the balance of processes increasing or decreasing their activity underlies the development of productive or abortive reactions (Ng et al., 2013). Implementation of a systems biology approach to the investigation of the mechanisms determining the dynamics and outcome of infectious and oncological diseases requires identification of the structure of cellular interconnection networks in the immune system. An example of studying the connections network (network topology) between populations of cellular components of the immune system is provided in (Rieckmann et al., 2017), where the quantitative proteomics data were used for identification of the social architecture of immune cell interactions. The description of the network topology is associated with construction of a graph, with the vertices corresponding to specific cell populations of the immune system, and the edges representing connections of a diverse nature between the corresponding vertices.
To date, a large number (about 100 documented) of methods have been developed for analyzing the structural organization of intercellular interactions based on data of a diverse nature, including spatial and cellular transcriptomics, expression of ligand receptors, as well as intracellular signalling components (Armingol et al., 2024). They are used for the assessment of the connectivity indices or communication structures between cells, which provide the basis for building the graphs of connectivity networks. Both the biophysical and biochemical principles, and statistical data analysis methods in combination with machine learning, can be used to assess the strength of the intercellular connections.
The construction of a quantitative interactome of immune cells based on receptor proteins expressed on their surface is presented in (Shilts et al., 2022). It implements a number of graphs based on a set of physical connections between cells of the immune system in major human organs identified using multiplex immune and transcriptomic analysis technologies, genetic databases and biochemical methods for screening interactions between cells. Visualization of the transcriptome analysis data as a graph reflecting the genes co-expression is an integrative part of modern systemic vaccinology studies (Cortese et al., 2025).
The aim of our study was to implement a new approach to identifying the network structure of relationships in the immune system of a healthy individual based on the results of a correlation analysis of previously published data on the immune status of children aged one to two years. The data set includes the measurements of the immune status parameters, i. e. the subpopulations of immune cells, cytokine concentrations and antibody levels (Toptygina et al., 2023). The research objectives include the correlation analysis of children’s immune status data to build heatmaps of partial correlations, visualization of the partial correlations networks as graphs, and analysis of the topological characteristics of the graph models.
The present work consists of four sections. The “Materials and methods” section describes the specific features of the source data, methods of correlation analysis, the correlationbased approach to identifying a network structure of relationships between the immune status parameters, and examines the topological properties of the corresponding graphs. Principal components analysis is performed. The “Results” section presents the results of network construction for various threshold levels of statistical significance of the correlations, an immunological interpretation of the corresponding network topologies, and a robustness analysis. The results of the work are discussed in the “Discussion” section.
Materials and methods
Immune status data. To study the network topology of the immune system, we used previously published original data (Toptygina et al., 2023). The data are a set of measurements of immune status indicators in 19 healthy individuals, i. e., children aged one to two years: populations of immune cells (42 subpopulations) obtained by flow cytometry; cytokine levels (13 types) obtained by multiplex analysis; antibody levels (4 types) determined by enzyme immunoassay. The data samples are summarized in Figure 1 as individual measurements, median values, and 25 and 75 % quartiles. The distribution of the indicators does not follow either the normal or the log-normal behavior.
Data on immune status in healthy individuals – children aged one to two years (adapted from Toptygina et al., 2023).Individual measurements, median sample values, and 25–75 % quartiles are presented. The abscissa shows the names of the immune status indicators. The ordinate shows the percentage of cells (%), the levels of cytokines (pg/ml) and immunoglobulins A, M, G (g/l), IgE (IU/ml).
The data on the immune status of children are characterized by a large dimensionality of the state space (59) and a small sample size (19 patients), which is typical for systems biology studies (Basu et al., 2017). If the sample size is large enough, one can use the approach based on partial correlations in order to determine the relationships between the immune status parameters. Otherwise, an approach that takes into account the small size of the data set has to be implemented to correctly determine statistically significantly correlations between the measured variables and construct a network topology graph. It should be noted that all the children belonged to the same age group from one to two years old, which in medical practice is not customary to subdivide further. Due to the small size of the group (19 people), additional division by gender (10 girls and 9 boys) would have reduced the statistical power below the critical level required for the method used in our study.
Principal component analyses. The principal component analysis (PCA) was performed using the prcomp function in the R language, the factoextra R package (version 1.0.7) was used for visualization. To perform the PCA, the data were standardized, and the variables TGF-β, IL-17, and CD3⁺CD45R0⁺CD4⁺CD161⁺ were excluded from the analysis due to missing data. The analysis of the principal components (PCs) did not reveal the possibility of explaining the variance of the data by a small number of the components (Fig. 2a), and no correlation-based clusters of immune status variables exist in the first two PCs (Fig. 2b).
Principal component analysis: a – fraction of explained variance; b – composition of the first two principal components.
**Methods of partial correlation analyses and reconstruction of the connection network. ** An alternative to the standard method of estimating partial correlations is an approach using regularization methods to estimate the matrix of partial correlations (Epskamp, Fried, 2018). The principle of regularization is based on the assumption that the number of connections in the constructed model network is significantly less than the number of observed variables, i. e. the real network is sparse. Accordingly, the LASSO method (Epskamp, Fried, 2018) is used as a regularizing correction that allows zeroing out insignificant correlations between variables (the number of edges in the graph). To analyze our data, we used this approach for the estimation of debiased sparse partial correlations matrix implemented in algorithm DSPC (Basu et al., 2017), which provides additional correction of estimates of the elements of the inverse covariance matrix, i. e. the elements of the partial correlations matrix. The estimates of the correlation matrix elements were represented as heatmaps and visualized as weighted networks, where the vertices (nodes) represent the immune status variables and the edges show correlations between them. The results of estimating the correlation-based relationships depend significantly on the algorithm parameters: 1) the value of the parameter λ for the regularization term in the form of ℓ1 norm of the inverse covariance matrix; 2) the choice of the statistical significance level p for the predicted correlation relationship. Below, we study the effect of the p-value on the network topology of connections in the immune system.
To calculate the sparse partial correlations using the DSPC method, we used the Java application CorrelationCalculator (version 1.0.1) developed in (Basu et al., 2017). The original data were normalized, i. e. logarithmically transformed and standardized. A graphical representation of statistically significant correlations (for p < 0.01; 0.05; 0.1; 0.15) in the form of heatmaps and graphs of correlation networks was performed using the R packages igraph (version 1.6.0) and ggplot2 (version 3.5.2). The topological characteristics of the correlation networks graphs were calculated using the igraph package in R (version 1.6.0).
Results
In what follows, we study the effect of the p-value on the network topology of connections in the immune system. The conventionally considered statistical significance levels 0.01, 0.05, 0.1, 0.15 are analyzed.
Heatmap and connection graph for p = 0.01
The heatmap of partial correlations between immune status parameters for healthy children at a statistical significance threshold p = 0.01 is presented in Figure 3a. The corresponding graph of the network is shown in Figure 3b. This graph has 23 nodes and 12 edges (connections). In fact, connectivity in the network is missing. Figure 3c shows the distribution of immune response indicators with respect to the number of identified links between them. The node with the maximum number (2 in total) of correlations represents the CD4 T cell population (CD3⁺CD4⁺).
Heatmap and network graph of immunological parameters in healthy children at a statistical significance level of p = 0.01: a – heatmap of correlations between immune status indicators; b – graph of connections network at p = 0.01; c – characteristics of the complexity of the network of connections.Here and in Figures 4–6: the node numbers correspond to the immune status parameters shown in c. The ordinate names the immune status indicators. The abscissa shows the degrees of the graph nodes. Positive correlations (red lines), negative correlations (blue lines), the thickness of the edges is proportional to the absolute values of the DSPC coefficients. The color of the nodes corresponds to the node index, i. e. the number of significant correlations.
Heatmap and connection graph for p = 0.05
The heatmap of correlations between immune status parameters for healthy children at a statistical significance threshold p = 0.05 is presented in Figure 4a. The corresponding network graph is shown in Figure 4b. This graph has 53 nodes and 44 edges (connections). The cohesion of individual network components is strengthened, but overall, it is absent. Figure 4c shows the distribution of immune response indicators with respect to the number of identified links between them. The nodes with the maximum number of correlations (called hubs) represent the proinflammatory cytokines IL-8, IL-12, and central memory T cells (CD4⁺CD45RA⁺CD62L⁺, CD8⁺CD45R0⁺CD62L⁺), Th17 (CD3⁺CD45R0⁺CD4⁺CD161⁺) and activated NK cells (CD3⁻CD8⁺CD122⁺). The maximum number of connections increases to three.
Heatmap and network graph of immunological parameters in healthy children at a statistical significance level of p = 0.05:a – heatmap of correlations between immune status indicators; b – graph of connections network at p = 0.05; c – characteristics of the complexity of the network of connections
Heatmap and connection graph for p = 0.1
The heatmap of correlations between immune status parameters for healthy children at a statistical significance threshold p = 0.1 is presented in Figure 5a. The corresponding network graph is shown in Figure 5b. This graph has 59 nodes and 69 edges (connections). Figure 5c shows the distribution of immune response indicators with respect to the number of identified links between them. The nodes with the maximum number of correlations (four in this case) represent the cytokines IL-4, IL-12 inducing the cellular and humoral immunity, the terminally differentiated effector memory T cells (CD4⁺CD45RA⁺CD62L⁻, CD8⁺CD45RA⁺CD62L⁻), and Th17 cells (CD3⁺CD45R0⁺CD4⁺CD161⁺).
Heatmap and network graph of immunological parameters in healthy children at a statistical significance level of p = 0.1:a – heatmap of correlations between immune status indicators; b – graph of connections network at p = 0.1; c – characteristics of the complexity of the network of connections. Solid lines of the edges correspond to correlations with a significance level of p < 0.05, dashed lines, to p < 0.1.
Heatmap and connection graph for p = 0.15
The heatmap of correlations between immune status parameters for healthy children at a statistical significance threshold p = 0.15 is presented in Figure 6a. The corresponding network graph is shown in Figure 6b. This graph has 59 nodes and 106 edges (connections). Figure 6c shows the distribution of immune response indicators with respect to the number of identified links between them. The nodes with the maximum number of correlations (hubs) represent the immunoglobulins IgM, plasma cells (CD3⁻CD8⁻CD38⁺HLADR⁺), activated T cells (CD3⁺CD8⁻CD38⁺, CD8⁺CD122⁺), and the doublepositive activated cells (CD45RA⁺CD45R0⁺) reflecting the transition from naive to memory cells. The maximum number of connections increases to six.
Heatmap and network graph of immunological parameters in healthy children at a statistical significance level of p = 0.15:a – heatmap of correlations between immune status indicators; b – graph of connections network at p = 0.15; c – characteristics of the complexity of the network of connections. Solid lines of the edges correspond to correlations with a significance level of p < 0.05, dashed lines, to p <0.15.
Analysis of the robustness of correlation estimates
To assess the stability of the obtained DSPC correlation coefficients in relation to the sample size, a procedure was performed for generating ten different subsamples according to the vfold10 scheme. In most cases, it corresponds to the selection of 17 out of 19 measurements. The coefficient of variation (the ratio of the standard deviation to the mean value) of the DSPC coefficients estimated from the generated subsamples was chosen as a measure of stability (robustness). The estimated coefficients of variation are shown in Figure 7 for four levels of statistical significance in the form of heatmaps. Importantly, their absolute values do not exceed 0.1.
Matrices of estimates of the variation coefficients for four significance levels: p < 0.01 (a); p <0.05 (b); p < 0.1 (c); p < 0.15 (d).
Comparative analysis of topological properties of graphs of correlations between indicators of immune status
The Table shows the results of calculating the topological characteristics of the constructed graphs of correlation networks between immune status indicators for various thresholds of statistical significance. The following basic characteristics were considered: graph diameter, graph radius, girth of graph (the length of the smallest cycle contained in the graph), average path length, graph energy, spectral radius, edge density, clustering coefficient, average graph diversity (determined through entropy calculated by the weights of incident edges – the absolute values of the correlation coefficients DSPC), the number of separators, and the number of unconnected subgraphs.
Comparative analysis of topological properties of graphs of correlations between indicators of immune status for various significance thresholds
The number of nodes, edges, and maximum node degrees grows with increasing statistical significance threshold. However, the graph diameter, radius, girth and average path length exhibit a non-monotonic dependence, initially increasing and then decreasing, which indicates a transformation of properties towards the “small world network” family. The graph energy and spectral radius increase monotonically with increasing threshold p. The clustering coefficient also increases, indicating that the graph nodes tend to cluster together. Interestingly, the number of cutting nodes and edges decreases at p = 0.15, which may indicate an increase in the robustness of the connections graph. As expected, the number of disconnected subgraphs decreases
Discussion
Identification of the connection structures between the various functional components of the immune system is an extremely urgent task of modern immunology. This is due to an extremely high number of measured characteristics, with a relatively small sample size, reflecting the situation in big data biomathematics, called the “curse of dimensionality”. To analyze the relationships between immune status parameters, we implemented and analyzed an approach based on a regularized method for estimating sparse partial correlations implemented in the DSPC algorithm (Basu et al., 2017), which minimizes the number of false correlations. It is noted that the results of applying the algorithm may depend on the sample size, imputation of missing data, the nature of the true network structure and other aspects. Our work demonstrates that, given a limited sample size of measurements, an a priori assignment of the level of statistical significance is of fundamental importance for the formation of a matrix of partial correlations. Increasing the statistical significance threshold increases the complexity of the network topology generated by the DSPCbased approach. Final verification of the immunologically correct structure of connections requires both an increase in the sample size and conjugation with a priori mechanistic views and models of the functioning of the immune system components, i. e. the participation of clinical immunologists (Qiao et al., 2025). An important step in this direction was the development of the ImmunoGlobe tool for constructing and analyzing the network of interactions in the immune system (Atallah et al., 2020) using phenomenological information from the fundamental textbook “Janeway’s Immunobiology” (Murphy, Weaver, 2017).
The aim of this work is to implement and introduce a new method for identifying relationships between cellular and humoral components of the immune systems. Identification of the network relationships between elements of immune status is central to the systems immunology approach, but the relevant analytical tools remain undeveloped. All currently existing verified concepts of immune networks are limited to schemes with no more than three or four components (antigen presentation, differentiation pathways, paracrine and autocrine interactions). For this reason, it is not possible to uniquely select and verify one of the presented networks. If we adhere to the generally accepted level of significance (p = 0.05), then we should give preference to the network constructed in the section “Heatmap and graph of connections for p = 0.05”. Identifying the network structure of relationships between components of cellular and humoral immunity is a necessary element for the transition from a static description of immune status to a systems dynamics consideration of the maintenance of immune homeostasis
Conclusion
The development of combination therapies for chronic diseases associated with induction of several components of the immune system requires understanding of the topology and strength of the structural connections in the system. Our study demonstrates for the first time that DSPC-based methods can be used to obtain consistent estimates of significant partial correlations for similar problems in a typical situation with a large number of measured immune status parameters and a small number of patients. Translation of the results into biomedical practice to address the challenges of personalized treatment and prevention of immune-dependent pathological processes requires an active participation of clinicians in order to determine therapy targets and quantitatively predict its effectiveness
Conflict of interest
The authors declare no conflict of interest.
References
Armingol E., Baghdassarian H.M., Lewis N.E. The diversification of methods for studying cell-cell interactions and communication. Nat Rev Genet. 2024;25(6):381-400. doi 10.1038/s41576-023-00685-8
Atallah M.B., Tandon V., Hiam K.J., Boyce H., Hori M., Atallah W., Spitzer M.H., Engleman E., Mallick P. ImmunoGlobe: enabling systems immunology with a manually curated intercellular immune interaction network. BMC Bioinformatics. 2020;21(1):346. doi 10.1186/s12859-020-03702-3
Basu S., Duren W., Evans C.R., Burant C.F., Michailidis G., Karnovsky A. Sparse network modeling and metscape-based visualization methods for the analysis of large-scale metabolomics data. Bioinformatics. 2017;33(10):1545-1553. doi 10.1093/bioinformatics/btx012
Cortese M., Hagan T., Rouphael N., Wu S.Y., Xie X., Kazmin D., Wimmers F., … Subramaniam S., Mulligan M.J., Khurana S., Golding H., Pulendran B. System vaccinology analysis of predictors and mechanisms of antibody response durability to multiple vaccines in humans. Nat Immunol. 2025;26(1):116-130. doi 10.1038/s41590- 024-02036-z
Epskamp S., Fried E.I. A tutorial on regularized partial correlation networks. Psychol Methods. 2018;23(4):617-634. doi 10.1037/ met0000167
Murphy K., Weaver C. Janeway’s Immunobiology. New York, NY: Garland Science/Taylor & Francis Group, 2017. ISBN 978-0-8153- 4505-3 Available: https://inmunologos.wordpress.com/wp-content/ uploads/2020/08/janeways-immunobiology-9th-ed_booksmedicos. org_.pdf
Ng C.T., Snell L.M., Brooks D.G., Oldstone M.B. Networking at the level of host immunity: immune cell interactions during persistent viral infections. Cell Host Microbe. 2013;13(6):652-664. doi 10.1016/j.chom.2013.05.014
Qiao L., Khalilimeybodi A., Linden-Santangeli N.J., Rangamani P. The evolution of systems biology and systems medicine: From mechanistic models to uncertainty quantification. Annu Rev Biomed Eng. 2025;27(1):425-447. doi 10.1146/annurev-bioeng-102723- 065309
Rieckmann J.C., Geiger R., Hornburg D., Wolf T., Kveler K., Jarrossay D., Sallusto F., Shen-Orr S.S., Lanzavecchia A., Mann M., Meissner F. Social network architecture of human immune cells unveiled by quantitative proteomics. Nat Immunol. 2017;18(5):583- 593. doi 10.1038/ni.3693
Shilts J., Severin Y., Galaway F., Müller-Sienerth N., Chong Z.S., Pritchard S., Teichmann S., Vento-Tormo R., Snijder B., Wright G.J. A physical wiring diagram for the human immune system. Nature. 2022;608(7922):397-404. doi 10.1038/s41586-022-05028-x. Erratum in: Nature. 2024;635(8037):E1. doi 10.1038/s41586-024- 07928-6
Toptygina A., Grebennikov D., Bocharov G. Prediction of specific antibody- and cell-mediated responses using baseline immune status parameters of individuals received measles-mumps-rubella vaccine. Viruses. 2023;15(2):524. doi 10.3390/v15020524