Surveillance of laboratory exposures to human pathogens and toxins, Canada, 2024
Emily F Tran, Audrey Gauthier, Antoinette N Davis, Christine Abalos, Samuel Bonti-Ankomah

TL;DR
This paper analyzes 2024 data on lab exposures to pathogens in Canada, identifying trends and contributing factors.
Contribution
The study provides updated surveillance data and qualitative insights into exposure incidents in Canadian labs.
Findings
In 2024, 71 confirmed exposure incidents affected 132 individuals, with bacteria being the most common pathogen.
Human factors were the leading root cause, and public health labs had the highest incident rate.
Qualitative analysis highlighted unsafe practices like working outside safety cabinets as common issues.
Abstract
Exposure incidents to human pathogens and toxins (HPTs) in licensed facilities in Canada are monitored by Laboratory Incident Notification Canada (LINC), a surveillance system that describes and identifies trends among exposure incidents in Canada using quantitative and qualitative data. Confirmed exposure incidents reported to LINC in 2024 were analyzed. The exposure incident rate was calculated and compared to previous years. A seasonality analysis compared monthly trends. Exposure incidents were described by sector, implicated HPTs, main activity, occurrence types, root causes, affected individuals and reporting delay. Text-based descriptions of exposure incidents underwent qualitative analysis. In 2024, there were 71 confirmed exposure incidents affecting 132 individuals. There were 67.5 incidents per 1,000 active licences. Bacteria was the most commonly implicated HPT (64%).…
Genes, proteins, chemicals, diseases, species, mutations and cell lines named across the full text — each resolved to its canonical identifier and authoritative record.
Click any figure to enlarge with its caption.
 Figure 1
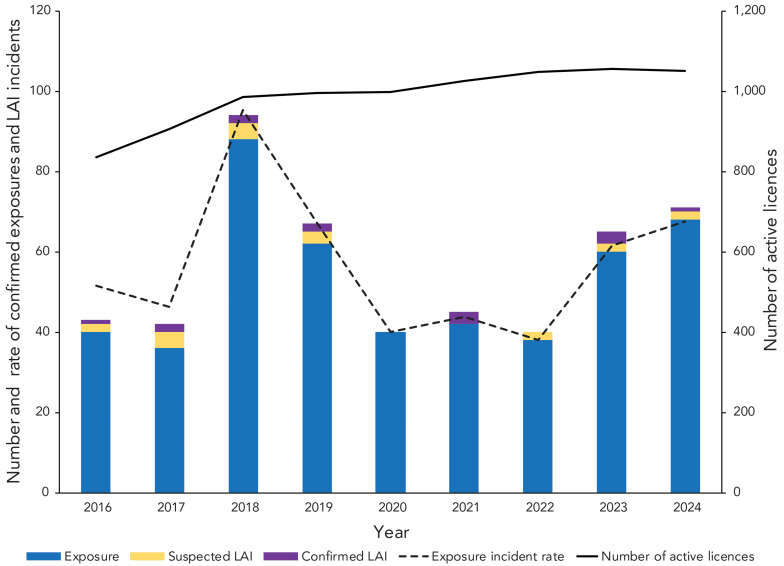 Figure 2
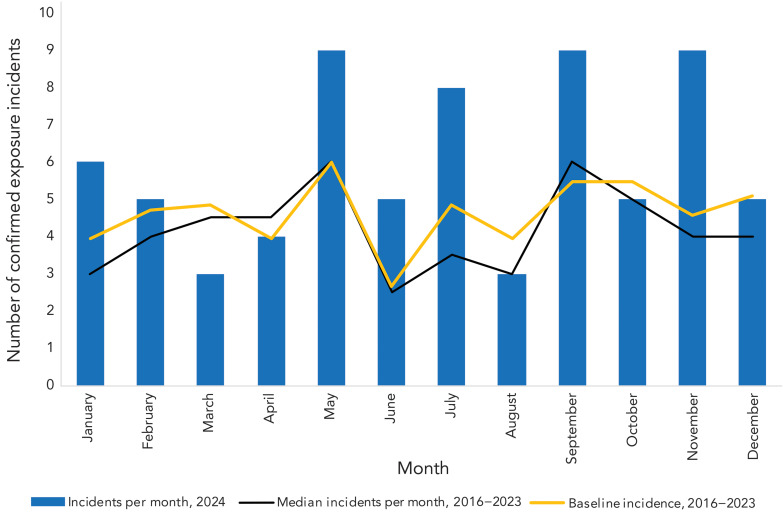 Figure 3
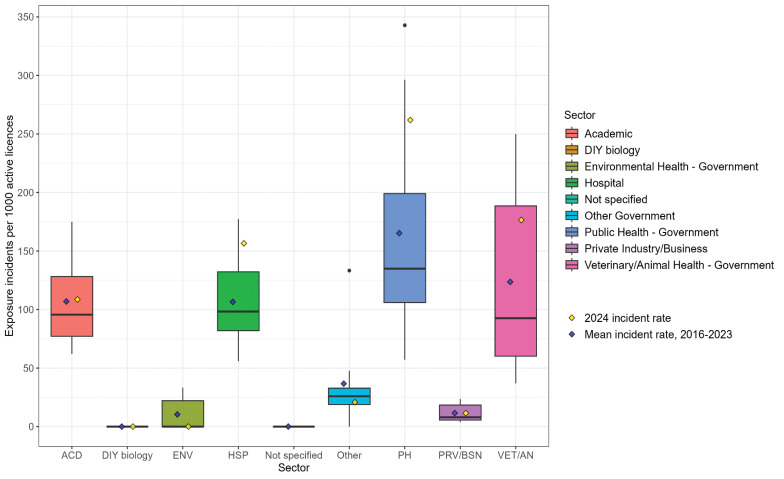 Figure 4
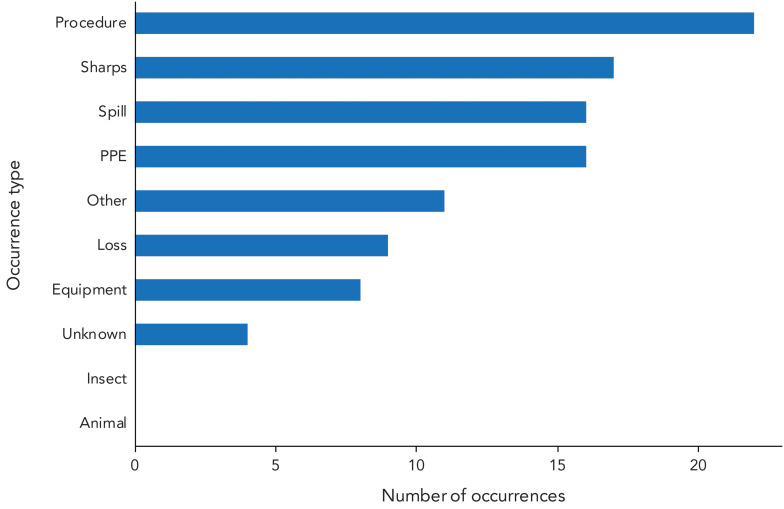 Figure 5
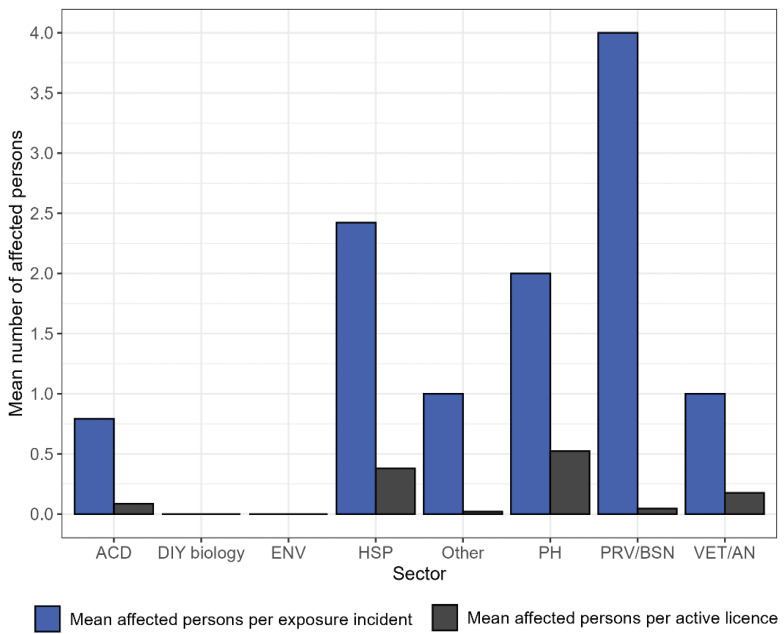 Figure 6
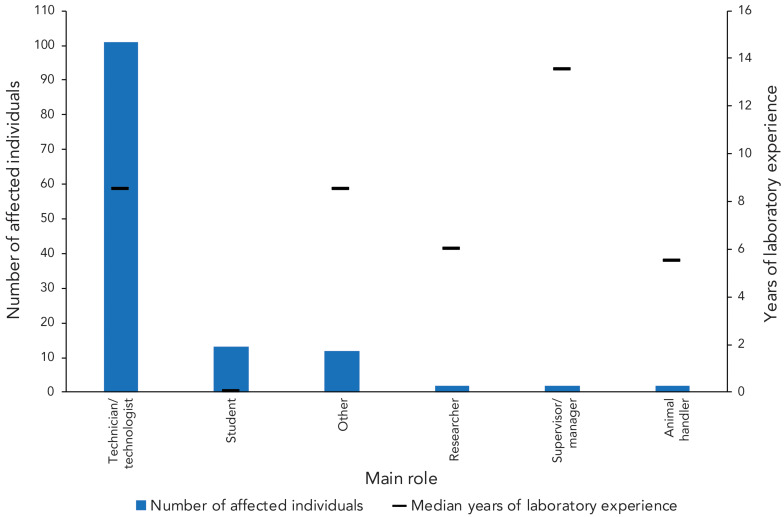 Figure 7
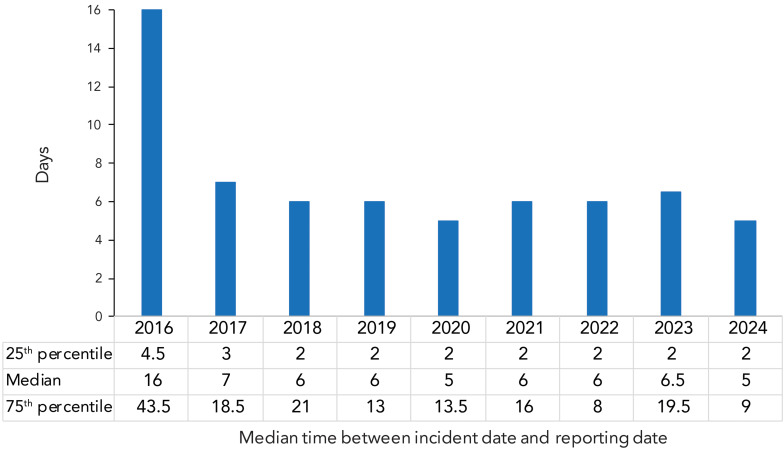 Figure 8
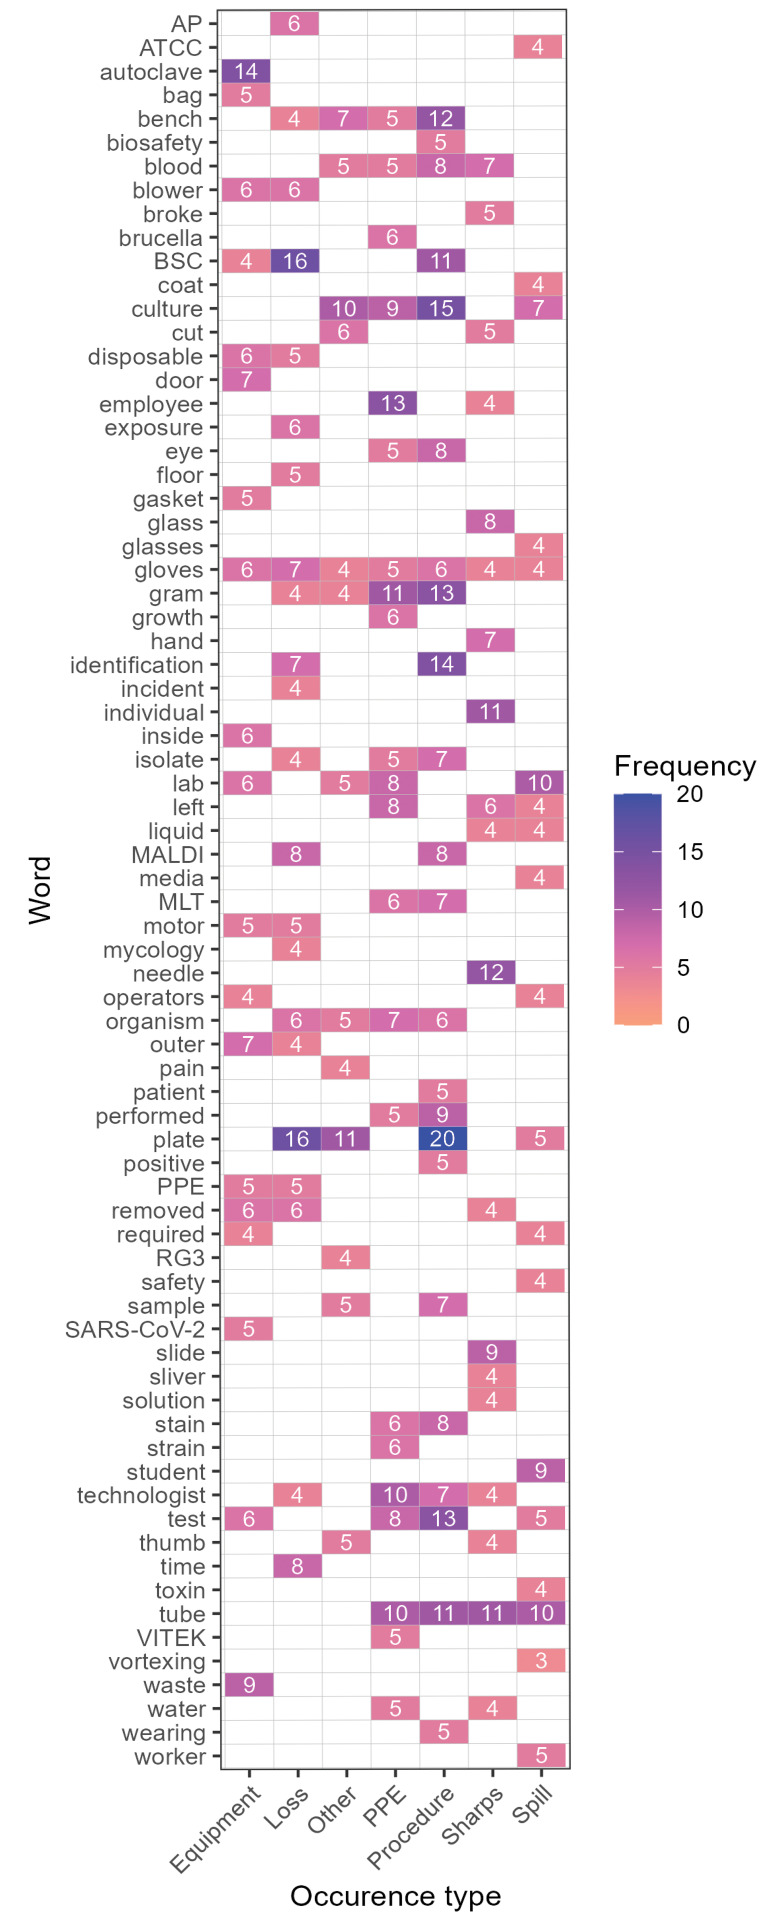 Figure 9
| Biological agent type by risk group | Non-SSBA | SSBA | Total | |||
|---|---|---|---|---|---|---|
| n | % | n | % | n | % | |
|
|
|
|
|
|
|
|
| Bacteria | 34 | 45.3 | 0 | 0 | 34 | 45.3 |
| Fungus | 3 | 4.0 | 0 | 0 | 3 | 4.0 |
| Parasite | 0 | 0 | 0 | 0 | 0 | 0 |
| Prion | 2 | 2.7 | 0 | 0 | 2 | 2.7 |
| Toxin | 3 | 4.0 | 0 | 0 | 3 | 4.0 |
| Virus | 6 | 8.0 | 0 | 0 | 6 | 8.0 |
| Cell line | 0 | 0.0 | 0 | 0 | 0 | 0 |
|
|
|
|
|
|
|
|
| Bacteria | 1 | 1.3 | 13 | 17.3 | 14 | 18.7 |
| Fungus | 3 | 4.0 | 2 | 2.7 | 5 | 6.7 |
| Parasite | 0 | 0 | 0 | 0 | 0 | 0 |
| Prion | 1 | 1.3 | 0 | 0 | 1 | 1.3 |
| Toxin | 0 | 0 | 0 | 0 | 0 | 0 |
| Virus | 4 | 5.3 | 3 | 4.0 | 7 | 9.3 |
| Cell line | 0 | 0 | 0 | 0 | 0 | 0 |
| Total | 57 | 76.0 | 18 | 24.0 | 75 | 100 |
| Root cause | Examples of areas of concern | Citations | |
|---|---|---|---|
| n | %a | ||
| Human factors | A violation (cutting a corner, not following correct procedure, deviating from SOP) | 44 | 62.0 |
| An error (a mistake, lapse of concentration, or slip of any kind) | |||
| SOP | Documents were followed as written but not correct for activity/task | 27 | 38.0 |
| Procedures that should have been in place were not in place | |||
| Documents were not followed correctly | |||
| Training | Training was not in place but should have been in place | 23 | 32.4 |
| Training was not appropriate for the task/activity | |||
| Staff were not qualified or proficient in performing task | |||
| Management and oversight | Supervision needed improvement | 20 | 28.2 |
| Lack of auditing of standards, policies and procedures | |||
| Risk assessment needed improvement | |||
| Equipment | Equipment quality control needed improvement | 24 | 33.8 |
| Equipment failed | |||
| Equipment was not appropriate for purpose | |||
| Communication | Communication did not occur but should have | 18 | 25.4 |
| Communication was unclear, ambiguous, etc. | |||
| Other | Root causes not captured elsewhere | 11 | 15.5 |
| Unpredictable/random movement by research animal | |||
Peer Reviews
No public reviews on file for this paper yet. If you reviewed it on a platform where reviews are public (OpenReview, ICLR, NeurIPS, ICML), you can paste yours below so the community can read it here.
Videos
No videos yet. Explain this paper in a talk, walkthrough, or lecture? Add one.
Taxonomy
TopicsBacillus and Francisella bacterial research · Infection Control and Ventilation · Infection Control in Healthcare
Introduction
Research involving human pathogens and toxins (HPTs), such as bacteria, viruses and fungi, can provide valuable insight into developing protective measures against harmful biological agents. However, work involving HPTs carries numerous risks, including potential exposure incidents that may lead to laboratory-acquired infections (LAIs) or intoxications ((1,2)). In rare cases, these incidents can extend beyond the facility and affect public health ((2,3)).
In Canada, more than 1,000 licensed facilities conduct activities involving HPTs. These facilities are regulated by the Public Health Agency of Canada (PHAC) under the Human Pathogens and Toxins Act (HPTA) ((4)) and its associated Human Pathogens and Toxins Regulations (HPTR) ((5)), which mandate the reporting of exposure incidents involving Risk Group (RG) 2 or higher pathogens. The RG classification is assigned based on inherent characteristics and describes the risk of a pathogen at the individual-level and population-level. To monitor exposures to RG2, RG3 and RG4 HPTs in licensed facilities throughout Canada and support licensed facilities with mitigation of recurrence, a federal surveillance system, Laboratory Incident Notification Canada (LINC), was launched by PHAC in December 2015.
Since its inception, LINC has published annual reports summarizing exposure incidents in Canada and provided data on a number of variables associated with these exposure incidents ((6–13)). These reports have often found that confirmed exposures occurred particularly during microbiology or in vivo animal research activities ((9–13)). Common occurrence types involved issues with procedures, sharps and personal protective equipment (PPE) ((6–13)). Frequent root causes are issues with standard operating procedures (SOPs) and human factors-related issues ((6–13)). Most affected individuals worked as laboratory technicians or technologists ((8–13)). The most commonly implicated biological agents are RG2 bacteria and viruses ((6–11,13)).
Canada remains one of the few countries with a dedicated surveillance system focused on exposures to biological agents. Some countries (Australia, the United States and Singapore) have their own surveillance programs that focus on specific risk groups or elements of biosafety ((14–17)). In Australia, Security Sensitive Biological Agents (SSBAs), a subset of pathogens posing higher biosecurity risks due to their potential to be used for biological weapons, are monitored ((14,18)). In the United States, the possession, use and transfer of biological select agents and toxins are monitored under the Federal Select Agent Program (FSAP) ((15)). In Singapore, infections, illnesses, adverse events and incidents involving certain agents or toxins must be reported to the Ministry of Health ((16,17)). Comparative analyses between LINC’s incident reports and those from other countries remain limited due to differences in data collection and availability, particularly regarding exposure incident characteristics. However, LAIs reported in the literature from other countries align with LINC’s data. Globally, procedural errors and sharps-related incidents are common sources of LAIs ((1,2,19–22)), with most incidents occurring during microbiology activities ((1,2,20)) and laboratory technicians as the most frequently affected personnel in these incidents ((1,20)).
With the overall goal of enhancing biosafety awareness and improving laboratory practices in Canada, LINC’s annual reports have provided insights to help minimize exposure incidents. The objective of this report is to analyze exposure incidents reported to LINC in 2024. These findings will further enhance the understanding of factors contributing to exposure incidents and inform targeted areas for biosafety training and best practices.
Methods
Data source and collection
Under the HPTA and HPTR, in the event of an HPT-related incident, all licensed Canadian facilities must report specific details to PHAC without delay. The Agency’s web-based Biosecurity Portal, which uses Microsoft Dynamics’ Customer Relationship Management (CRM) software, provides standardized forms for licensed facilities to report laboratory exposures, non-exposures and other incidents. These forms contain data validation rules to prevent missing mandatory data. Each report is monitored and processed by LINC in the Integrated Suite of Tools for Operational Processes (iSTOP) and undergoes manual verification by LINC to ensure completeness. A biocontainment review is conducted following receipt of incident reports. For each exposure report, a subsequent follow-up report providing updates and additional incident investigation details, such as root causes and corrective actions, is required and analyzed. If a follow-up report was not submitted, information from the initial exposure report is used.
Incident data from January 1, 2024, to December 31, 2024, were collected through the Biosecurity Portal and extracted from iSTOP on January 10, 2025, and analyzed for this article. The total number of active licences per sector was extracted from iSTOP on January 29, 2025. The analysis included reports that did not have a specific incident date, in which case the submission date was used.
Report variables
Several variables were used to describe the confirmed exposure incident reports in 2024, including exposure report type, activity being performed during the incident, occurrence types, root causes, reporting delay, licence sector, number of active licences, type of HPTs involved, and description of the incident. Definitions for the main activities and occurrence types are provided in the **Appendix, Table A1 and **Table A2. Information on affected individuals, such as their role, highest level of education and years of laboratory experience, was also collected. Other demographic data, such as gender, age and income, are not collected by LINC.
Analysis
The analysis was performed in R 4.2.2. Plots and tables were generated in R and Microsoft Excel, which was also used for data validation. This study also reviewed data from 2016–2023 to incorporate any updates to previously submitted reports.
Quantitative data analysis
Follow-up reports were reviewed to classify exposure incidents reported to LINC in 2024 as either confirmed exposures, including LAIs, or ruled out. Ruled out exposure incidents, which were excluded from the main analysis, include those ruled out after investigation, exposures involving RG1 pathogens (which are unregulated), and exposures that are not mandated under the HPTA and HPTR, such as incidents involving primary specimens or unlicensed laboratories. The incident rate of exposures to HPTs was calculated by dividing the number of reported exposure incidents by the total number of active licences during the surveillance period. The 2024 exposure incident rate was compared to rates from previous years and the baseline incident rate from 2016 to 2023. The baseline incident rate was calculated by dividing the total number of exposure incidents between 2016–2023 by the total number of active licences between 2016–2023. Descriptive statistics were obtained for continuous and categorical quantitative variables. Wilcoxon signed rank tests were used to compare exposure incident rates per sector in 2024 with those of 2016–2023. The t-tests were used to compare the monthly incident rates in 2024 with those of 2016–2023.
Qualitative data analysis
The text-based variables extracted from iSTOP followed an unstructured format, similar to journal entries. To transform the text into structured data, the variables underwent text preprocessing, including the removal of stop words, punctuation and whitespace. Through tokenization, the text was broken down into individual words, which were then analyzed for frequency and visualized in a plot. A manual revision of the text-based variables was also conducted for cross-validation.
Results
Between January 1, 2024 and December 31, 2024, LINC received 185 laboratory incident reports (Figure 1). Of these, 102 (55.1%) were exposure incidents, 67 (36.2%) were non-exposure incidents, and 16 (8.6%) were other incidents. The exposure incidents included 71 confirmed exposure incidents and 31 ruled out exposure incidents. The 71 confirmed exposure incidents, which involved 132 affected individuals, were further categorized into 68 (95.8%) confirmed exposures, two (2.8%) suspected LAIs, and one (1.4%) confirmed LAI.
Incidents reported to Laboratory Incident Notification Canada, 2024Abbreviations: LAIs, laboratory-acquired infections; LINC, Laboratory Incident Notification Canada
Annual and monthly exposure incident rate trends
In 2024, there were 1,052 active licences, of which 975 (92.7%) were for RG2 HPTs, 71 (6.7%) for RG3 HPTs, two (0.2%) for RG4 HPTs, and four (0.4%) for SSBAs (data not shown). The exposure incident rate, calculated as the number of confirmed exposure incidents per 1,000 active licences, was 67.5 in 2024. This represented a slight increase from 61.5 in 2023 (Figure 2). The annual baseline incident rate from 2016 to 2023 was 55.5 confirmed exposure incidents per 1,000 active licences (95% confidence interval [CI]: 43.2–67.9), an increase from the 2016 to 2022 baseline of 54.6 in the 2023 surveillance report ((13)). Although the 2024 exposure incident rate was higher than the annual baseline incident rate, the difference was not statistically significant (p=0.099).
Confirmed exposure incidents, suspected and confirmed laboratory-acquired infections, active licences and exposure incident rate, 2016–2024Abbreviation: LAI, laboratory-acquired infection
An average of 5.9 (95% CI: 4.7–7.1) confirmed exposure incidents per month was observed in 2024, which did not differ significantly from the monthly average of 4.5 (95% CI: 4.0–5.1) from 2016 to 2023 (p=0.07). The seasonality trend differed slightly in 2024 compared to the 2016–2023 median incidents per month and the baseline incidence, with the number of confirmed exposure incidents in 2024 peaking in May, September and November (n=9; 12.7% each) (Figure 3). Compared to the 2016–2023 median number of incidents per month, the frequency of incidents in 2024 was lower than expected in March (n=3; 4.2%) and nearly doubled in January (n=6; 8.5%), June (n=5; 7.0%), July (n=8; 11.3%) and November (n=9; 12.7%).
Seasonality analysis using median confirmed exposure incidents per month and baseline incidence, 2016–2024
Implicated human pathogens and toxins
Of the 75 known implicated HPTs, 64% (n=48) were RG2 pathogens and 36% (n=27) were RG3 pathogens (Table 1). There was one unknown pathogen, not included in Table 1. All of the RG2 pathogens implicated were non-SSBAs, with bacteria being the most frequently reported (n=34; 45.3%). In contrast, only 12% of implicated RG3 pathogens were non-SSBAs, with viruses being most commonly reported (n=4; 5.3%). All implicated SSBAs were RG3 pathogens and accounted for 24% of all HPTs, with bacteria being the most frequently involved pathogen (n=13; 17.3%).
Overall, bacteria and viruses were the leading HPTs implicated in exposure incidents involving both RG2 and RG3 pathogens. Except for parasites and cell lines, which were not implicated in any exposures, prions were the least commonly involved pathogens (2.7% for RG2; 1.3% for RG3). The confirmed LAI in 2024 was associated with Staphylococcus aureus, while the two suspected LAIs were linked to Mycobacterium tuberculosis and S. aureus. The top three most implicated HPTs in 2024 were Neisseria meningitidis (n=8; 10.7%), Brucella melitensis (n=6; 8.0%), and S. aureus (n=6; 8.0%).
Main activity
Reporters could select from 11 possible main activity types performed during the exposure incident: animal care, autopsy/necropsy, cell culture, education/training, in vivo animal research, maintenance, microbiology, microscopy, molecular investigations, serology or “other” (Appendix, Table A1). Microbiology and in vivo animal research were the most commonly reported activities in 2024, accounting for 67.6% and 8.5% of confirmed exposure incidents, respectively. The remaining activities were less frequently reported, each accounting for 1.4% to 5.6% of confirmed exposure incidents (data not shown).
Sector
Licensed facilities could belong to one of eight sectors: academic, do-it-yourself (DIY) biology, environmental health – government (environmental health), hospital, other government, public health – government (public health), private industry/business, or veterinary/animal health – government (veterinary/animal health). The other government sector includes facilities that handle HPTs at the federal, provincial/territorial and municipal levels, but are not classified under environmental health, public health or veterinary/animal health. The DIY biology sector, whose data was first analyzed and presented in 2024 ((13)), includes any individual conducting their own experiments who is not working within an institutionalized facility. Data for the “not specified” sector was also first analyzed in 2024 ((13)).
Between 2016 and 2023, the mean and median exposure incident rates were highest in the public health sector (mean=165.3, median=135.0), followed by veterinary/animal health (mean=123.7, median=92.6), academic (mean=106.9, median=95.7), and hospital sectors (mean=106.5, median=98.3) (Figure 4). Excluding the DIY biology sector and cases where the sector was not specified, the environmental health sector (mean=10.5, median=0) and private industry/business sector (mean=11.5, median=7.9) had the lowest incidence rates. The greatest variation in exposure incident rates was observed in the veterinary/animal health sector (interquartile range [IQR]: 128.3), while the private industry/business sector had the least variation (IQR: 12.9), excluding the DIY biology sector.
Exposure incidents per 1,000 active licences (exposure incident rates) by sector, 2016–2024aAbbreviations: ACD, academic; DIY biology, do-it-yourself biology; ENV, environmental health – government; HSP, hospital; Other, other government; PH, public health – government; PRV/BSN, private industry/business; VET/AN, veterinary/animal health – governmenta The boxplots summarize the exposure incidents per 1,000 active licences between 2016 and 2023. For each sector, the yellow diamond corresponds to the 2024 exposure incident rate, and the blue diamond corresponds to the mean exposure incident rate from 2016 to 2023. The black dot corresponds to an outlier. There is no yellow diamond for the incidents with no specified sector because there were no licences associated with these cases in 2024; the exposure incident rate for the cases with no specified sector reflects data from 2023 only
The 2024 exposure incident rate patterns mirrored trends observed between 2016 and 2023; however, incident rates in the hospital (incidence=156.6) and public health (incidence=261.9) sectors were statistically significantly higher (p<0.05) (Figure 4) in 2024 than trends from previous years. While exposure incident rates in the environmental health (incidence=0) and other government (incidence=20.8) sectors were visibly lower than those between 2016 and 2023, the differences were not statistically significant (p>0.35). Among the LAIs reported in 2024, one confirmed and one suspected case occurred in the hospital sector, while one suspected LAI occurred in the academic sector.
Occurrence types
Confirmed exposure incidents could have one or more of ten occurrence types (Appendix, Table A2). There were 103 occurrence types cited in 2024. Procedure-related occurrences (n=22; 21.4%) were the most common, followed by sharps (n=17; 16.5%), spill (n=16; 15.5%) and PPE (n=16; 15.5%) (Figure 5). The least cited occurrence types were unknown (n=4; 3.9%) and animal and insect occurrences, which were not cited in any confirmed exposure incidents.
Occurrence types involved in confirmed exposure incidents, 2024 (n=103)Abbreviation: PPE, personal protective equipment
Root causes
There are six main root causes that can be associated with an exposure incident: human factors, SOPs, training, management/oversight, equipment, and communication. Examples of areas of concern for each of these categories are presented in Table 2. Most confirmed exposure incidents cited multiple root causes (n=167), averaging 2.35 root causes per confirmed exposure (Table 2). Human factors were the most common root cause (n=44; 62%), followed by SOP (n=27, 38%).
Affected individuals
A total of 132 individuals were affected in the confirmed exposure incidents, averaging 1.86 affected persons per incident. The three sectors with the highest mean number of affected persons per confirmed exposure incident were private industry/business (mean=4.00), hospital (mean=2.42) and public health (mean=2.00), while the lowest mean was in academic sector (mean=0.79) (Figure 6). The public health and hospital sectors also had the highest mean number of affected persons per active licence (mean=0.52 and mean=0.38, respectively), while the other government sector had the lowest (mean=0.02) (Figure 6).
Mean number of affected persons per exposure incident and per active licence by sector, 2024Abbreviations: ACD, academic; DIY biology, do-it-yourself biology; ENV, environmental health – government; HSP, hospital; Other, other government; PH, public health –government; PRV/BSN, private industry/business; VET/AN, veterinary/animal health – government
The majority of affected individuals were technicians/technologists (n=101; 76.5%) with a median of 8.5 years of laboratory experience (Figure 7). Students (n=13; 9.8%) were the second most affected individuals and had the least laboratory experience (median=0 years). Among the roles with the lowest number of affected individuals (n=2; 1.5% each) were supervisors/managers, who had the most laboratory experience (median=13.5 years), researchers (median=6 years), and animal handlers (median=5.5 years).
Affected individuals in confirmed exposure incidents reported by number of years of laboratory experience and main role, 2024 (n=132)
Reporting delay
Reporting delay refers to the time between when the exposure incident actually happened and when it was reported to PHAC through LINC. The median time between incident date and reporting date in 2024 was five days, the shortest duration since 2020 (Figure 8). Compared to previous years, with the exception of 2022, there was also less variation in the reporting delay in 2024, with an IQR of seven days, approximately 50% less than in most past years.
Time between when the confirmed exposure incident happened and when it was reported to Laboratory Incident Notification Canada, 2016–2024
Qualitative analysis
Seventy of the 71 confirmed exposure incidents provided text-based descriptions of the incidents. The frequencies of the most commonly used words to describe exposure incidents by occurrence type are presented in Figure 9. Overall, the most frequent words were “plate” (n=52; 5.7%), “biological safety cabinet” (BSC) and “tube” (each n=42; 4.6%), “culture” (n=41; 4.5%), “gloves” (n=36; 4.0%), “gram” (n=32, 3.5%), “lab” (n=29; 3.2%), “bench” (n=28; 3.0%), “test” (n=26; 2.8%), “blood” and “technologist” (each n=25; 2.8%) and “organism” (n=24; 2.6%). All of these words were mentioned in at least four occurrence types.
Heatmap of most frequently used words to describe confirmed exposure incidents, 2024aAbbreviations: AP, affected person; ATCC, American Type Culture Collection; BSC, Biological Safety Cabinet; gram, gram stain test/gram smear; MALDI, matrix-assisted laser desorption/ionization; MLT, medical lab technologist; PPE, personal protective equipment; SARS-CoV-2, severe acute respiratory syndrome coronavirus 2; VITEK, VITEK 2 system (BioMérieux)a Coloured tiles refer to the frequency of the word. Blank tiles do not indicate absence of word usage in the occurrence type, but that it was not used frequently enough to be considered among the most used words
The word “plate,” primarily referring to petri dishes/culture plates, appeared across four occurrence types: most frequently in procedure, then loss of containment, “other,” and spill. It was used frequently along with “culture,” which also appeared most often in procedure-related occurrences, “BSC,” and “gram” (referring to gram stain tests for bacteria). Manual examination of the descriptions found that exposures often resulted during identification of HPTs in plates or while working in proximity to cultures or colonies in the plates, particularly on an open bench. The word “tube,” mentioned in occurrences related to PPE, procedure, sharps, and spills, was commonly used to describe liquid spills, issues with vortexing and broken glass from tubes breaking. The word “gloves” was the only one to appear across all occurrence types, mostly used to state that they were being worn during the incident.
Discussion
An increase in the exposure incident rate was observed in 2024, continuing the upward trend since 2022 ((13)). While this rise may be due in part to a return to pre-COVID-19 working conditions, other factors could have also contributed, including increased familiarity with the incident reporting process. For example, over the past few years, PHAC engaged with stakeholders through conferences, webinars ((23,24)), information bulletins ((25)), e-learning courses ((26)) and inspections to enhance awareness of the surveillance program and reinforce appropriate reporting practices. These actions may have contributed to increased reporting and a reduction in reporting delays in 2024.
Consistent with previous years, microbiology and in vivo animal research remained the most frequently reported activities being conducted at the time of the confirmed exposure incident ((9–13)). Primary occurrence types remained procedure-related and sharps-related ((9–13)), while human factors and SOPs continued to be the most commonly cited root causes (8–13). Technicians and technologists represented the majority of affected individuals ((8–13)), and non-SSBAs, RG2 and bacteria remain the most implicated HPTs (9–13). For the second consecutive year, the bacteria B. melitensis, emerged as a leading SSBA ((12,13)), a trend also observed in the FSAP ((15)). No RG4 HPTs were implicated in exposure incidents in 2024.
Public health sector had the highest exposure incident rate
Analysis of the data revealed that the public health sector had the highest exposure incident rate in 2024, and the highest mean exposure incident rate from 2016 to 2023. While no studies indicate that public sector facilities have distinct laboratory practices leading to greater risks, the relatively small number of licences in this sector may contribute to an overrepresentation of incidents in the data. The veterinary/animal health sector had the second-highest exposure incident rate, which could be due to the larger number of possible exposure routes when working with animals (i.e., biting, scratching) compared to in vitro settings ((27)) and more risks working with animals. These sectors also had larger IQRs, potentially because of variation of research activity from year-to-year and disruption in activity in 2020 and 2021 due to the COVID-19 pandemic ((11,12,28,29)).
Increase in affected individuals, differences between sectors
A higher average number of affected persons per confirmed exposure incident was noted in 2024 compared to the last few years, with the exception of 2022 ((10–13)). While an average of 1.57 persons were affected per confirmed exposure incident in 2023, this average rose to 1.86 in 2024. This was due to the greater number of confirmed exposure incidents involving more than five individuals compared to the previous year. Differences in affected persons by sector were also observed in 2024. The private industry/business sector, which historically has had fewer confirmed exposure incidents (Figure 4), had the highest mean number of affected individuals per confirmed exposure. This could indicate that a larger number of individuals were working on the task or were nearby during the confirmed exposure incident. The higher number of affected individuals per licence in the public health and hospital sectors could be attributable to contact with cultured biohazardous samples (i.e., blood cultures) ((29)) and higher risk HPTs. The majority of licensed facilities are containment level 2, where hand-to-face contact transmission might be a significant risk to workers ((30)).
A qualitative analysis provides more insight about exposure incidents
A qualitative analysis of the confirmed exposure incidents revealed occurrence type-specific trends and overall areas to improve. Procedure-related occurrences frequently involved exposures from working with HPT cultures on an open work bench, instead of working in a BSC, without knowing the cultures consisted of higher risk pathogens (e.g., when opening/examining plates, identifying the organism). This situation was also described in loss of containment-related occurrences. This suggests that stronger emphasis on handling cultures in a BSC is needed to prevent aerosol releases or transmission, even if it may not necessarily be the current common practice ((31,32)). For sharps-related occurrences, finger-pricking from needles (e.g., during re-capping, injection, obtaining samples) or cuts by glass shards from broken tubes/slides were the main sources of exposure, while cuts by scalpels/blades were less common. This could be due to the greater number of tasks involving needles. The increased risk of occupational injuries related to needles and glass shards has been documented in other studies ((33–36)). There should, therefore, be increased caution when performing certain high-risk procedures. Equipment-related occurrences most commonly involved the malfunctioning of the BSC blower motor and tubing issues. Although the word “autoclave” was used most frequently for equipment-related occurrences, it was usually to confirm that it had been used for sterilization. However, there was one incident involving exposure to waste that had not been properly autoclaved. Further, while most of the exposure incident descriptions mentioned that gloves and laboratory coats were worn as PPE, face masks and eye protection equipment tended not to be worn as consistently and partially explained the reason for some of the confirmed exposures.
Limitations
The use of standardized reporting forms during the incident reporting process over the past nine years remains a strength. It has allowed for the collection of consistent data and enhanced the reliability of trend analysis and identification of biosafety challenges.
Lack of facility-specific details (e.g., size of workforce, breakdown of roles, years of experience of each employee, etc.) remains a limitation. Access to such data could enable more detailed analyses using inferential statistics and hypothesis-driven studies to explore potential factors associated with laboratory exposure incidents. Second, there is a relatively small sample size of confirmed exposure incidents each year, potentially leading to higher variability in the results and challenges in detecting trends. The possibility of underreporting remains, though its scale cannot be estimated. Licence holders can only self-identify in one sector, which does not take into consideration the fact that a facility can operate in more than one sector. As the number of active licences each year is recorded by LINC at the beginning of each year, inaccuracies may occur when conducting analyses retrospectively, since the number can vary slightly throughout the year. Finally, a lack of comparable national incident reporting surveillance systems outside Canada remains a limitation that affects our ability to contextualize these findings and trends internationally ((37)).
Conclusion
The exposure incident rate continued to increase in 2024 and surpassed all pre-pandemic levels, except for 2018. Most of the confirmed exposure incident characteristics in 2024 were consistent with previous years. Sector-specific analyses found that the public health sector had both the highest exposure incident rate between 2016 and 2024, and the highest number of affected persons per active licence between 2016 and 2024. The qualitative analysis of confirmed exposure incident reports identified that not working with cultures in a BSC and a lack of face-related PPE were common factors in confirmed exposure incidents. The insights from this report can inform enhancements to biosafety guidelines and practices, thereby helping to reduce exposure incidents in licensed Canadian facilities.
The reference list from the paper itself. Each links out to its DOI / PubMed record.
- 1El Jaouhari M, Striha M, Edjoc R, Bonti-Ankomah S. Laboratory-acquired infections in Canada from 2016 to 2021. Can Commun Dis Rep 2022;48(7-8):303–7. 10.14745/ccdr.v 48i 78a 0237334256 PMC 10275617 · doi ↗ · pubmed ↗
- 2Blacksell SD, Dhawan S, Kusumoto M, Le KK, Summermatter K, O’Keefe J, Kozlovac JP, Almuhairi SS, Sendow I, Scheel CM, Ahumibe A, Masuku ZM, Bennett AM, Kojima K, Harper DR, Hamilton K. Laboratory-acquired infections and pathogen escapes worldwide between 2000 and 2021: a scoping review. Lancet Microbe 2024;5(2):e 194–202. 10.1016/S 2666-5247(23)00319-138101440 · doi ↗ · pubmed ↗
- 3Pappas G. The Lanzhou Brucella Leak: The Largest Laboratory Accident in the History of Infectious Diseases? Clin Infect Dis 2022;75(10):1845–7. 10.1093/cid/ciac 46335675697 · doi ↗ · pubmed ↗
- 4Public Health Agency of Canada. Human Pathogens and Toxins Act (HPTA). Ottawa, ON: PHAC; 2023. [Accessed 2025 Jan 20]. https://lois-laws.justice.gc.ca/eng/acts/H-5.67/Full Text.html
- 5Government of Canada. Human Pathogens and Toxins Regulations (SOR/215-44). Ottawa, ON: Government of Canada; 2024. [Accessed 2025 Apr 7]. https://laws-lois.justice.gc.ca/eng/regulations/SOR-2015-44/index.html
- 6Bienek A, Heisz M, Su M. Surveillance of laboratory exposures to human pathogens and toxins: Canada 2016. Can Commun Dis Rep 2017;43(11):228–35. 10.14745/ccdr.v 43i 11a 0429770052 PMC 5764741 · doi ↗ · pubmed ↗
- 7Pomerleau-Normandin D, Heisz M, Tanguay F. Surveillance of laboratory exposures to human pathogens and toxins: Canada 2017. Can Commun Dis Rep 2018;44(11):297–304. 10.14745/ccdr.v 44i 11a 0530996692 PMC 6449110 · doi ↗ · pubmed ↗
- 8Choucrallah D, Sarmiento L, Ettles S, Tanguay F, Heisz M, Falardeau E. Surveillance of laboratory exposures to human pathogens and toxins: Canada 2018. Can Commun Dis Rep 2019;45(9):244–51. 10.14745/ccdr.v 45i 09a 0431650987 PMC 6781952 · doi ↗ · pubmed ↗