Long non‐coding RNA lncAPAT promotes atherosclerotic plaque instability by targeting ribosomal protein L22
Rongxia Li, Qiyue Zhang, Yu Chen, Shuting Wang, Shuang Han, Adalaiti Kamili, Yixuan Zhong, Shujun Yang, Weili Zhang

TL;DR
A new long non-coding RNA called lncAPAT increases heart plaque instability by affecting macrophage inflammation and gene regulation.
Contribution
Discovery of a novel human-specific lncRNA, lncAPAT, and its role in promoting atherosclerotic plaque instability via RPL22 inhibition.
Findings
LncAPAT is highly expressed in patients with coronary artery disease and mixed plaques.
LncAPAT promotes macrophage inflammation and plaque instability by inhibiting RPL22 transcription.
RPL22 inhibition increases inflammatory cytokines and contributes to atherosclerosis progression.
Abstract
Long non‐coding RNAs (lncRNAs) regulate macrophage inflammation and atherosclerotic plaque stability, but mechanisms need comprehensive investigations. Whole‐transcriptome sequencing was used to identify a novel human‐specific lncRNA, lncAPAT (atherosclerotic plaque instability‐associated transcript), in the peripheral blood of patients with coronary artery disease (CAD; n = 5) with mixed plaques on coronary computed tomography angiography (CCTA). LncAPAT was quantified using quantitative real‐time polymerase chain reaction in the discovery cohort and independently validated in patients with coronary mixed plaques by CCTA (n = 22) and in patients with acute ST‐segment elevation myocardial infarction (STEMI; n = 22). Myeloid cell‐specific lncAPAT knock‐in mice were generated and injected with recombinant adeno‐associated virus of murine proprotein convertase subtilisin/kexin type 9 to…
Genes, proteins, chemicals, diseases, species, mutations and cell lines named across the full text — each resolved to its canonical identifier and authoritative record.
Click any figure to enlarge with its caption.
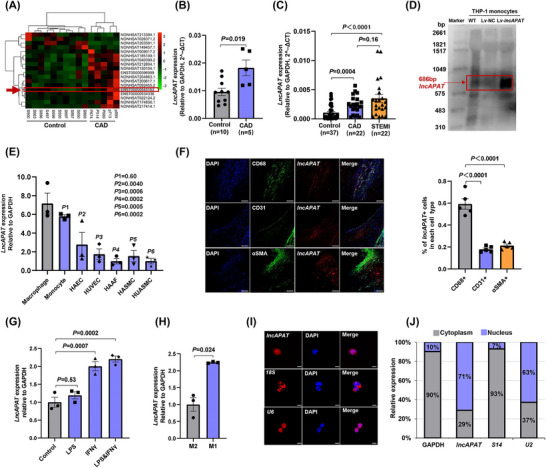 FIGURE 1
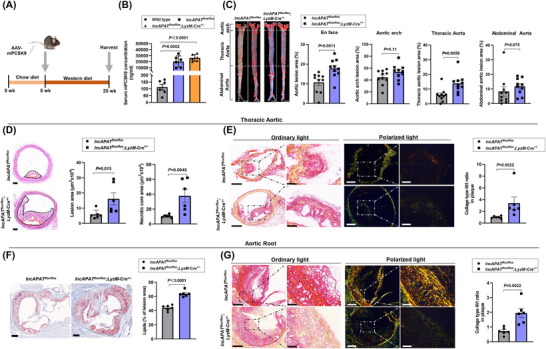 FIGURE 2
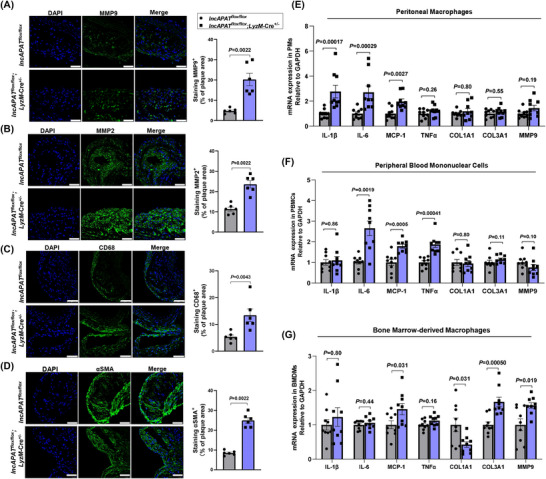 FIGURE 3
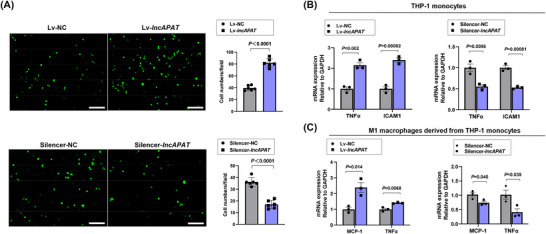 FIGURE 4
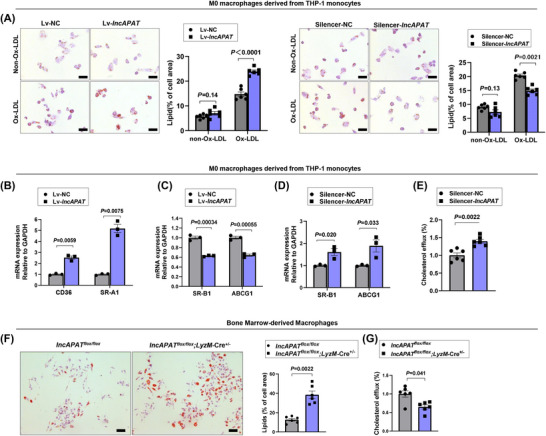 FIGURE 5
 FIGURE 6
 FIGURE 7
- —High Level Hospital Clinical Research Funding
- —National Natural Science Foundation of China10.13039/501100001809
Peer Reviews
No public reviews on file for this paper yet. If you reviewed it on a platform where reviews are public (OpenReview, ICLR, NeurIPS, ICML), you can paste yours below so the community can read it here.
Videos
No videos yet. Explain this paper in a talk, walkthrough, or lecture? Add one.
Taxonomy
TopicsCancer-related molecular mechanisms research · Atherosclerosis and Cardiovascular Diseases · interferon and immune responses
INTRODUCTION
1
Atherosclerosis is a chronic inflammatory disorder that underlies cardiovascular disease pathogenesis. Atherosclerotic plaque rupture and thrombosis are clinical manifestations of cardiovascular diseases, including stroke and myocardial infarction. In atherosclerosis, circulating monocytes are recruited to the injured endothelium where they encounter macrophage colony‐stimulating factor, which leads to their differentiation into macrophages and subsequent lipoprotein engulfment.1 Macrophages internalise native and modified low‐density lipoprotein through micropinocytosis or scavenger receptor pathways, leading to foam cell formation, a characteristic of atherosclerotic plaques. Foam cells release proinflammatory cytokines and chemokines that exacerbate the inflammatory response, playing a critical role in early atherogenesis and plaque instability.1, 2 Recent studies have highlighted key epigenetic regulators involved in atherosclerosis development, but the molecular mechanisms that regulate plaque instability have not been thoroughly determined.3
Long non‐coding RNAs (lncRNAs) are transcripts that exceed 200 nucleotides in length, with minimal protein‐coding capacity. Recent studies have highlighted the clinical relevance of lncRNAs in cardiovascular diseases, particularly in terms of their ability to modulate atherosclerotic plaque stability, which is a key determinant of acute cardiovascular events, such as stroke and myocardial infarction. Several lncRNAs have been implicated in plaque destabilisation. For example, PSMB8‐AS1 has been shown to exacerbate atherosclerosis by upregulating PSMB9 expression, contributing to the inflammatory response and plaque rupture.4 Knockdown of lncRNA RAPIA, which was highly expressed in advanced atherosclerotic lesions and macrophages, exerted atheroprotective effects through inducing the apoptosis of macrophages.5 Moreover, INKILN has been reported to enhance vascular smooth muscle cell activation, which is closely linked to fibrous cap thinning and plaque vulnerability.6 The roles of specific lncRNAs in plaque instability are well appreciated, but further identification and characterisation of novel lncRNAs may yield new perspectives about the mechanisms of plaque destabilisation, facilitating the identification of potential therapeutic targets to prevent clinical events.
Coronary artery atherosclerosis (CAD) is considered systemic arteriosclerosis. The resulting coronary artery stenosis can impair blood flow to the heart, causing symptoms such as chest tightness and pain because of luminal narrowing. Coronary computed tomography angiography (CCTA) permits non‐invasive visualisation of the coronary arteries, providing an overall assessment of the atherosclerosis burden and determining plaque volume subtypes within the coronary artery lumen.7, 8 CCTA has become the primary method used to screen and diagnose coronary artery atherosclerosis because of the abundance of strong outcome and cost‐effectiveness data.9 Another imaging option is optical coherence tomography, an invasive high‐resolution imaging technique that effectively delineates plaque characteristics, such as fibrous cap thickness, lipid necrotic core size, and calcification, and it has shown a strong correlation with histological analysis.10, 11
Herein, we report a novel human‐specific lncRNA, lncAPAT (atherosclerotic plaque instability‐associated transcript), which was highly expressed in the peripheral blood of CAD patients with coronary mixed plaques according to whole‐transcriptome sequencing. We explored the effects of lncAPAT on inflammation and plaque instability in myeloid cell‐specific lncAPAT knock‐in mice and evaluated its function. Moreover, we identified the potential targets of lncAPAT and further explored the mechanisms underpinning the involvement of lncAPAT in atherosclerosis progression.
METHODS
2
The full methodological details can be found in the Supporting Information.
Studied patients
2.1
Two independent clinical cohorts were enrolled to investigate lncAPAT expression. The participants were not receiving any lipid‐lowering therapy within 3 months before admission. The discovery cohort was designed to identify differentially expressed lncRNAs by whole‐transcriptome sequencing, and the findings were confirmed by quantitative real‐time polymerase chain reaction (qRT‐PCR). The discovery cohort comprised 15 subjects: five CAD patients with mixed plaques and 10 control individuals. Subjects who were suspected of having CAD and who were scheduled to undergo CCTA at FuWai Hospital were consecutively enrolled between March and April 2017. Patients with haemopathies, peptic ulcers, hepatic and/or renal insufficiency, infections, autoimmune disease, and/or tumours were excluded. Coronary artery images were acquired using a 64‐detector row CT system (GE Healthcare), which were interpreted by two independent radiologists blinded to the patients’ information. According to the coronary plaque characteristics, the patients were divided into two groups: the control group and the mixed plaque group. Plaques were classified as described previously.8 Specifically, plaques ≥1 mm^2^ in structure and distinctly separate from the coronary artery lumen were classified as atherosclerotic plaques (Figure S1), whereas lesions <1 mm^2^ in structure were assigned to the control group. Plaques containing lipid, fibrous, and calcified components were regarded to be mixed plaques. Human peripheral blood samples were collected in Tempus^™^ Blood RNA Tubes after a 12‐h overnight fast and stored at −80°C. The clinical characteristics of participants are presented in Table S1.
A validation cohort was established to confirm lncAPAT expression across the plaque subtypes. The validation cohort comprised 81 participants (22 CAD patients with mixed plaques, 22 ST‐segment elevation myocardial infarction [STEMI] patients, and 37 control individuals) enrolled from March 2017 to March 2019 at FuWai Hospital. The control individuals and patients with CAD were recruited using the same criteria as in the discovery cohort. Patients with acute STEMI underwent primary percutaneous coronary intervention and optical coherence tomography for culprit lesions. Patients with shock of cardiac origin, severe hepatic and/or renal insufficiency (estimated glomerular filtration rate <30 mL/min/1.73 m^2^), congestive heart failure (left ventricular ejection fraction <50%), allergy to contrast media, or contraindications to aspirin or ticagrelor were excluded. Peripheral blood samples were collected from STEMI patients upon admission to the emergency department and before the initiation of percutaneous coronary intervention, ensuring that all specimens were obtained prior to reperfusion therapy. Peripheral blood samples were collected in Tempus Blood RNA Tubes and stored at −80°C for qRT‐PCR analysis of lncAPAT expression. The clinical characteristics of the participants are shown in Table S2.
To investigate the expression of lncAPAT in smooth muscle cells, endothelial cells, and macrophages within atherosclerotic plaques, five human carotid atherosclerotic plaques were obtained from patients undergoing carotid endarterectomy at Fuwai Hospital between March and April 2017. Immediately after excision, the plaques were snap‐frozen in liquid nitrogen and stored at −80°C for subsequent analyses.
This study was conducted in compliance with the Declaration of Helsinki and approved by the Ethics Committee of Fuwai Hospital, with written informed consent obtained from all participants.
Whole‐transcriptome sequencing and data analysis
2.2
Total RNA was extracted from peripheral blood using the Tempus^™^ Spin RNA Isolation Kit (Thermo Fisher). Strand‐specific libraries were prepared using the TruSeq^®^ Stranded Total RNA Sample Preparation Kit (Illumina) according to the manufacturer's instructions, followed by sequencing on the Illumina HiSeq X‐ten platform. Differentially expressed lncRNAs were identified using the following criteria: false discovery rate ≤.01, fold change ≥2, and fragments per kilobase million (FPKM) ≥1. The protocol details are presented in the Supporting Information.
Northern blot
2.3
Northern blot analysis was performed using a DIG Northern Starter Kit (Roche) to confirm the presence of the lncAPAT transcript. The protocol details are presented in the Supporting Information.
Fluorescence in situ hybridisation
2.4
The Ribo Fluorescent In Situ Hybridization Kit (RiboBio) was used to perform RNA fluorescence in situ hybridisation to determine subcellular localisation of lncAPAT in macrophages. The cytoplasmic and nuclear positive controls were h‐18S and h‐U6, respectively. Images were obtained using a confocal laser scanning microscope (Leica).
Cytoplasmic and nuclear RNA purification
2.5
RNA from the cytoplasm and nucleus was separated using a Cytoplasmic & Nuclear RNA Purification Kit (Norgen). The subcellular localisation of lncAPAT in macrophages was analysed by the qRT‐PCR method. The localisation of lncAPAT in the cytoplasm and nucleus was normalised to ribosomal protein S14 and U2 small nuclear ribonucleoprotein, respectively. The primers are listed in Table S3.
Chromatin isolation by RNA purification and sequencing
2.6
The chromatin isolation by RNA purification (ChIRP) procedure was carried out using the EZ‐Magna ChIRP RNA Interactome Kit (Millipore). Antisense biotinylated DNA tiling probes corresponding to full‐length lncAPAT were designed (RiboBio, China). RNA from the enriched product was isolated with Qiagen miRNeasy^®^ Mini Kit and analysed using iTaq Universal One‐Step Kit (Bio‐Rad). DNA from the enriched product was analysed using the NovaSeq 6000 platform (Illumina). The protocol details are presented in the Supporting Information.
Mouse studies
2.7
Myeloid cell‐specific lncAPAT knock‐in mice were generated by Cyagen Biosciences. Briefly, the CAG‐loxP‐Stop‐loxP‐APAT‐polyA cassette was cloned into the Gt (ROSA)26Sor locus in C57BL/6N mice by CRISPR/Cas9‐mediated gene‐editing technology to generate lncAPAT heterozygous mice, which were identified by positive PCR screening. Heterozygous male and female mice were used as founders to generate control mice [C57BL/6N‐Gt (ROSA)26Sor^em1^(APAT)^Cyagen^, *lncAPAT^flox/flox^ *]. LncAPAT was not expressed in *lncAPAT^flox/flox^
- mice because of the ‘stop’ sequence in front of the loxP sites. *LncAPAT^flox/flox^
- mice were crossed with LyzM‐Cre mice, a strain with myeloid cell‐specific cyclisation recombinase expression, to obtain the experimental mice (myeloid cell‐specific lncAPAT expression, lncAPAT^flox/flox^;LyzM‐Cre^+/−^). Control and experimental mice were littermates. LncAPAT^flox/flox^;LyzM‐Cre^+/−^ male mice were crossed with *lncAPAT^flox/flox^
- female mice, yielding approximately equal numbers of control (*lncAPAT^flox/flox^ *) and experimental (*lncAPAT^flox/flo^
^x^ ;LyzM‐Cre^+/−^) mice. The genotyping methods are presented in the Supporting Information.
The atherosclerosis mouse model in this study was established as Bjorklund's approach.12 To induce atherosclerosis, 8‐week‐old male mice were injected with 5.0 × 10^11^ vector genomes recombinant adeno‐associated virus of murine proprotein convertase subtilisin/kexin type 9 (rAAV‐mPCSK9; Vigenebio) via the tail vein, followed by a 12‐week western diet (Research Diets, 1.25% cholesterol and .5% sodium cholate). At 19 weeks, blood samples were taken from the retro‐orbital sinus, and the serum was separated to measure the concentrations of lipids, mPCSK9, glucose, and transaminase. At the end of the study (at 20 weeks), the mice were euthanised by intraperitoneal injection of pentobarbital (50 mg/kg; Sigma), and the aortae were collected for histological analysis. An atherosclerotic plaque area of approximately 5%–25% in the whole aorta and 20%–70% in the aortic arch was induced at 20 weeks.
Peripheral blood mononuclear cells (PBMCs), bone marrow‐derived macrophages (BMDMs), peritoneal macrophages, and bone marrow neutrophils were isolated and cultured to analyse gene expression. Male mice were primarily used in this study to minimise potential variability arising from sex differences. Nevertheless, to ensure the robustness and generalisability of our findings, the pro‐atherogenic effect of lncAPAT and the expression changes of its downstream targets in plaque tissues were independently validated in female mice. A random number table was used for randomisation. The mouse experiments were blinded through numerical coding of the samples. All animal studies were conducted in compliance with FuWai Hospital's Institutional Animal Care and Use Committee and followed Directive 2010/63/EU of the European Parliament for the ethical use of animals in research.
Atherosclerotic lesion analysis
2.8
Atherosclerotic lesions in the mouse aorta were assessed by en face analysis and cross‐sectional measurement. Aortic en face lesions were assessed using Oil red O staining (Sigma‐Aldrich). Images were obtained using a stereomicroscope‐dedicated camera (Zeiss). Atherosclerotic lesions in the aorta were expressed as a percentage of the overall surface area.
For the analysis of plaque morphology, fresh isolated heart and aortic tissues were frozen, and 8‐µm‐thick sections (spaced .5‐mm apart) were continuously cut. The aortic root was identified by the appearance of aortic valve leaflets, and the plaque lesion area was analysed in three consecutive sections for each mouse. Thoracic aortic sections were collected from the most stenotic part of the plaque, and three consecutive sections for each mouse were analysed. Haematoxylin and eosin staining was performed, and lesion size was quantified by a technician blinded to the experimental groupings by morphometric analysis using Image‐Pro Plus software (Media Cybernetics).13 Lesion area was recorded as an average of three consecutive sections per mouse.
Plaque composition and lesion stability were also assessed. Oil red O staining was used to assess the lipid content of the plaques, and Picrosirius Red staining was used to assess the ratio of type III/I collagen. Moreover, Masson's trichrome staining was used to assess the total collagen content, and Verhoeff–Van Gieson staining was used to assess elastin. Immunohistochemical staining was used to assess the expression of matrix metalloproteinases (MMPs), α‐smooth muscle actin, and ribosomal protein L22 (RPL22) in macrophages from plaque lesions. The protocol details are presented in the Supporting Information.
Lipid profiling
2.9
Serum total cholesterol, triglycerides, transaminase, and glucose were measured in mice using an automatic dry biochemical analyser (Fujifilm). Serum high‐density and low‐density lipoprotein cholesterol concentrations were assessed by a double reagent direct method (Nanjingjiancheng). The protocol details are presented in the Supporting Information.
Cell adhesion assay
2.10
Cell adhesion assays were performed to assess the effect of lncAPAT on monocyte adhesion to endothelial cell monolayers. The protocol details are presented in the Supporting Information.
Cholesterol accumulation and efflux assays
2.11
Oil red O staining was used to evaluate macrophage cholesterol accumulation, and the cholesterol efflux assay was used to assess macrophage cholesterol reversal. The protocol details are presented in the Supporting Information.
RNA immunoprecipitation assay
2.12
RNA immunoprecipitation assays were performed by PureBinding RNA immunoprecipitation kit (Geneseed) to evaluate the interaction between the RPL22 protein and monocyte chemoattractant protein‐1 (MCP‐1) RNA in mouse BMDMs. In brief, 1 × 10^7^ cells were homogenised in immunoprecipitation lysis buffer containing RNasin and protease inhibitor, before being split into two samples for anti‐RPL22 and anti‐immunoglobulin G (IgG) treatment. Protein A/G Magnetic Beads were used to link the ribosomal protein RPL22 mouse monoclonal antibody (Santa Cruz) or IgG as the negative control, followed by incubation with cell lysis buffer to capture RNA–protein complexes overnight at 4°C. The relative enrichment of human or mouse MCP‐1 mRNA was analysed by qRT‐PCR. The protocol details are presented in the Supporting Information.
qRT‐PCR and western blot
2.13
mRNA expression was analysed by qRT‐PCR using the ABI 7500 System (Applied Biosystems), and the primers are shown in Table S3. The protein expression of RPL22 and MCP‐1 was determined by western blotting. The protocol details are presented in the Supporting Information.
Statistical analysis
2.14
All experimental data were tested for normality using the Shapiro–Wilk normality test. For normally distributed data, the two‐tailed Student's t‐test was used for comparisons between two groups, and one‐way analysis of variance with Tukey's multiple‐comparisons test was used for multiple‐group comparisons. For non‐normally distributed data, the Mann–Whitney U‐test or the Kruskal–Wallis test followed by Dunn's multiple‐comparison test was performed, as appropriate. Power analyses were conducted with G*Power software (version 3.1.9.7) to calculate the statistical power based on the current sample size. In the discovery cohort, with an α level of .05 and an effect size (d) of 1.60, the statistical power was .748. In the validation cohort, with an effect size (d) of 1.50 for group comparisons, the statistical power was .998.
SPSS (version 20.0; SPSS Inc.) was used for the statistical analyses. Two‐sided p < .05 was considered statistically significant. Technical repeats and single mice are indicated using symbols, where appropriate. All data are presented as the mean ± standard error of the mean.
RESULTS
3
LncAPAT is highly expressed in the peripheral blood of patients with coronary plaques
3.1
To screen differentially expressed lncRNAs associated with atherosclerotic plaque instability, whole‐transcriptome sequencing was performed using peripheral blood samples from control individuals and from CAD patients with mixed plaques on CCTA. A total of 18 lncRNAs were found to be differentially expressed with a cutoff threshold of fold change ≥2, false discovery rate ≤.01 and FPKM ≥1 (Figure 1A), and subsequently verified by qRT‐PCR analysis (Figure S2). Among these transcripts, a novel lncRNA transcript, poly (ADP‐ribose) polymerase family member 11 antisense RNA 1 202 (Ensembl ID: ENST00000545163), located on chromosome 12 with a length of 686 bp, was particularly notable because of the high expression in patients with mixed coronary plaques. This transcript was named lncAPAT (Figure 1B). Agarose gel electrophoresis was also performed to evaluate the RT‐PCR product yield of lncAPAT in peripheral blood RNA samples from these participants (Figure S3). Furthermore, in a validation cohort comprising 81 subjects (37 control subjects, 22 CAD patients with mixed plaque, and 22 patients with acute STEMI), lncAPAT expression in peripheral blood RNA samples was elevated by 2.7‐fold in patients with CAD and by 2.9‐fold in patients with STEMI compared with the control individuals, respectively. No significant change in lncAPAT expression was observed between CAD and STEMI patients (Figure 1C).
LncAPAT is highly expressed in the peripheral blood of patients with coronary mixed plaques. (A) Heatmap of differentially expressed transcripts in peripheral blood of patients with coronary artery disease (CAD) with mixed plaques on coronary computed tomography angiography (CCTA; n = 5) compared with control subjects (n = 10). (B) The expression of lncAPAT was determined by the quantitative real‐time polymerase chain reaction (qRT‐PCR) method in the same samples. (C) The expression of lncAPAT was determined by the qRT‐PCR method in the peripheral blood of CAD patients with CCTA examination (n = 22), acute ST‐elevation myocardial infarction (STEMI) patients with optical coherence tomography examination (n = 22), and control subjects (n = 37). (D) Northern blotting analysis of lncAPAT expression in THP‐1 monocytes. (E) The expression profiling of lncAPAT in vascular cells, including THP‐1 macrophages and monocytes, human aortic endothelial cells (HAECs), human umbilical vein endothelial cells (HUVECs), human aortic adventitial fibroblast cells (HAAFs), human aortic smooth muscle cells (HASMCs), and human umbilical artery smooth muscle cells (HUASMCs; n = 3 in each group). (F) Representative images and quantification of fluorescence in situ hybridisation for lncAPAT (red) and immunostaining for CD68 (green), CD31 (green), αSMA (green), along with 4′,6‐diamidino‐2‐phenylindole (DAPI) nuclear stain (blue) in carotid atherosclerotic plaques from patients undergoing carotid endarterectomy surgery (n = 5). Scale bar = 250 µm. (G) The expression levels of lncAPAT in THP‐1 monocytes when treated with LPS, IFNγ, and LPS & IFNγ, respectively. (H) The expression of lncAPAT in M1 and M2 macrophages derived from THP‐1 monocytes (n = 3 in each group). (I) RNA fluorescence in situ hybridisation for lncAPAT was performed in macrophages derived from THP‐1 monocytes, and 18S ribosomal RNA and U6 small nuclear RNA were used as positive controls of cytoplasm and nucleus, respectively. Scale bar = 8 µm. (J) Quantitative analysis of lncAPAT in cytoplasm and nucleus of macrophages derived from THP‐1 monocytes by qRT‐PCR method, and ribosomal protein S14 and U2 small nuclear ribonucleoprotein were used as endogenous controls of cytoplasm and nucleus, respectively (n = 3 in each group). For B and C, grey bars represent control subjects, blue bars represent CAD patients, and orange bars represent STEMI patients. For E, G and H, grey bars represent control group, blue bars represent experimental group. For F, grey bars represent CD68⁺ macrophages, blue bars represent CD31⁺ endothelial cells, and orange bars represent α‐SMA⁺ smooth muscle cells. For I, grey bars represent cytoplasm, blue bars represent nucleus. Values within the bar represent the percentage of lncAPAT expression. Mann–Whitney U‐test was used for B. Kruskal–Wallis test followed by Dunn's multiple‐comparison tests was used for C. One‐way ANOVA with Tukey's multiple‐comparisons test was used for E, F, and G. The two‐tailed unpaired t‐test was used for H. Data are mean ± standard error of the mean (SEM).
Considering the heterogeneity of peripheral blood, magnetic bead‐based separation was used to isolate lymphocytes (CD19⁺ B cells and CD3⁺ T cells) and CD14⁺ monocytes/macrophages from the peripheral blood of four control subjects to assess the cell‐type specificity of lncAPAT expression. The results show that lncAPAT was highly expressed in CD3^+^ T cells (Figure S4). We focused on macrophages owing to their predominance within atherosclerotic plaques and their essential functions across all stages of atherosclerosis, ranging from lesion initiation to regression.14, 15 Furthermore, northern blot analysis confirmed the expression of lncAPAT in human acute monocytic leukaemia cell line (THP‐1) monocytes (Figure 1D). LncAPAT expression profiling was conducted in vascular cells, including THP‐1 monocytes/macrophages, endothelial cells, smooth muscle cells, and aortic adventitial fibroblasts. The data show that lncAPAT was highly expressed in monocytes and macrophages (Figure 1E). Combined immunofluorescence and fluorescence in situ hybridisation analyses of carotid atherosclerotic plaques from patients undergoing carotid endarterectomy surgery showed that lncAPAT expression was significantly higher in macrophages than in smooth muscle cells and endothelial cells (Figure 1F).
Given that atherosclerosis is a chronic inflammatory disorder, THP‐1 monocytes were treated with several proinflammatory cytokines (lipopolysaccharide [LPS], interferon gamma [IFN‐γ], and LPS + IFN‐γ) to mimic the in vivo inflammatory microenvironment. IFN‐γ alone significantly increased lncAPAT expression by 2.0‐fold compared with the control group. Moreover, co‐stimulation with LPS and IFN‐γ further enhanced lncAPAT expression to about 2.2‐fold (Figure 1G). The expression of lncAPAT was 2.2‐fold higher in proinflammatory macrophages (M1) than in anti‐inflammatory macrophages (M2) (Figure 1H). RNA fluorescence in situ hybridisation and cytoplasmic and nuclear RNA purification assays were used to determine the subcellular localisation of lncAPAT in macrophages. The results showed that lncAPAT was distributed in both the nucleus and the cytoplasm (Figure 1I), but it predominated in the nucleus (71%; Figure 1J).
LncAPAT promotes atherosclerotic plaque formation in vivo
3.2
A phylogenetic tree of lncAPAT was constructed, and no homologous sequence of lncAPAT was detected in mice (Figure S5). Conservation of lncAPAT between humans and mice was not observed in either the NCBI (https://www.ncbi.nlm.nih.gov/) or UCSC (http://genome.ucsc.edu/) databases. To explore the effects of lncAPAT on atherosclerotic lesions in vivo, the myeloid cell‐specific lncAPAT knock‐in mouse model was established (Figure S6A). All mice were genotyped (Figure S6B), and lncAPAT expression was validated in peritoneal macrophages, PBMCs, and BMDMs by qRT‐PCR. Along with monocytes and macrophages, lncAPAT was also overexpressed in neutrophils (Figure S6C). Combined immunofluorescence and fluorescence in situ hybridisation analyses of thoracic aortic plaques from lncAPAT^flox/flox^; LyzM‐Cre^+/−^mice showed that lncAPAT expression level was comparable between neutrophils and macrophages within atherosclerotic plaques, and among the immune cells that infiltrated atherosclerotic plaques, macrophages were the predominant cell type (Figure S6D).
At baseline, lncAPAT^flox/flox^;LyzM‐Cre^+/−^ and *lncAPAT^flox/flox^
- mice showed no significant differences in serum lipid profiles, transaminase activities, and glucose levels. Peripheral blood immune cell composition, including neutrophils, lymphocytes, monocytes, eosinophils, and basophils, was also comparable between the two groups (Figure S7A,B). Histological analysis of thoracic aortas further revealed similar aortic wall thickness and collagen content in both genotypes, indicating no pre‐existing structural or compositional differences in the vasculature (Figure S7C). In addition, to exclude potential effects of low‐level basal transcription of lncAPAT on baseline phenotypes, *lncAPAT^flox/flox^
- were compared with wild‐type mice under basal conditions. No significant differences were observed between the two groups in serum laboratory parameters, immune cell composition, and thoracic aortic morphology (Figure S7).
*LncAPAT^flox/flo^ * ^x^ and *lncAPAT^flox/flo^ * ^x^ ; LyzM‐Cre^+/−^ mice were injected with rAAV‐mPCSK9 and fed a western diet for 12 weeks to induce atherosclerotic lesions (Figure 2A). Serum mPCSK9 was measured, confirming successful model establishment (Figure 2B). Serum lipids, transaminase, glucose, and body weight were measured, and no differences were observed between lncAPAT^flox/flox^;LyzM‐Cre^+/−^ and *lncAPAT^flox/flox^
- mice (Figure S8).
LncAPAT promotes the formation of atherosclerotic plaques in vivo. (A) The schema of mouse model establishment: the lncAPATflox/flox and lncAPATflox/flox;LyzM‐Cre+/− mice were injected with a recombinant adeno‐associated virus of murine PCSK9 (rAAV‐mPCSK9) and then fed with Western diet for 12 weeks to induce atherosclerosis lesions. (B) Serum levels of mPCSK9 in mice injected with saline or rAAV‐mPCSK9 (n = 6 in each group). (C) Representative images of en face analysis and quantification of atherosclerosis lesion areas in the whole aorta, aortic arch, thoracic aorta, and abdominal aorta (n = 10 in each group). Scale bar = 500 µm. (D) Representative images of haematoxylin–eosin staining and quantification of atherosclerosis lesion areas and necrotic core areas in cross sections of the thoracic aorta (n = 6 in each group). Scale bar = 100 µm. (E) Representative images of picrosirius red staining and quantification of the ratio of type III/type I collagen in atherosclerosis lesion areas of cross sections of the thoracic aorta (n = 6 in each group). Narrowed view, scale bar = 200 µm; enlarged view, scale bar = 50 µm. (F) Representative images of Oil red O staining and quantification of lipid deposition in atherosclerotic lesion areas of the aortic valve (n = 6 in each group). Scale bar = 200 µm. (G) Representative images of picrosirius red staining and quantification of the ratio of type III/type I collagen in atherosclerosis lesion areas of the aortic valve (n = 6 in each group). Narrowed view, scale bar = 200 µm; enlarged view, scale bar = 50 µm. For B, grey bars represent wild‐type mice, blue bars represent lncAPATflox/flox mice and orange bars represent lncAPATflox/flox; LyzM‐Cre+/− mice. For C through G, grey bars represent lncAPATflox/flox mice, blue bars represent lncAPATflox/flox; LyzM‐Cre+/− mice. One‐way analysis of variance (ANOVA) with Tukey's multiple‐comparisons test was used for B. Mann–Whitney U‐test was used for C through G. Data are mean ± standard error of the mean (SEM).
The analysis of atherosclerosis lesion area in en face aortae revealed that atherosclerotic lesion formation was increased by 1.7‐fold in lncAPAT^flox/flox^;LyzM‐Cre^+/−^ mice compared with *lncAPAT^flox/flox^
- mice (Figure 2C). Further analysis showed a remarkable increase in the thoracic aortic area of plaque lesions (Figure 2C), in which the absolute lesion area and necrotic core increased by 2.7‐fold and 3.6‐fold, respectively (Figure 2D), and the ratio of type III/type I collagen increased by 3.5‐fold (Figure 2E). Compared with the control group, lncAPAT did not significantly alter collagen or lipid content either in the whole plaque or in non‐necrotic core regions (Figure S9A,B). In addition, no significant differences were observed in fibrous cap thickness or the number of broken elastic laminae in the aorta between the two groups (Figure S9C,D). In the aortic root area, lipid deposition and the ratio of type III/type I collagen were increased by 1.5‐fold and 2.7‐fold, respectively (Figure 2F,G), but the lesion area did not change significantly in lncAPAT^flox/flox^;LyzM‐Cre^+/−^ mice (Figure S10). The atherosclerotic plaque area was also measured in female lncAPAT^flox/flox^;LyzM‐Cre^+/−^ mice, and the data show that female lncAPAT^flox/flox^;LyzM‐Cre^+/−^ mice had a 3.0‐fold increase in atherosclerotic lesion area in the aortic artery compared with the control group (Figure S11).
LncAPAT promotes the inflammatory response of monocytes and macrophages in mice in vivo
3.3
MMPs play a crucial role in regulating inflammation by breaking down extracellular matrix components, which allows immune cells, such as monocytes, to migrate to the site of inflammation. To explore the effects of lncAPAT on the inflammatory response in vivo, immunofluorescence staining of MMPs was conducted in plaques from lncAPAT^flox/flox^;LyzM‐Cre^+/−^ and *lncAPAT^flox/flox^
- mice. The data show that lncAPAT increased MMP9 expression by 4.3‐fold (Figure 3A) and MMP2 expression by 2.1‐fold (Figure 3B) in thoracic aortic plaques from lncAPAT^flox/flox^; LyzM‐Cre^+/−^ mice compared with *lncAPAT^flox/flox^
- mice. LncAPAT also increased the number of macrophages and smooth muscle cells by 2.7‐fold (Figure 3C) and 2.0‐fold (Figure 3D), respectively, in thoracic aortic plaques from lncAPAT^flox/flox^;LyzM‐Cre^+/−^ mice.
LncAPAT promotes the inflammatory response of monocytes in mice. (A) Representative images and quantification of immunostaining for MMP9 (green) and 4′,6‐diamidino‐2‐phenylindole (DAPI) nuclear stain (blue) in thoracic aorta plaques of lncAPATflox/flox and lncAPATflox/flox;LyzM‐Cre+/−mice (n = 6 in each group). Scale bar = 50 µm. (B) Representative images and quantification of immunostaining for MMP2 (green) and DAPI nuclear stain (blue) in thoracic aorta plaques of mice (n = 6 in each group). Scale bar = 50 µm. (C) Representative images and quantification of immunostaining for CD68 molecule (green) and DAPI nuclear stain (blue) in thoracic aorta plaques of mice (n = 6 in each group). Scale bar = 75 µm. (D) Representative images and quantification of immunostaining for αSMA (green) and DAPI nuclear stain (blue) in thoracic aorta plaques of mice (n = 6 in each group). Scale bar = 50 µm. E‐G, The mRNA expression of IL‐1β, IL‐6, monocyte chemoattractant protein‐1 (MCP‐1), tumour necrosis factor alpha (TNFα), COL1A1, COL3A1, and MMP9 in peritoneal macrophages (E), peripheral blood mononuclear cells (PBMCs) (F), and bone marrow‐derived macrophages (BMDMs) (G) from mice (n = 9 in each group). Grey bars represent lncAPATflox/flox mice, blue bars represent lncAPATflox/flox;LyzM‐Cre+/− mice. Mann–Whitney U‐test was used for A through G. Data are mean ± standard error of the mean (SEM).
Three monocyte and macrophage subpopulations (peritoneal macrophages, PBMCs, and BMDMs) isolated from *lncAPAT^flox/flox^
- and lncAPAT^flox/flox^;LyzM‐Cre^+/−^ mice were analysed to determine whether the effects of lncAPAT were subset‐specific or broadly conserved across the myeloid lineage. Given the functional heterogeneity of monocyte‐derived cells in atherosclerosis, including their roles in inflammation, lipid handling, and tissue remodelling, characterising each subset provides mechanistic insights into how lncAPAT may contribute to atherosclerosis progression.
In peritoneal macrophages, lncAPAT significantly increased the mRNA expression of interleukin (IL)‐1β, IL‐6 and MCP‐1 (Figure 3E). In PBMCs, lncAPAT significantly increased the mRNA expression of IL‐6, tumour necrosis factor alpha (TNFα), and MCP‐1 (Figure 3F). In BMDMs, lncAPAT significantly increased the mRNA expression of MCP‐1. The expression of MMP9 and collagen type III alpha 1 chain (COL3A1) was increased, while the expression of collagen type I alpha 1 chain (COL1A1), which encodes a type of stable collagen, was decreased (Figure 3G). These data indicate that lncAPAT contributes to the inflammatory response in the context of atherosclerosis progression in mice.
LncAPAT promotes the inflammatory responses of monocytes, macrophages, endothelial cells, and smooth muscle cells in vitro
3.4
To investigate the effects of lncAPAT on the inflammatory responses of monocytes and macrophages, THP‐1 cell lines stably overexpressing lncAPAT were established by lentiviral infection. In THP‐1 monocytes, a 2.1‐fold increase in the adhesion ability to endothelial cells was observed upon lncAPAT overexpression in the adhesion assays. The adhesion ability of monocytes was significantly inhibited by lncAPAT knockdown (Figure 4A). Furthermore, in THP‐1 monocytes, lncAPAT overexpression significantly increased the expression of the cytokines TNFα and intercellular adhesion molecule 1 (ICAM‐1), and their expression was decreased after lncAPAT knockdown (Figure 4B). In M1 macrophages derived from THP‐1 cells, lncAPAT increased the mRNA expression of MCP‐1 and TNFα, whereas lncAPAT knockdown decreased their expression (Figure 4C). These results indicate that lncAPAT promotes the inflammatory response of monocytes and macrophages.
LncAPAT promotes the inflammatory response of macrophages in vitro. (A) Representative images and quantification of THP‐1 monocytes adhering to endothelial cells (n = 6 in each group). Scale bar = 200 µm. (B) The mRNA expression of tumour necrosis factor alpha (TNFα) and ICAM‐1 in THP‐1 monocytes with overexpression or knockdown of lncAPAT (n = 3 in each group). (C) The mRNA expression of monocyte chemoattractant protein‐1 (MCP‐1) and TNFα in macrophages derived from THP‐1 monocytes with overexpression or knockdown of lncAPAT (n = 3 in each group). Grey bars represent the control group, blue bars represent the experimental group. The two‐tailed unpaired Student t‐test was used for A through C. Data are mean ± standard error of the mean (SEM).
Given the critical roles of endothelial cells and smooth muscle cells in atherosclerosis progression, the function of lncAPAT in human umbilical vein endothelial cells (HUVECs) and human aortic smooth muscle cells (HASMCs) was investigated. In HUVECs, lncAPAT overexpression significantly increased the expression of the proinflammatory cytokines MCP‐1, IL‐1β, IL‐6, and TNFα, whereas lncAPAT knockdown decreased their expression (Figure S12A,B). Moreover, adhesion assays revealed that lncAPAT overexpression enhanced the adhesion ability of monocytes to endothelial cells by 3.0‐fold, which was inhibited by 49% after lncAPAT knockdown (Figure S12C). In HASMCs, lncAPAT overexpression significantly increased the expression of the proinflammatory cytokine TNFα and the phenotypic modulation‐associated cytokine SM22α, whereas lncAPAT knockdown decreased their expression (Figure S13A,B). Nevertheless, lncAPAT had no effect on the proliferation and migration of HUVECs and HASMCs (Figures S12D,E and S13C,D). These results suggest that lncAPAT may participate in atherosclerosis by modulating the inflammatory responses of various cell types, including macrophages, endothelial cells, and smooth muscle cells.
LncAPAT promotes cholesterol accumulation and inhibits cholesterol efflux in macrophages in vitro and in vivo
3.5
Under basal conditions, lncAPAT did not affect macrophage cholesterol accumulation. Upon exogenous ox‐LDL stimulation, lncAPAT overexpression increased cholesterol accumulation by 98%, which was inhibited by 72% after lncAPAT knockdown (Figure 5A). LncAPAT increased the expression of the lipid phagocytosis‐related genes CD36 by 2.5‐fold and the expression of scavenger receptor A1 by 5.2‐fold (Figure 5B), while the expression of cholesterol efflux‐related genes, including the gene encoding scavenger receptor B1 (SR‐B1) and ATP‐binding cassette subfamily G member 1 (ABCG1), was inhibited by 38% and 36%, respectively (Figure 5C). Correspondingly, the expression of SR‐B1 and ABCG1 mRNA (Figure 5D) and the cholesterol efflux ratio (Figure 5E) were increased after lncAPAT knockdown. In BMDMs isolated from lncAPAT^flox/flox^;LyzM‐Cre^+/−^ mice, lncAPAT knock‐in increased cholesterol accumulation in macrophages by 3.0‐fold (Figure 5F) and reduced the cholesterol efflux ratio of macrophages by 35% compared with that observed in *lncAPAT^flox/flox^
- mice (Figure 5G).
LncAPAT promotes cholesterol accumulation and inhibits cholesterol reversal of macrophages in vitro and in vivo. (A) Representative images and quantification of cholesterol accumulation in macrophages derived from THP‐1 monocytes incubated with or without oxidised low‐density lipoprotein, as detected by Oil red O staining (n = 6 in each group). Scale bar = 50 µm. (B) The mRNA expression of lipid phagocytosis‐related genes CD36 molecule and SR‐A1 in macrophages derived from THP‐1 monocytes with overexpression of lncAPAT by lentivirus (n = 3 in each group). (C, D) The mRNA expression of cholesterol reversal‐related genes SR‐B1 and ABCG1 in macrophages derived from THP‐1 monocytes with overexpression of lncAPAT by lentivirus (n = 3 in each group) (C) or knockdown of lncAPAT by smart silencer (n = 3 in each group) (D). (E) The quantification of cholesterol reversal in macrophages derived from THP‐1 monocytes with knockdown of lncAPAT by smart silencer (n = 6 in each group). (F) Representative images and quantification of cholesterol accumulation in bone marrow‐derived macrophages (BMDMs) isolated from lncAPATflox/flox and lncAPATflox/flox;LyzM‐Cre+/− mice incubated with oxidised low‐density lipoprotein, as detected by Oil red O staining (n = 6 in each group). Scale bar = 50 µm. (G) The quantification of cholesterol efflux in BMDMs isolated from lncAPATflox/flox and lncAPATflox/flox;LyzM‐Cre+/− mice by cholesterol efflux assay (n = 6 in each group). Grey bars represent the control group, blue bars represent the experimental group. The two‐tailed unpaired Student t‐test was used for A through E. Mann–Whitney U‐test was used for F and G. Data are mean ± standard error of the mean (SEM).
LncAPAT binds with the promoter region of RPL22
3.6
To explore the molecular mechanism by which lncAPAT regulates macrophage inflammation and atherosclerotic plaque instability, potential targets of lncAPAT were identified by the ChIRP assay and sequencing. In the ChIRP assay, the RNA retrieved by lncAPAT probes was quantified by qRT‐PCR (Figures 6A and S14A). ChIRP‐Seq was performed twice to identify the potential targets of lncAPAT. Approximately 30 000 and 23 000 peaks were enriched from the macrophage genome. The intersection of the peaks from two ChIRP sequences revealed 563 genes. Five genes (AK8, SNX16, PTBP1, RNF207, and RPL22) had promoters that were directly bound with lncAPAT after filtering out pseudogenes, non‐coding RNAs, and unannotated genes. The annotations of AK8, SNX16, PTBP1, RNF207, and RPL22 are provided in Table S4. The direct binding of lncAPAT with the promoter of RPL22 from the ChIRP‐Seq analysis is shown in Figure 6B. We quantified the mRNA levels of these five genes in peripheral blood samples from the indicated cohort. Compared with control subjects, RPL22 expression was significantly reduced by 65% in CAD and 92% in STEMI patients, but showed no marked difference between the two patient groups (Figure 6C). Conversely, the expression of AK8, SNX16, PTBP1, and RNF207 remained unchanged across the control, CAD, and STEMI groups (Figure S15A–D). Furthermore, Spearman analysis revealed a significant negative correlation between lncAPAT and RPL22 mRNA levels in our cohorts (r = −.4, p = .0002; Figure S15E). RPL22 is a component of the 60S ribosomal subunit assembled in the nucleolus, and the promoter region of RPL22 gene contains four putative NF‐κB binding domains, which indicates its potential role in inflammation and related diseases.16 Das et al. reported that RPL22 protein directly interacts with the 5′‐untranslated region of MCP‐1 mRNA and thereby promotes its decay, a process considered to be critical for inflammation.17 In the present study, together with the results of the ChIRP assay and sequencing data, RPL22 was selected as the potential target of lncAPAT for the subsequent studies, and MCP‐1 was selected as the putative downstream target of RPL22.
LncAPAT regulates the inflammatory response of macrophages by targeting RPL22. (A) Relative lncAPAT retrieval in THP‐1‐derived macrophages by chromatin isolation by RNA purification (ChIRP) assay (n = 2 in each group). (B) ChIRP‐Seq analysis of lncAPAT binding at the RPL22 gene locus in the DNA input and fraction sample. (C) The mRNA expression of RPL22 was determined by the quantitative real‐time polymerase chain reaction (qRT‐PCR) method in the peripheral blood of coronary artery disease (CAD) patients with coronary computed tomography angiography (CCTA) examination (n = 22), acute ST‐elevation myocardial infarction (STEMI) patients with optical coherence tomography examination (n = 22), and control subjects (n = 37). (D) Relative lncAPAT retrieval by ChIRP assay and the expression of GAPDH and RPL22 fracted with lncAPAT probe from bone marrow‐derived macrophages (BMDMs) of lncAPATflox/flox;LyzM‐Cre+/− mice (n = 2 in each group). (E) The mRNA expression of IL‐1β, IL‐6, and tumour necrosis factor alpha (TNFα) in macrophages derived from THP‐1 monocytes with knockdown of RPL22 by smart silencer (n = 3 in each group). (F) The mRNA and protein levels of RPL22 and monocyte chemoattractant protein‐1 (MCP‐1) in THP‐1 monocytes with overexpression of lncAPAT by lentivirus (n = 3 in each group). (G) The mRNA and protein levels of RPL22 and MCP‐1 in THP‐1 monocytes with knocking down of lncAPAT by smart silencer (n = 3 in each group). (H) The mRNA and protein levels of RPL22 and MCP‐1 in THP‐1 monocytes with knocking down of RPL22 alone or knocking down of RPL22 and lncAPAT together to verify the reverse effects of RPL22 on inflammation induced by lncAPAT (n = 3 in each group). (I) The mRNA and protein levels of RPL22 and MCP‐1 in BMDMs from lncAPATflox/flox and lncAPATflox/flox;LyzM‐Cre+/− mice (n = 3 in each group). (J) The mRNA and protein levels of RPL22 and MCP‐1 in BMDMs from lncAPATflox/flox;LyzM‐Cre+/− mice with further knocking down of RPL22 alone or knocking down of RPL22 and lncAPAT together to clarify the reverse effects of RPL22 on inflammation induced by lncAPAT (n = 3 in each group). (K) Relative enrichment of MCP‐1 in BMDMs by RNA immunoprecipitation assay. (L) Representative images and quantification of immunostaining for RPL22 (red), MCP‐1 (green), CD68 molecule (white), and 4′,6‐diamidino‐2‐phenylindole (DAPI) nuclear stain (blue) in thoracic aorta plaques of lncAPATflox/flox and lncAPATflox/flox;LyzM‐Cre+/− mice (n = 5 in each group). Scale bar = 20 µm. (M) The mRNA expression of MCP‐1 in CAD patients with CCTA examination (n = 22), acute ST‐elevation myocardial infarction (STEMI) patients with optical coherence tomography examination (n = 22), compared with control subjects (n = 37). For A and D through L, grey bars represent the control group, blue or orange bars represent the experimental group. For C and M, grey bars represent control subjects, blue bars represent CAD patients and orange bars represent STEMI patients. Kruskal–Wallis test followed by Dunn’s multiple‐comparison tests was used for C and M. The two‐tailed unpaired Student t‐test was used for E, F, G, I, and K. One‐way analysis of variance (ANOVA) with Tukey’s multiple‐comparisons test was used for H and J. Mann–Whitney U‐test was used for L. Data are mean ± standard error of the mean (SEM).
To verify the interaction between RPL22 and lncAPAT, we conducted the ChIRP assay followed by qRT‐PCR of BMDMs from lncAPAT^flox/flox^; LyzM‐Cre^+/−^ mice. The results showed that the content of lncAPAT enriched by the lncAPAT probe was 27.9‐fold higher than in the control group. The content of RPL22 pulled down by the lncAPAT probe was 6.5‐fold higher than the internal reference (GAPDH, encoding glyceraldehyde‐3‐phosphate dehydrogenase; Figures 6D and S14B,C), suggesting the direct binding of lncAPAT to RPL22. Furthermore, we knocked down the mRNA expression of RPL22 in THP‐1‐derived macrophages using a smart silencer to assess its direct role in regulating the macrophage inflammatory response. RPL22 inhibition significantly increased the mRNA expression of inflammatory cytokines (IL‐1β by 1.4‐fold, IL‐6 by 2.1‐fold, and TNFα by 1.7‐fold), indicating that RPL22 knockdown alone induced a proinflammatory response similar to that observed with lncAPAT overexpression (Figure 6E).
Experiments on macrophages derived from THP‐1 monocytes showed that lncAPAT overexpression significantly inhibited the expression of RPL22 and subsequently increased the expression of the inflammatory cytokine MCP‐1, both at the mRNA and protein levels (Figure 6F). In contrast, after lncAPAT knockdown from macrophages, the mRNA and protein expression of RPL22 was significantly increased by 1.4‐fold and 1.5‐fold, respectively, and the mRNA and protein expression of MCP‐1 was inhibited by 63% and 46%, respectively (Figure 6G).
To further investigate whether MCP‐1 is regulated by RPL22, we silenced RPL22 mRNA expression in THP‐1‐derived macrophages. RPL22 silencing led to a 1.6‐fold and 3.7‐fold increase in MCP‐1 mRNA and protein expression, respectively (Figure 6H). The upregulation of MCP‐1 mRNA and protein expression induced by RPL22 silencing was blocked after knockdown of both RPL22 and lncAPAT in THP‐1‐derived macrophages (Figure 6H), indicating that lncAPAT regulates the expression of the inflammatory factor MCP‐1 through RPL22. To verify the interaction between RPL22 and lncAPAT, we evaluated the expression of RPL22 and MCP‐1 in BMDMs from lncAPAT^flox/flox^; LyzM‐Cre^+/−^ mice. Knock‐in of lncAPAT significantly inhibited RPL22 mRNA and protein expression by 51% and 33%, respectively, and increased the mRNA and protein expression of MCP‐1 by 3.2‐fold and 3.4‐fold, respectively (Figure 6I). In addition, RPL22 knockdown in BMDMs from lncAPAT^flox/flox^;LyzM‐Cre^+/−^ mice significantly increased MCP‐1 mRNA and protein expression by 1.9‐fold and 1.8‐fold, respectively (Figure 6J). Knockdown of both RPL22 and lncAPAT blocked the upregulation of MCP‐1 in BMDMs from lncAPAT^flox/flox^; LyzM‐Cre^+/−^ mice (Figure 6J). RNA immunoprecipitation experiments were conducted using BMDMs from lncAPAT^flox/flox^;LyzM‐Cre^+/−^ mice to explore the interaction between RPL22 and MCP‐1. The content of MCP‐1 was enriched by the RPL22 antibody (24‐fold higher than the negative control group), suggesting direct binding between the RPL22 protein and MCP‐1 mRNA (Figures 6K and S16). Immunofluorescence analysis revealed markedly reduced expression of RPL22, concomitantly with elevated MCP‐1 levels, in macrophages within the aortic plaques of lncAPAT^flox/flox^;LyzM‐Cre^+/−^ mice compared to *lncAPAT^flox/flox^
- mice (Figure 6L). Consistently, in female mice with aortic plaques, lncAPAT^flox/flox^;LyzM‐Cre^+/−^ mice showed decreased RPL22 and increased MCP‐1 expression (Figure S17). These findings indicate that lncAPAT modulates RPL22 and MCP‐1 in vivo. In the peripheral blood of CAD and STEMI patients, the mRNA expression of MCP‐1 was 7.8‐fold and 9.2‐fold higher than that in control individuals, respectively (Figure 6M).
To determine whether the lncAPAT–RPL22 axis regulates other inflammatory mediators beyond MCP‐1, we analysed IL‐6, IL‐1β, TNFα, MMP‐2, and MMP‐9 expression in BMDMs from lncAPAT^flox/flox^;LyzM‐Cre^+/−^ mice under the conditions of Figure 6J. RPL22 knockdown significantly upregulated the mRNA expression of IL‐1β and TNFα, and moderately increased IL‐6. However, concurrent knockdown of lncAPAT failed to rescue these expression changes (Figure S18). These data suggest that the lncAPAT–RPL22 axis specifically and directly regulates MCP‐1, without broadly altering the inflammatory cytokine landscape. To further explore whether lncAPAT regulates other chemokines in macrophages, we assessed the mRNA levels of CXCL9, CXCL10, CXCL11, CCL3, and CXCL4 in THP‐1–derived macrophages after lncAPAT overexpression or knockdown. None of these chemokines exhibited significant changes, supporting a relatively specific role of lncAPAT in modulating MCP‐1. (Figure S19).
Collectively, these data indicate that lncAPAT promoted the inflammatory response of macrophages by inhibiting the transcriptional activity of RPL22 and selectively upregulating MCP‐1, thereby contributing to atherosclerotic plaque instability.
DISCUSSION
4
Macrophages play a pivotal role in the development of atherosclerotic lesions. We identified a novel lncRNA, namely, lncAPAT, which was highly expressed in the peripheral blood of patients with unstable coronary artery atherosclerotic plaques. In animal models of atherosclerosis, myeloid cell‐specific overexpression of lncAPAT enhanced the atherosclerotic plaque lesion area, increased the ratio of type III/type I collagen, and promoted the expression of MMP9 and MMP2 in aortic plaques. In PBMCs isolated from lncAPAT^flox/flox^;LyzM‐Cre^+/−^ mice, lncAPAT increased IL‐6 and TNFα inflammatory cytokine expression. LncAPAT significantly promoted monocyte adhesion to the endothelium in vitro. Moreover, lncAPAT directly targeted the promoter region of RPL22, increased MCP‐1 expression, and promoted the inflammatory response of macrophages by inhibiting the transcriptional activity of RPL22. RPL22 expression in the peripheral blood of patients with mixed plaques was lower than in control individuals without coronary artery plaques. These findings indicate a novel molecular mechanism underpinning atherosclerotic plaque instability, in which lncAPAT regulates the inflammatory response of macrophages by targeting RPL22.
Atherosclerosis is characterised by vascular inflammatory lesions that exist in the coronary arteries and large blood vessels, such as the aorta (including the aortic sinus, aortic arch, thoracic aorta, and abdominal aorta). Plaque lesions at different vascular sites exhibit localisation‐dependent responses during atherosclerosis progression. Czamara et al. used fibreoptic Raman spectroscopy and Raman microscopy to explore changes in the aortic wall and adjacent perivascular adipose tissue in a murine model of atherosclerosis (*Apo^−/−^/Ldlr^−/−^
- mice), revealing that the abdominal and thoracic segments of the aorta exhibit distinct chemical compositions and patterns of lipid deposition in the intimal–medial layers.18 Furthermore, Benvenuti et al. found that atherosclerosis progression was more rapid in the abdominal aorta than in the thoracic aorta.19 In the present study, we found that lncAPAT increased the size of plaque lesions at the en face aorta in the murine model of atherosclerosis induced by mPCSK9 (lncAPAT^flox/flox^;LyzM‐Cre^+/−^ mice), and the difference was more significant in the thoracic aorta than in the aortic arch and abdominal aorta. In the thoracic aorta, lncAPAT increased the lesion area and the ratio of type III/type I collagen, but the total collagen content and lipid deposition were not affected by lncAPAT. In the aortic sinus, lncAPAT promoted lipid deposition and increased the ratio of type III/type I collagen, but the lesion area was unchanged. One potential explanation could be that the influence of lncAPAT in atherosclerosis progression may vary depending on the aortic artery site. Type I collagen is considered to be a mature and mechanically strong component of the fibrous cap, whereas type III collagen is relatively immature and weaker. A higher type III/type I ratio indicates a softer, more disorganised extracellular matrix and thus reduced plaque stability.20, 21 These findings support that lncAPAT overexpression promotes a collagen subtype shift towards an unstable plaque composition, contributing to decreased plaque stability.
Atherosclerosis is a chronic inflammatory disorder characterised by the presence of immune cells, predominantly those that produce proinflammatory cytokines, in lesions. This continuous inflammatory response leads to endothelial cell activation, smooth muscle cell proliferation, lesion progression, and ultimately vulnerable plaque destabilization by matrix degradation of the fibrous cap. We observed that lncAPAT overexpression increased the expression of the inflammatory factor TNFα in THP‐1‐derived macrophages, while lncAPAT knockdown decreased TNFα expression. Moreover, in myeloid cell‐specific lncAPAT knock‐in mice (lncAPAT^flox/flox^;LyzM‐Cre^+/−^ mice), lncAPAT promoted TNFα expression in PBMCs. TNFα modulates leukocyte activation and maturation, cytokine and chemokine release, and the generation of reactive oxygen species and nitrogen intermediates in atherosclerosis.22 The present study showed that myeloid cell‐specific expression of lncAPAT promoted the expression of MMP9 in aortic plaques and in monocytes isolated from mice. The expression of COL1A1 was also decreased. TNFα‐induced upregulation of MMPs and downregulation of collagen further destabilised the plaque lesions.
In this study, lncAPAT overexpression in THP‐1 monocytes significantly increased the expression of the cytokine ICAM‐1. While it is well established that endothelial ICAM‐1 binds monocyte lymphocyte function‐associated antigen‐1 to regulate adhesion and activation, it has also been reported that monocytes express ICAM‐1 in an inducible manner and contribute to adhesion dynamics and inflammatory signalling. Linden et al. found that isolated human monocytes display very low ICAM‐1 at baseline, but IFN‐γ treatment can double its expression, indicating that monocyte ICAM‐1 may be dynamically regulated during the process of monocyte activation and transmigration.23 These results indicate that lncAPAT is crucial for the monocyte and macrophage inflammatory response, and that it promotes atherosclerosis progression.
We also observed that lncAPAT had a proinflammatory effect in HUVECs and HASMCs. Overexpression of lncAPAT increased the expression of proinflammatory cytokines, including MCP‐1, IL‐1β, IL‐6, and TNFα, in HUVECs, as well as TNFα in HASMCs. Macrophages play a critical role in atherosclerosis pathogenesis, driving plaque progression through several mechanisms, such as inflammation, lipid uptake (foam cell formation), and necrotic core development.14, 15 Importantly, lncAPAT exhibited the highest expression in macrophages compared with other vascular cell types, such as endothelial cells, smooth muscle cells, and aortic adventitial fibroblasts. Therefore, we prioritised investigating the function of lncAPAT in macrophages to elucidate its mechanistic role in atherosclerosis development and progression.
The findings showed that lncAPAT overexpression promoted the expression of inflammatory genes in peritoneal macrophages and PBMCs. In BMDMs, lncAPAT overexpression affected the expression of MMPs and collagen. These divergent transcriptional responses may be attributed to differences in the cellular origins and maturation states.24 Circulating monocytes, which originate from the bone marrow or splenic haematopoietic stem and progenitor cells, readily differentiate into proinflammatory M1 macrophages and are highly responsive to inflammatory stimuli.25 It is possible that systemic or local inflammatory responses may have been triggered by lncAPAT overexpression, leading to the upregulation of inflammatory cytokines. Peritoneal macrophages, conversely, are primarily tissue‐resident cells derived from embryonic progenitors. They exhibit high immune responsiveness and strong adaptation to their tissue microenvironment.26 In contrast, BMDMs differentiate in vitro under macrophage colony‐stimulating factor stimulation, which tends to skew them towards a repair‐associated or regulatory phenotype. This could limit their inflammatory response and account for the distinct transcriptional profile observed upon lncAPAT overexpression. These findings collectively suggest that macrophages from different anatomical regions and developmental contexts are functionally specialised. For instance, PBMCs and peritoneal macrophages are more inflammation‐prone, whereas BMDMs are more involved in matrix remodelling. Accordingly, lncAPAT may enhance pre‐existing, cell type‐specific gene programs rather than exerting uniform effects across all macrophage populations. Although some discrepancies were observed, the data collectively support that lncAPAT facilitates inflammatory responses, as evidenced by the consistently increased expression of MCP‐1 across all three macrophage models. Given that MCP‐1 was a key target in the present study, this finding provides strong support for the proinflammatory role of lncAPAT. The consistent upregulation of MCP‐1 highlights its role as a robust downstream effector of lncAPAT.
Traditionally, atherosclerosis begins with lipoprotein accumulation in the subendothelium at sites of hemodynamic disturbance.27, 28 The present study found that lncAPAT overexpression promoted cholesterol accumulation, while lncAPAT knockdown inhibited cholesterol accumulation and increased the cholesterol efflux ratio in THP‐1‐derived macrophages. Consistently, lncAPAT increased cholesterol accumulation and decreased the cholesterol efflux ratio in monocytes isolated from lncAPAT^flox/flox^;LyzM‐Cre^+/−^ mice. These results indicate that lncAPAT‐induced cholesterol accumulation in macrophages may be an important factor contributing to the inflammatory response and plaque vulnerability.
RPL22 is an RNA‐binding protein component of the 60S ribosomal subunit that plays an indispensable role in global protein synthesis. Increasing evidence underscores the role of ribosomal proteins in regulating essential cellular processes. RPL22 can induce defects in ribosome synthesis, subsequently leading to distinct alternative splicing patterns that activate p53‐dependent transcriptional responses and arrest cell proliferation under ribosomal or nucleolar stress.29 A recent study showed that RPL22 accumulates within the nucleolus of senescent human mesenchymal progenitor cells and triggers a cascade of heterochromatin decompaction, playing a newly recognised role in the aging process.30 In studies of inflammation, a previous study observed a direct interaction between MCP‐1 mRNA and RPL22 protein using crosslinking immunoprecipitation experiments. Moreover, the ultraviolet crosslinking assay clarified the essential role of the initial 20 bp segment within the 5′‐untranslated region of MCP‐1 mRNA for RPL22 binding. Co‐immunoprecipitation with anti‐RPL22 antibody and liquid chromatography–mass spectrometry analysis confirmed the physical interaction between RPL22 and up‐frameshift protein 1 in LPS‐treated THP‐1‐derived macrophages and MCF7 cells.17 Up‐frameshift protein 1 plays a vital role in mRNA decay pathways, where it is ready to react in the event of an incorrect translation mechanism.31 The complex of RPL22 and up‐frameshift protein 1 has been shown to be responsible for MCP‐1 mRNA degradation.17 Our RNA immunoprecipitation assays confirmed the direct interaction between RPL22 protein and MCP‐1 mRNA in BMDMs, and we found that the mRNA and protein expression of MCP‐1 was increased in macrophages after the inhibition of RPL22 transcript activity by lncAPAT.
This study has some limitations. First, although our study provides initial evidence that lncAPAT contributes to coronary plaque destabilisation, the relatively limited sample size and single‐centre design render these findings exploratory. Large multicentre studies are warranted to validate and extend our observations. Second, we found that lncAPAT was more highly expressed in CD3^+^ T cells than in CD14⁺ monocytes and macrophages from the peripheral blood of control individuals. In the present study, we focused on macrophages because they are the predominant immune cell population within atherosclerotic plaques and play dominant roles at all stages of atherosclerosis, including lesion initiation, foam cell formation, necrotic core expansion, plaque rupture or erosion, lesion regression, and inflammation.14, 15 Nonetheless, lymphocytes, particularly T lymphocytes, also contribute to inflammation and plaque progression through cytokine production and interactions with macrophages.32 Future studies are necessary to delineate the functional effects of lncAPAT in T cells and other immune subsets. Third, we used the LyzM‐Cre system to generate a monocyte/macrophage‐lncAPAT knock‐in mouse model. Because LyzM‐Cre is commonly used to target myeloid cells, in addition to monocytes and macrophages, it also induces lncAPAT knock‐in in neutrophils owing to the expression of lysozyme in these cells. Therefore, the potential contribution of neutrophils to the observed phenotype cannot be excluded. Future studies using more specific Cre drivers or alternate genetic models that can differentiate between monocytes and neutrophils would provide a clearer understanding of the monocyte‐ and macrophage‐specific roles of lncAPAT. Fourth, the myeloid cell‐specific lncAPAT knock‐in mice model was generated via a CAG‐loxP‐Stop‐loxP cassette containing three tandem SV40 polyadenylation sequences (3 × SV40 pA), which may not completely abolish transcription in Cre‐negative controls and could allow low‐level basal lncAPAT expression. However, we did not detect differences between *lncAPAT^flox/flox^
- and wild‐type mice at baseline in serum biochemical parameters, immune cell composition, or vascular phenotype, indicating that the potential low‐level basal lncAPAT expression in Cre‐negative controls could not remarkably affect experimental results in the present study. Fifth, our current study employed a constitutive lncAPAT knock‐in mouse model, which did not result in detectable baseline phenotypic alterations. For future investigations aiming to achieve precise spatiotemporal control of lncAPAT expression, conditional systems such as Cre‐dependent or inducible models could be considered. Finally, although we showed that lncAPAT interacted with RPL22 to enhance MCP‐1 transcription and promote inflammation in vitro, animal models with myeloid cell‐specific overexpression of lncAPAT and knock‐in of RPL22 would be useful to verify the regulation of RPL22 and MCP‐1 by lncAPAT in vivo.
Cell‐free nucleic acids, such as circulating lncRNAs, have been proposed as potential biomarkers for the diagnosis and prognosis of cardiovascular disease.33 In the present study, lncAPAT was shown to be highly expressed in the peripheral blood of patients with CAD with mixed plaques compared with control individuals, suggesting that lncAPAT reflects underlying vascular inflammation and plaque activity. The enhanced expression of lncAPAT in the peripheral blood makes it an attractive candidate biomarker for clinical screening and cardiovascular disease monitoring. Furthermore, this study showed that lncAPAT contributes to atherosclerotic plaque instability by targeting the RPL22/MCP‐1 axis, making it a potential therapeutic target for atherosclerotic plaque progression. For example, targeting lncAPAT with antisense oligonucleotides or RNA interference technologies could potentially attenuate vascular inflammation and plaque instability. However, clinical trials are required to verify its role in atherosclerosis.
CONCLUSIONS
5
In this study, we identified a new lncRNA, lncAPAT, which was highly expressed in the peripheral blood of patients with unstable coronary artery plaques. LncAPAT promoted the macrophage inflammatory response and atherosclerotic plaque progression by inhibiting the transcriptional activity of RPL22, indicating its potential as a therapeutic target for atherosclerosis (Figure 7). The identification of lncAPAT as a facilitator of macrophage inflammation expands our mechanistic insights into the role of lncRNAs in atherosclerotic plaque instability.
Schema depicting lncAPAT binding to the RPL22 promoter to repress RPL22 transcription, thereby enhancing MCP‐1 expression and promoting plaque instability.
AUTHOR CONTRIBUTIONS
Weili Zhang contributed to the study conception and design, and supervised the study. Rongxia Li, Qiyue Zhang, Yu Chen, Shuting Wang, Shuang Han, Adalaiti Kamili, Yixuan Zhong, and Shujun Yang performed the experiments and analysed the data. Rongxia Li and Qiyue Zhang wrote the manuscript. All the authors read and approved the final manuscript submitted.
CONFLICT OF INTEREST STATEMENT
The authors declare no conflicts of interest.
Supporting information
Supporting Information
The reference list from the paper itself. Each links out to its DOI / PubMed record.
- 1Moore KJ , Tabas I . Macrophages in the pathogenesis of atherosclerosis. Cell. 2011;145(3):341‐355.21529710 10.1016/j.cell.2011.04.005PMC 3111065 · doi ↗ · pubmed ↗
- 2Tabas I , Lichtman AH . Monocyte‐macrophages and T cells in atherosclerosis. Immunity. 2017;47(4):621‐634.29045897 10.1016/j.immuni.2017.09.008PMC 5747297 · doi ↗ · pubmed ↗
- 3Khyzha N , Alizada A , Wilson MD , Fish JE . Epigenetics of atherosclerosis: emerging mechanisms and methods. Trends Mol Med. 2017;23(4):332‐347.28291707 10.1016/j.molmed.2017.02.004 · doi ↗ · pubmed ↗
- 4Li S , He RC , Wu SG , et al. Lnc RNA PSMB 8‐AS 1 instigates vascular inflammation to aggravate atherosclerosis. Circ Res. 2024;134(1):60‐80.38084631 10.1161/CIRCRESAHA.122.322360 · doi ↗ · pubmed ↗
- 5Sun C , Fu Y , Gu X , et al. Macrophage‐enriched lnc RNA RAPIA: a novel therapeutic target for atherosclerosis. Arterioscler Thromb Vasc Biol. 2020;40(6):1464‐1478.32268789 10.1161/ATVBAHA.119.313749 · doi ↗ · pubmed ↗
- 6Zhang W , Zhao J , Deng L , et al. INKILN is a novel long noncoding RNA promoting vascular smooth muscle inflammation via scaffolding MKL 1 and USP 10. Circulation. 2023;148(1):47‐67.37199168 10.1161/CIRCULATIONAHA.123.063760 PMC 10330325 · doi ↗ · pubmed ↗
- 7Achenbach S , Moselewski F , Ropers D , et al. Detection of calcified and noncalcified coronary atherosclerotic plaque by contrast‐enhanced, submillimeter multidetector spiral computed tomography: a segment‐based comparison with intravascular ultrasound. Circulation. 2004;109(1):14‐17.14691045 10.1161/01.CIR.0000111517.69230.0F · doi ↗ · pubmed ↗
- 8Hou ZH , Lu B , Gao Y , et al. Prognostic value of coronary CT angiography and calcium score for major adverse cardiac events in outpatients. JACC Cardiovasc Imaging. 2012;5(10):990‐999.23058065 10.1016/j.jcmg.2012.06.006 · doi ↗ · pubmed ↗