Metabolic engineering enables Escherichia coli to grow on 1,3-propanediol
Nga Yu Poon, Anthony J. Sinskey, Kang Zhou

TL;DR
Scientists engineered E. coli to grow on 1,3-propanediol, a chemical from plastics, which could help recycle plastic waste.
Contribution
A new E. coli strain (PA16) was developed to efficiently consume 1,3-propanediol using metabolic pathway extensions and gene overexpression.
Findings
PA16 reached an OD600 of 7 by consuming 6.5 g/L of 1,3-PDO in 72 hours.
Overexpression of EcTdh and EcKbl genes improved cell density by 5-fold.
The growth medium was simplified to include only 0.1 g/L threonine and 10 g/L 1,3-PDO.
Abstract
1,3-propanediol (1,3-PDO) is used to synthesize plastics used in many consumer products. As the demand and production of such plastics increase, a technology will be needed to utilize 1,3-PDO released from the plastics after their disposal. In our previous study, we developed the strain (BA07Δ) that could use malonate semialdehyde (MSA, an important intermediate in the 1,3-PDO assimilation pathway) as the major carbon source. Here, we present construction of PA16, a strain which could grow to an OD600 of 7 by consuming 6.5 g/L of 1,3-PDO within 72 h in M9-based medium supplemented with 1 g/L of complete supplement mixture (CSM). This was achieved by adaptive laboratory evolution (ALE) after extending the pathway in BA07Δ through the introduction of a 1,3-propanediol dehydrogenase from Klebsiella pneumoniae (KpDhaT), an aldehyde dehydrogenase from E. coli (EcPuuC) and a…
Genes, proteins, chemicals, diseases, species, mutations and cell lines named across the full text — each resolved to its canonical identifier and authoritative record.
Click any figure to enlarge with its caption.
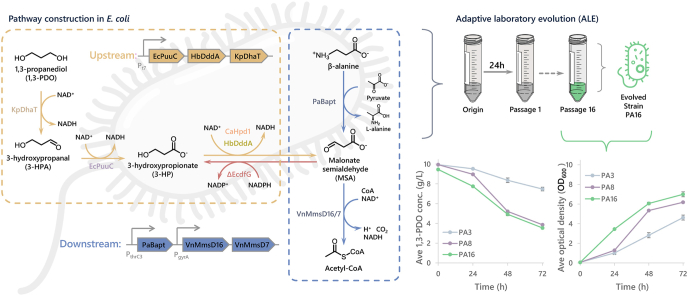 Figure 1
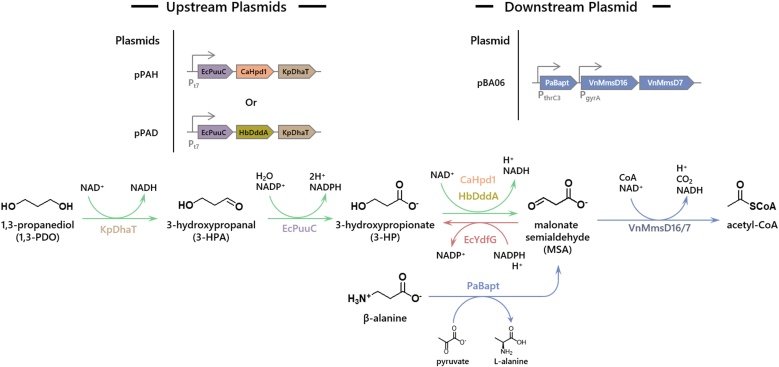 Figure 2
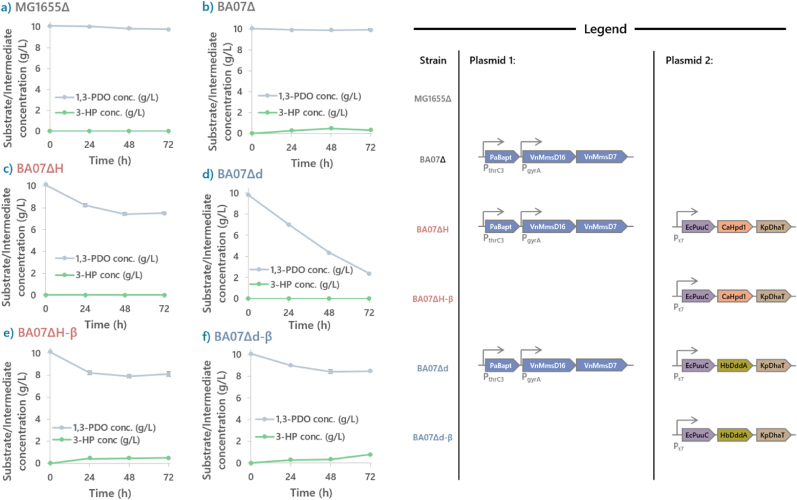 Figure 3
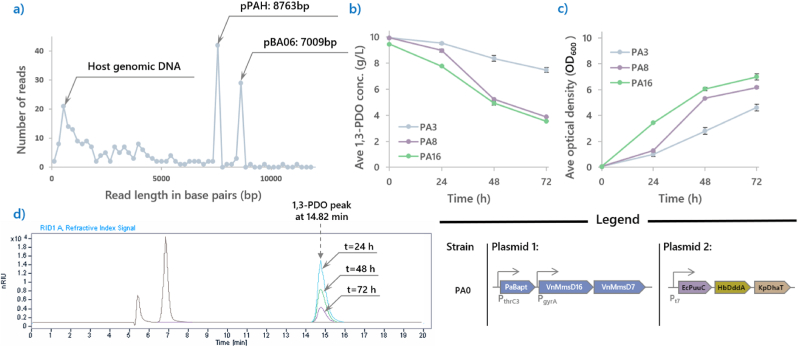 Figure 4
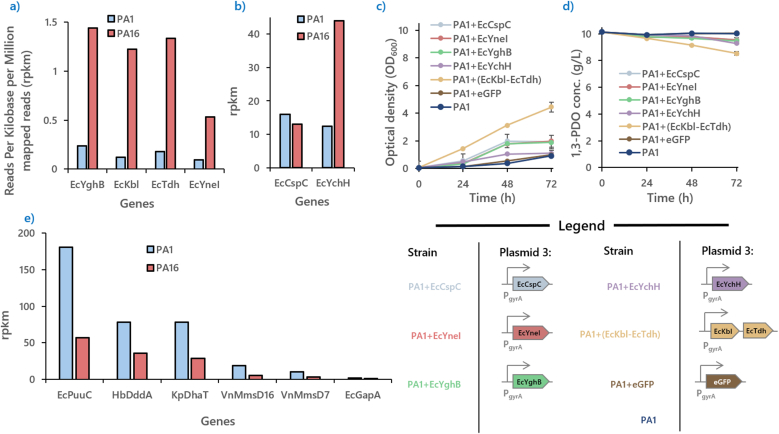 Figure 5
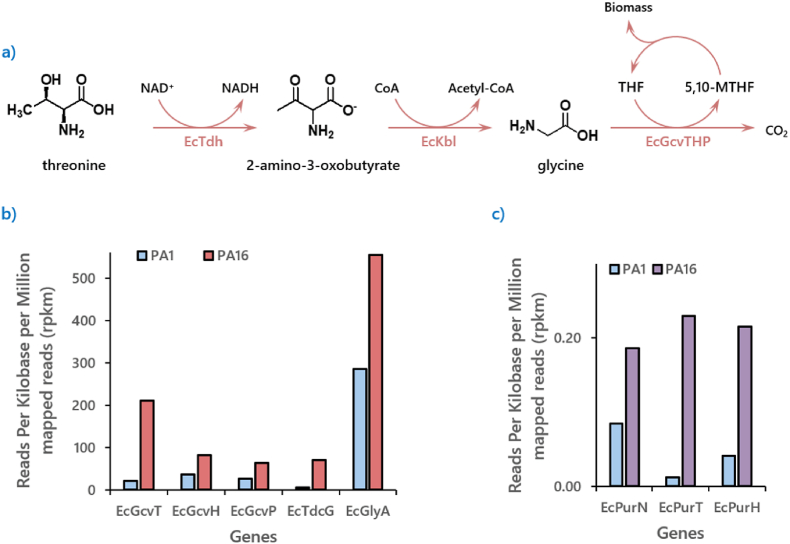 Figure 6
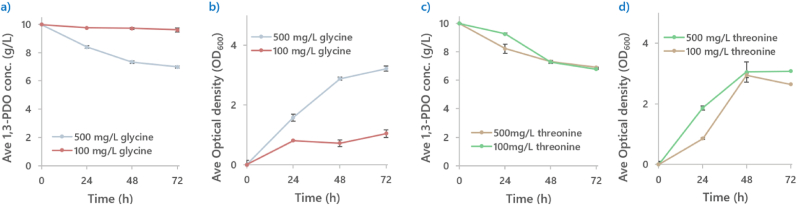 Figure 7
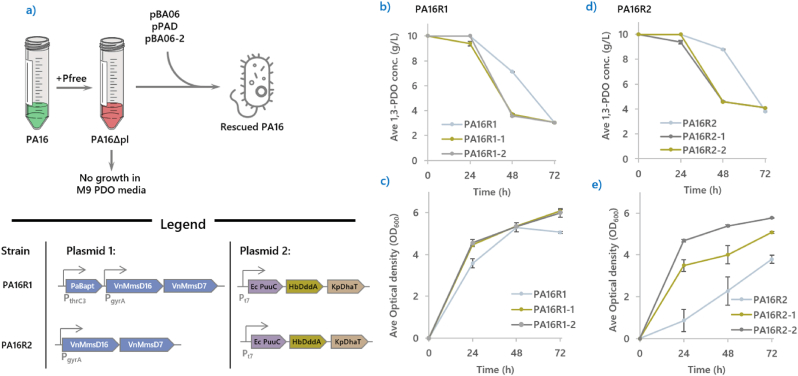 Figure 8
Peer Reviews
No public reviews on file for this paper yet. If you reviewed it on a platform where reviews are public (OpenReview, ICLR, NeurIPS, ICML), you can paste yours below so the community can read it here.
Videos
No videos yet. Explain this paper in a talk, walkthrough, or lecture? Add one.
Taxonomy
TopicsMicrobial Metabolic Engineering and Bioproduction · Plant biochemistry and biosynthesis · Enzyme Catalysis and Immobilization
Introduction
1
Polytrimethylene terephthalate (PTT) is a semi-crystalline thermoplastic polymer known for its elasticity, good chemical resistance and low melting temperature. PTT is formed by polycondensation of intermediate esters made from 1,3-propandiol (1,3-PDO) and terephthalic acid (TPA). It exhibits properties that overlap with polyethylene terephthalate (PET) and polybutylene terephthalate (PBT) [1]. It is used by DuPont and Shell as a raw material to produce fabric Sorona® and Corterra® respectively [2,3]. PTT's quick-drying capability and resistance to scratching and wrinkle make it highly versatile, extending its use from home furnishings, such as carpets and pillowcases, to automotive upholstery.
The rise of PTT was partly driven by the increasing pressure on using renewable raw materials. Of the two components to produce PTT, 1,3-PDO could be produced from fermentation of glucose or glycerol with engineered bacteria [[4], [5], [6]]. DuPont Tate & Lyle BioProducts famously demonstrated the production of 1,3-PDO through Escherichia coli fermentation. E. coli was engineered to produce 1,3-PDO from glucose using genes from Saccharomyces cerevisiae and Klebsiella pneumoniae [7]. Following DuPont's success, other companies like METEX NØØVISTA (France) and Sheng Hong (China) also entered the market to produce bio-based 1,3-PDO production with engineered microbes from glycerol [8].
However, although PTT is classified as a Group 1 bioplastic, indicating that its production is fully or partially derived from biological sources, this does not imply that it is inherently biodegradable [9]. Effective strategies for the recycling and degradation of PTT remain critical aspects in assessing its long-term environmental sustainability. Some studies have demonstrated that PTT can be depolymerized into oligomers and monomers through processes including supercritical methanol or zinc acetate catalysed reactions [10,11]. In addition, hydrothermal treatment using hot compressed water at 240–320 °C has been shown to effectively hydrolyze PTT into its original monomers, 1,3-PDO and TPA [12]. Enzymatic depolymerization strategies initially developed for polyethylene terephthalate (PET) have also been reported to exhibit activity against PTT [13,14].
Of the two hydrolysis products, TPA can be readily recovered by acidic precipitation and filtration, whereas the recovery of 1,3-PDO from aqueous solutions remains costly due to its high polarity and elevated boiling point [15]. To our knowledge, no microbial strains have been developed that can directly utilize 1,3-PDO as the principal carbon source for biomass formation. This motivated us to expand Escherichia coli's substrate scope to 1,3-PDO in this study.
To this end, we have chosen E. coli MG1655 as a host bacterium for utilizing 1,3-PDO due to the availability of tools for genetic manipulation. In a previous study, we successfully constructed an E. coli strain which could utilize malonate semialdehyde (MSA, a hypothetic intermediate in 1,3-PDO degradation pathway) as a carbon source for E. coli growth. This was achieved by introducing two methylmalonate semialdehyde dehydrogenase from Vibrio natriegens (VnMmsDs) coupled with the disruption of a native 3-hydroxy acid dehydrogenase (EcYdfG) to prevent carbon loss through the formation of 3-hydroxypropionic acid (3-HP) from MSA forming the strain, BA07Δ [16].
In this work, we have successfully constructed the full 1,3-PDO assimilating pathway in E. coli MG1655 (Fig. 1). This was done by using BA07Δ as the platform for further engineering works, which included the introduction of a 1,3-propanediol dehydrogenase from Klebsiella pneumoniae (KpDhaT) [17], an aldehyde dehydrogenase from E. coli (EcPuuC) [18] and a 3-hydroxypropionate (3-HP) dehydrogenase from Halomonas bluephagenesis (HbDddA) [19]. The resulting strain was subsequently subjected to Adaptive Laboratory Evolution (ALE) to enhance the 1,3-PDO assimilation abilities. Our fastest-growing strain, PA16 (Propanediol Assimilating passage 16) was observed to consume 6.5 g/L of 1,3-PDO to achieve an OD600 of 7 within 72 h. PA16 serves a chassis strain to enable future development of E. coli strains that can produce valuable chemicals from PTT wastes.Fig. 1**An illustration of a possible 1,3-PDO assimilation pathway and the components of its construction.**The proposed metabolic pathway to extend the β-alanine assimilation pathway towards 1,3-PDO assimilation. The pathway is separated into up and down stream components, each controlled by a single plasmid. The downstream portion is controlled by plasmid pBA06 (in blue arrows). Two plasmid variants controlling the upstream portion (in green arrows), pPAH (plasmid Propanediol Assimilating Hpd1) and pPAD (plasmid Propanediol Assimilating DdaA) were tested. KpDhaT: Klebsiella pneumoniae 1,3-propanediol dehydrogenase; EcPuuC: Escherichia coli aldehyde dehydrogenase; HbDddA: Halomonas bluphagenesis 3-hydroxypropionate dehydrogenase; PaBapt: Pseudomonas aeruginosa β-alanine pyruvate transaminase; VnMMsDs: Vibrio natriegens Methyl malonate semi aldehyde dehydrogenases.Fig. 1
Results and discussion
2
Extension of the MSA assimilation pathway towards 1,3-PDO
2.1
To identify potential gene candidates to bridge the gap between 1,3-PDO and MSA, we surveyed the literature for potential candidates. A 3-hydroxypropionate (3-HP) dehydrogenase from Candida albicans (CaHpd1) was found to convert 3-HP into MSA [20]. The process is a defence mechanism against toxic propionyl-CoA accumulation. In another study, Halomonas bluephagenesis was used as a bacterial platform for the overproduction of 3-HP; A 3-HP dehydrogenase (HbDddA) was deleted as part of their strategy to prevent loss of 3-HP through MSA formation [19]. Thus, CaHpd1 and HbDddA became gene candidates for the conversion of 3-HP to MSA in our metabolic pathway.
Many genes from Klebsiella pneumoniae were used by DuPont in the construction of the E. coli strain for industrial production of bio-based 1,3-PDO. 1,3-PDO dehydrogenase (KpDhaT) was used to catalyze the last step to convert 3-HPA into 1,3-PDO. KpDhaT is also capable of catalysing the oxidation of 1,3-PDO into 3-HPA [17]. Finally, an aldehyde dehydrogenase (EcPuuC) from E. coli, capable of converting 3-HPA into 3-HP [18], was chosen to complete the metabolic pathway (Fig. 1).
Balancing expression levels of individual genes in a heterologous metabolic pathway is important in metabolic engineering, because some intermediates produced in the pathway may manifest certain stresses and undermine cellular integrity if left unchecked. Since the PDO-to-MSA segment involves production of a toxic aldehyde intermediate (3-hydroxypropanal, 3-HPA), we placed the aldehyde-utilizing gene (EcPuuC) at the first place in the operon when constructing the expression vector. It is assumed that the gene closest to the promoter of an operon has the highest expression level [[21], [22], [23]]. KpDhaT was positioned at the distal end of the operon to reduce its expression level. This arrangement left either HbDddA or CaHPD1 to occupy the middle position, giving rise to the construction of plasmids pPAD and pPAH, respectively.
Determining the efficacy of CaHPD1 and HbDddA through biotransformation
2.2
Our initial attempt of constructing the 1,3-PDO assimilating strain began with the introduction of pPAH into BA07Δ, forming the new strain, BA07ΔH. The newly constructed strain was subsequently cultivated overnight in LB for preparing the seed culture. Next, M9 minimal medium supplemented with 1 g/L of CSM and 5 g/L of 1,3-PDO (M9-CSM-5PDO) was inoculated with 1 % of the seed culture. Unfortunately, it was found that BA07ΔH could not grow on 1,3-PDO even after 7 days of cultivation.
We speculated that whole cell biocatalysis of BA07ΔH could be used to highlight potential issues with the pathway. If the pathway was impeded at any point, the accumulation of metabolic intermediates would occur due to the absence of branch points.
The 1,3-PDO assimilation pathway is made up of the upstream portion, which is enabled by the plasmid pPAH (or pPAD), and the downstream portion is controlled by pBA06. To approach the investigation of the bottleneck in a systematic manner, these two plasmids were introduced sequentially into the host MG1655Δ. As a control, MG1655Δ was first tested to establish a baseline for 1,3-PDO assimilation. As expected, the 1,3-PDO assimilation rate of the host strain was low, having only consumed 0.88 g/L of 1,3-PDO, while producing 0.6 g/L of 3-HP within 72 h (Fig. 2a).Fig. 2**Illustrations of 1,3-PDO consumption rates of whole cell biocatalysis of engineered strains.**In a progressive manner, the construction BA07ΔD began with the host strain MG1655Δ. Whole cell bio catalysis experiments was applied to test the significance of the upstream and downstream components of 10 g/L of 1,3-PDO. (a) and (b) illustrate the inability of MG1655Δ and BA07Δ to consume 1,3-PDO, suggesting the importance of the upstream pathway to enable 1,3-PDO consumption. (c) and (d) illustrate the 1,3-PDO assimilation profiles of BA07ΔH and BA07ΔD, where 2 g/L and 7.62 g/L of 1,3-PDO were consumed respectively, suggesting that HbDddA is the superior 3-hydroxypropionate dehydrogenase for our application. (e) and (f) show that without the downstream portion of the pathway, 1,3-PDO assimilation is greatly diminished.Fig. 2
When BA07Δ (MG1655 ΔEcYdfG + pBA06) was subjected to the same tests, BA07Δ produced 0.4 g/L of 3-HP from 0.7 g/L of 1,3-PDO within 72 h (Fig. 2b), having similar 1,3-PDO assimilation profile as MG1655Δ. BA07ΔH, which harbours the complete 1,3-PDO assimilation pathway, consumed 3.8 g/L of 1,3-PDO within 72 h without any 3-HP accumulation.
Lastly, to establish the significance of the lower pathway, a strain devoid of the lower pathway was constructed (BA07ΔH-β). Unsurprisingly, 3-HP accumulation was observed: 1.6 g/L of 1,3-PDO was consumed and 1 g/L 3-HP was detected (Fig. 2e), consistent with the expected functionality of the lower pathway.
With the encouraging results from the biotransformation of BA07ΔH, the cells were taken from the 24-h time point of the biotransformation experiment and diluted tenfold using the M9-CSM-10PDO medium. Unfortunately, no growth was observed despite a 14-day incubation period.
E. coli BA07ΔD was subsequently constructed by introducing both pPAD and pBA06 into MG1655Δ. pPAD was the same to pPAH except that CaHPD1 was replaced by HbDddA. Under the same biotransformation conditions, BA07ΔD consumed 1,3-PDO at a rate twice as high as BA07ΔH (7.6 g/L vs. 3.7 g/L, Fig. 2c and d) without accumulating 3-HP. The efficacy of pPAD were also tested with the strain MG1655ΔD-β, where the downstream portion of the pathway was omitted. Seen in Fig. 2f, an accumulation of 0.79 g/L of 3-HP was observed.
A sample of BA07ΔD from the 24-h time point of biotransformation was diluted tenfold using fresh M9-CSM-10PDO medium. The culture was left at room temperature without agitation. Growth was detected 14 days later. The mutant strain (named as PA0) was found to have grown to an OD_600_ of 4.7 by consuming 3.8 g/L of 1,3-PDO. This was the first instance where E. coli was observed consuming 1,3-PDO as the primary carbon source for biomass formation.
Adaptive laboratory evolution of PA0
2.3
To enhance the 1,3-PDO assimilation phenotype of PA0, the culture underwent evolution through 16 serial passages. One passage involved inoculating fresh M9-CSM-10PDO medium with 1 % (v/v) of the previous culture. Here, the first passage was done with 1 % (v/v) of PA0 culture from the 14th day, yielding the strain PA1. PA1 grew to an OD_600_ of 4.2 by consuming 3 g/L of 1,3-PDO in 11 days. To test if the bacterium culture was contaminated with other species, the genetic material of PA1 was subsequently extracted according to the protocol provided by the QIAGEN Plasmid mini kit and analyzed using Nanopore sequencing. Apart from the plasmid of interests, samples extracted from plasmid extraction kits also contains host genomic DNA, so the sequencing would acquire both genomic DNA and plasmid reads.
The species could then be identified by subjecting the raw reads from the genome to BLASTn to discern the identity of the mutant strain, while the plasmids could be aligned with existing plasmid maps created during their construction. From Fig. 3a, the genetic material extracted from PA1 indeed consist of pPAD and pBA06, represented by the two peaks in the plot. BLASTn results of the genomic DNA also revealed that the sequences belong to E. coli MG1655.Fig. 3Strain verification and ALE of strain PA0.****(a) Shows the representation of the frequency of each of individual read from the genetic material extracted from PA1 as a plot diagram. It can be concluded that genetic material extracted from PA1 comprise of the host genomic DNA which belongs to E. coliMG1655Δ and pPAD and pBA06, proving that the mutant strain was not a contamination of a foreign bacteria species. (b) and (c) track the 1,3-PDO consumption and growth profiles of significant passages during the ALE of PA0. PA16, the fastest growing strain could consume 6.5 g/L of 1,3-PDO to achieve an OD_600_ of 7 within 72 h. (d) An overlay of chromatograms of the supernatant collected from culturing PA16. The two peaks on the left represents the salts present in all samples. The retention time of 1,3-PDO is 14.82 min as shown. The decline in concentration of 1,3-PDO across 72 h are shown here in blue (24 h), green (48 h) and purple (72 h). Also shown in the chromatogram, no intermediates were observed to be accumulated.Fig. 3
In the next 15 serial passages (Fig. 3b–c), 1,3-PDO assimilation performance was greatly improved till the 8th passage (PA8). PA8 consumed around 5 g/L of 1,3-PDO within 3 days (72 h), while the PA0 was only able to assimilate 3.7 g/L in 14 days. It was observed that further improvements to 1,3-PDO assimilation after passage 8 was slowed, with PA16 consuming 6.5 g/L of 1,3-PDO to achieve an OD_600_ of 7 within 72 h. As a control, PA16 only grew to an OD_600_ of 0.6 when 1,3-PDO was not included in its growth medium. The PDO assimilation was oxygen-dependent. Under microaerobic condition (with culture tube sealed), the OD600 was only 1.4 at 72 h (Supplementary Fig. S1).
Transcription analysis of PA16
2.4
To understand the mechanism of 1,3-PDO assimilation, the RNA of PA1 and PA16 were extracted at the early exponential phase of their growth in M9-CSM medium supplemented with 10 g/L of 1,3-PDO. We hypothesize that the transcription fold changes between the least (PA1) and the most adapted strain (PA16) could yield useful insights into the biological conditions required of 1,3-PDO assimilation. There are two data sets which are of interest. The first is the expression levels of the genes belonging to the 1,3-PDO assimilation pathway. The second is the transcriptome of the host strain. Since the culture conditions, RNA extraction protocols and sequencing techniques are the same, the dataset between passages can be compared against each other [24].
The expression levels of all the genes of the 1,3-PDO assimilating pathway were found to have been significantly reduced because of ALE (Fig. 4e). This was unexpected as it was originally speculated that since the genes for 1,3-PDO metabolism are essential for cellular survival on 1,3-PDO as the major carbon source, the genes would be upregulated instead.Fig. 4Illustrations of expression levels of host genes essential to 1,3-PDO assimilation and the results of their subsequent overexpression.****(a) and (b) show gene candidates which are essential for 1,3-PDO assimilation was selected by comparing the transcriptome of PA1 and PA16. The genes were subsequently introduced into PA1 to improve 1,3-PDO assimilation. (c) and (d) shows their 1,3-PDO consumption profile and growth rates recorded over 72 h. It was observed that the upregulation of the EcKbl-EcTdh operon provided the most improvement leading to a 4.8-fold growth improvement in PA1. (e) Expression levels of plasmid-borne genes saw a huge decrease in expression levels between PA1 and PA16 with varying folds of reduction: EcPuuC at 2.6 folds; HbDddA at 1.8 folds; KpDhaT at 2.22 folds VnMmsD16 at 3 folds and VnmmsD7 at 2.7 folds. This suggests that lower expression levels of these genes helped PA16 achieved better growth rates on 1,3-PDO. Since no mutation were detected on the replication origin nor promoter regions of the plasmids which could retard gene expression levels, it was speculated that the global transcription mechanism may be perturbed to lower expression levels of the genes. glyceraldehyde-3-phosphate dehydrogenase (EcGapA) is also shown here as a control comparison.Fig. 4
However, it is important to note that although the expression levels of the 1,3-PDO assimilating genes in PA16 have been downregulated, the expression levels from these genes were still among the highest expressed genes against with the transcriptomic background of the host. As a reference, glyceraldehyde-3-phosphate dehydrogenase (EcGapA), a key gene of glycolysis, were included in Fig. 4e for comparison.
This finding suggests that the initial expression levels of the genes may have been too high for the host cell to maintain, and that the ALE was used to reduce the expression levels of the genes in the 1,3-PDO assimilation pathway to a level where the stresses could be handled by the host defence mechanisms, enabling faster growth rates. Our initial suspicion was that the sequence of the plasmid promoters and replication origins were mutated to reduce gene expression rates and plasmid copy numbers respectively. However, this was not the case, as Nanopore sequencing suggests that the plasmid sequences remain unchanged.
An additional outcome of the transcriptomic analysis was the identification of host-derived transcripts with notable changes in abundance. These genes are stress-induced protein (EcYchH), stress protein (EcCspC), NAD(+)-dependent succinate semialdehyde dehydrogenase (EcYneI), inner membrane protein (EcYghB), 2-amino-3-ketobutyrate CoA ligase (EcKbl), threonine dehydrogenase (EcTdh) (Fig. 4a and b). The genes listed in Table 1 were prioritized based on their high transcription levels or significant fold changes (PA16/PA1). In this study, we focused on upregulated genes, since their functions can be easily tested through plasmid-based overexpression.Table 1. List of genes of interest.Table 1. GeneProductPA1PA16PA16 VS PA1EcYchHstress-induced protein12.4843.923.52EcCspCstress protein, member of the CspA family15.9712.960.81EcYneINAD(+)-dependent succinate semialdehyde dehydrogenase0.100.535.53EcYghBInner membrane protein0.241.446.04EcKbl2-amino-3-ketobutyrate CoA ligase0.121.2310.20EcTdhthreonine dehydrogenase0.181.347.45EcLpxCUDP-3-O-acyl-N-acetylglucosamine deacetylase2.6711.894.45EcCpxPperiplasmic protein1.226.445.27EcArgRDNA-binding transcriptional dual regulator0.803.023.77Genes annotated as putative, transporters, and ribosomal proteins were not included in this table.
The following plasmids containing these candidates of interest were constructed and introduced into PA1: pPA-EcCspC, pPA-EcYneI, pPA-EcYghB, pPA-EcYchH and pPA-(EcKbl-EcTdh). EcKbl and EcTdh were amplified as a single fragment as they were found to be located adjacent to each other in the host genome. Unfortunately, attempts to construct plasmids carrying EcLpxC, EcCpxP, and EcArgR were unsuccessful, likely due to stress of overexpressing these genes. Each of the surviving strain was cultivated in M9-CSM-10PDO medium at 30 °C with 1,3-PDO concentrations and optical density tracked every 24 h for 72 h. Two controls were also included in this experiment: one was PA1GFP, which was created by using the same vector to express enhanced green fluorescence protein (eGFP) instead of candidate gene in PA1; the other was PA1 without any further modifications.
As shown in Fig. 4c and d, it became evident that all the gene candidates introduced improved 1,3-PDO assimilation. Among the candidates, EcKbl and EcTdh were found to be the most helpful: PA1's OD600 at 72 h was increased from 0.9 to 4.4 after the two genes were expressed. This strain (PA1+(EcKbl-EcTdh)) was also cultivated on M9-CSM without 1,3-PDO as a control, where no further growth was observed after 72 h.
EcKbl and EcTdh catalyze the two-step degradation of threonine into glycine, the latter of which can subsequently be cleaved into CO2 and a C1 methylene building block, which is required for the biosynthesis of nucleotides and amino acids (Fig. 5a). Consistent with this role, genes encoding components of the GCV were upregulated in PA16 compared to PA1 (Fig. 5b). Furthermore, genes involved in utilizing 5,10-methylene-THF for purine biosynthesis were also upregulated in PA16 (Fig. 5c). We therefore hypothesize that the limited availability of C1 units in the 1,3-PDO assimilation pathway imposed an evolutionary pressure on PA16 to enhance the expression of these pathways to support survival. We did not consider the contribution of additional acetyl-CoA here because acetyl-CoA is the entry point of 1,3-PDO assimilation flux into the central metabolism (acetyl-CoA should be abundant).Fig. 5Illustrates the potential connection between threonine degradation and C1 molecule supply****.****(a) Illustrates the possible pathway for the conversion of threonine into pyruvate and 5,10-methylene-THF, both of which are critical intermediates for supporting biomass formation on 1,3-PDO. (b) Illustrates the great disparity of expression levels of the genes participating in the glycine cleavage system, along with two genes for converting glycine into serine (EcGlyA) and pyruvate (EcTdcG) between PA16 and PA1. (c) Genes utilizing 5,10-methylene-THF as C1 building blocks for purine biosynthesis, essential for DNA synthesis were also discovered to have been upregulated in **PA16.**Fig. 5
The above results highlighted the importance of threonine and glycine in supporting 1,3-PDO assimilation (1 g/L CSM contains 0.1 g/L threonine and no glycine). To test this hypothesis, glycine or threonine were supplemented at 0.1 g/L and 0.5 g/L. As shown in Fig. 6a and b, supplementation with 0.1 g/L of glycine resulted in minimal growth (OD_600_ ∼1 after 72 h) and poor substrate assimilation (0.4 g/L 1,3-PDO was consumed). Increasing glycine concentration to 0.5 g/L improved growth to an OD_600_ of 3.2 with 3 g/L of 1,3-PDO consumed. Supplementation with threonine at 0.1 g/L or 0.5 g/L yielded similar results, with PA16 reaching an OD_600_ of ∼3 from ∼3.2 g/L of 1,3-PDO (Fig. 6c and d). The result confirmed the importance of threonine and glycine supplementation in 1,3-PDO assimilation and suggested that their benefiting effects may be related to supply of the C1 methylene building block to biomass formation.Fig. 6Diagrams showing the performance of 1,3-PDO assimilation and growth profiles of P16 on 100 mg/L or 500 mg/L of glycine or threonine**.****(a-b)** Illustrates the 1,3-PDO and growth behaviour of PA16 on 100 mg/L and 500 mg/L of glycine. Although growth rate and 1,3-PDO consumption was found to be minimal in 100 g/L of glycine, both parameters were improved where OD600 of 3.2 with 3 g/L of 1,3-PDO was consumed when glycine was increased to 500 mg/L after 72 h.(c–d) PA16's growth and 1,3-PDO consumption was similar between the different concentrations of threonine, reaching an OD600 of ∼3 from ∼3.2 g/L of 1,3-PDO.Fig. 6
Comparative genomic analysis of BA07Δ, PA1 and PA16
2.5
To further elucidate the genetic changes underlying 1,3-PDO assimilation, genomic DNA from BA07Δ, PA****1 and PA16 was extracted and subjected to Illumina sequencing. As genome of the parental strain BA07Δ is not identical to the E. coli MG1655 reference genome, BA07Δ was used as the baseline for comparative analysis against PA****1 and PA16. Among the mutations unique to the 1,3-PDO assimilating strains (PA01 and PA16), notable changes were identified in a poly(A) polymerase I (EcPcnB), which adds poly(A) tails to RNA sequences, modulating RNA degradation [25]. In PA****1, EcPcnB harboured a nonsynonymous mutation at residue 87, which changed from an alanine to glycine. In PA16, an additional mutation was observed at residue 31, substituting valine for leucine. These changes may have contributed to the reduced transcriptional stability of plasmid-borne genes observed in these strains as seen in Fig. 4e. Additionally, it was also reported that Rho-independent transcription terminators like the pheA terminator used in pPAD or T7 terminator in pBA06 serves as signals for polyadenylation and the subsequent degradation of the transcribed mRNAs [26]. These mutations in EcPcnB may be partially responsible for the reduced transcription level of the plasmid-based genes in the evolution from PA1 to PA16.
Reconstruction of PA16
2.6
To further understand PA16, we extracted its plasmids pPAD and pBA06 and analyzed it using nanopore sequencing. We did not observe any mutation. As expected, these extracted plasmids could not enable the parent strain BA07D to grow on 1,3-PDO (in presence of CSM). This result suggests that spontaneous mutations in the genome essential for 1,3-PDO assimilation should have arisen during the evolution of PA16.
To test this hypothesis, we applied a plasmid curing strategy based on the Pfree system [27]. Briefly, a single colony of PA16 was rendered competent and transformed with the Pfree plasmid, forming the strain PA16-Pfree. Following the published protocol, PA16-Pfree was cultured at 30 °C in the presence of rhamnose and anhydro tetracycline as inducers without antibiotics overnight. Subsequently, the liquid culture was streaked on antibiotic-free agar plates and incubated at 30 °C overnight. Individual colonies were screened for the loss of plasmid-born antibiotic resistance (spectinomycin and kanamycin) and for their ability to assimilate 1,3-PDO. The resulting plasmid-free derivative of PA16 (designated here as PA16Δpl) lacked both resistance markers and the 1,3-PDO assimilation phenotype.
To test if plasmid complementation could restore the phenotype, PA16Δpl was transformed with pBA06 and pPAD, forming the regenerated strain PA16R1. This strain regained the ability to assimilate 1,3-PDO (Fig. 7b and c) and, unlike its predecessors PA****1 or PA0, did not require prolonged incubation times of weeks to establish growth. PA16R1 reached an OD_600_ of 5.06 by consuming 7 g/L of 1,3-PDO. Performance was further improved after two successive passages, which both PA16R1-1 and PA16R1-2 achieving and OD_600_ of 6 under the same conditions.Fig. 7Illustrations describing the reconstruction of PA16****.****(a) A simple diagram illustrating the use of pfree system to cure PA16 of pBA06 and pPAD. Upon successful curing, the new strain, PA16Δpl lost the ability to consume 1,3-PDO as the main carbon source. 1,3-PDO assimilation was restored when either pBA06 or pBA06-2 along with pPAD were reintroduced into PA16Δpl. (b) Shows the successful restoration of 1,3-PDO assimilation of PA16R1, and (c) shows the optical density of PA16 R1, where both parameters were improved after two passages. (d) and (e) illustrates the rate of 1,3-PDO assimilation and optical density of PA16R2, where both parameters were also improved after two passages.Fig. 7
In parallel, PA16Δpl was also complemented with a modified pBA06 lacking PaBapt (pBA06-2), forming PA16R2. This strain initially grew to an OD_600_ of 3.79 from 6.2 g/L of 1,3-PDO, and after two passages, PA16R2-2 achieved an OD_600_ of 5.7 from 6 g/L of 1,3-PDO (Fig. 7d and e). PaBapt is a legacy gene left in pBA06 from a previous study of β-alanine assimilation. The result confirmed that PaBapt is not needed for 1,3-PDO assimilation.
Materials and method
3
Chemicals and media formulation
3.1
All chemicals involved in this study were procured from Sigma Aldrich or from BioBasic. Cultivation of strains for plasmid propagation was done using LB. For metabolite analysis purposes, M9 minimal medium was used. The composition of the base M9 medium (final concentration) was as follows: 6.8 g/L Na_2_HPO_4_, 3 g/L KH_2_PO_4_, 0.5 g/L NaCl and 1 g/L NH_4_Cl.
For every 10 mL of M9 media, 17 μL of K3 master mixture was supplemented. The K3 master mix was prepared by mixing 2.5 mL of 0.1 M ferric citrate solution (autoclaved), 1 mL of 4.5 g/L thiamine solution, 3 mL of 4 mM Na_2_MoO_4_ (autoclaved), 1 mL of 1 M MgSO_4_ solution (autoclaved) and 1 mL of 1,000X K3 trace elements stock. The 1,000X K3 trace elements stock contained 5 g/L CaCl_2_∙2H_2_O, 1.6 g/L MnCl_2_∙4H_2_O, 0.38 g/L CuCl_2_∙2H_2_O, 0.5 g/L CoCl_2_∙6H_2_O, 0.94 g/L ZnCl_2_, 0.03 g/L H_3_BO_3_, 0.4 g/L Na_2_EDTA∙2H_2_O. The pH of the medium was adjusted to 7.
10 g/L 1,3-PDO and 0.8 g/L Complete Supplement Mixture (CSM) were supplemented in most M9 media. Such M9 medium is labeled as M9-CSM-10PDO. 0.8 g/L CSM is composed of Adenine hemisulfate (10 mg/L), l-Arginine (50 mg/L), l-Aspartic acid (80 mg/L), l-Histidine hydrochloride monohydrate (20 mg/L), l-Isoleucine (50 mg/L), l-Leucine (100 mg/L), l-Lysine hydrochloride (50 mg/L), l-Methionine (20 mg/L), l-Phenylalanine (50 mg/L), l-Threonine (100 mg/L), L-Tryptophan (50 mg/L), l-Tyrosine (50 mg/L), l-Valine (140 mg/L), Uracil (20 mg/L).
Solid media were prepared by adding 1.5 % (w/v) agar.
Bacterial culture
3.2
All strains cultivated in liquid media were done in 150 mL shake flask or in 50 mL Falcon tubes and were incubated at 30 °C/220 rpm. Liquid cultures of genetically modified organisms were supplemented with either 50 mg/L of Kanamycin and/or Spectinomycin to maintain plasmid of the modified organism. In the case of plasmid propagation and bacterial colony cultivation on solid culture, agar plates supplemented with either 50 mg/L of Kanamycin and/or Spectinomycin were incubated at 30 °C until obvious colonies could be observed. The colonies were picked for further processing.
ALE was performed in a series of passages. A passage is defined as the following: a first culture was cultivated for 24 h in 5 mL of M9-CSM-10PDO medium in a 50 mL Falcon tube; 50 μL of the grown culture was used to inoculate a fresh batch of 5 mL M9-CSM-10PDO medium.
Biotransformation
3.3
Biotransformation experiments begin with an overnight culture of engineered cells cultivated in LB. The cells were then pelleted, and the LB supernatant was discarded. The pellet was resuspended with 5 mL of M9-CSM-10PDO. The resuspended culture was incubated at 30 °C/220 rpm. 1,3-PDO concentration was monitored over time.
Metabolite analysis and optical density analysis
3.4
At a sampling time point, 200 μL of cell culture was collected for analysis. The samples were pelleted via centrifugation at 10,000 rpm for 1 min, and the supernatant was filtered with a 0.22 μm nylon filter. The filtrate was analyzed with an Agilent 1260 Infinity HPLC equipped with an Aminex HPX-87H column (300 mm × 7.8 mm, Bio-Rad) and Refractive Index Detector (RID). The mobile phase used in the analysis was 5 mM sulphuric acid aqueous solution, at a flow rate of 0.7 mL/min in isocratic mode. The column temperature was set at 50 °C.
A separate sample of 10 μL of cell culture was also collected from each time point for the purpose of cell density analysis. The sample was mixed with 190 μL of fresh LB or M9 minimal medium in a flat bottom 96 well plate (Costar). The Optical Density at 600 nm (OD_600_) was measured with a plate reader (Thermofisher). The obtained values were converted into the standard units by using a calibration curve.
Plasmid construction, sequencing and strain engineering
3.5
Newly constructed plasmids were propagated in Dh5α (NEB C2987H) overnight and extracted in accordance with the protocol provided in the QIAprep Spin Miniprep Kit (Qiagen). 50 ng of the extracted genetic materials were analyzed using the nanopore sequencing workflow provided by Oxford Nanopore Technologies with Flongle Flow Cell (FLG-114) and Rapid barcoding kit (SQK-RBK114). The analysis of the sequencing output was done with our in-house developed MATLAB application. The list of plasmids and strains used in this study can be found in Table 2, Table 3 respectively.Table 2. List of plasmids constructed in the study of 1,3-PDO assimilation.Table 2. Plasmid namePlasmid detailspPAHP15(Kan^R^)T7: EcPuuC - CaHPD1 - KpDhaTpPADP15(Kan^R^)T7: EcPuuC - HbDddA - KpDhaTpCspCP5(Cam^R^)gyrA: EcCspCpYneIP5(Cam^R^)gyrA: EcYneIpYghBP5(Cam^R^)gyrA: EcYghBpYchHP5(Cam^R^)gyrA: EcYchHpEcKbl-EcTdhP5(Cam^R^)gyrA: EcKbl - EcTdhpeGFPP5(Cam^R^)gyrA: eGFPpBA06-2P5(Cam^R^)gyrA: VnMmsD16 - VnMmsD7Kan^R^: Kanamycin resistance; EcPuuC: Escherichia coli β-alanine pyruvate transaminase; CaHPD1: Candida albicans 3-hydroxypropionate dehydrogenase; KpDhaT: Klebsiella pneumoniae 1,3-propanediol oxidoreductase; HbDddA: Halomonas bluephagenesis 3-hydroxypropionate dehydrogenase; EcYneI: Escherichia coli Succinic semialdehyde dehydrogenase; EcCspC: Escherichia coli cold shock protein C; EcYghB: Escherichia coli dedA-like inner membrane protein; EcYchH: Escherichia coli stress-induced protein; EcKbl: Escherichia coli 2-amino-3-ketobutyrate CoA ligase; EcTdh: Escherichia coli threonine dehydrogenase; eGFP: enhanced green fluorescence protein; VnMmsD: Vibrio natriegens methylmalonate semialdehyde dehydrogenase.Table 3. List of strains constructed in the study of 1,3-PDO assimilation.Table 3. Strain nameHost strainPlasmid 1Plasmid 2Plasmid 3BA07ΔMG1655ΔEcYdfGpBA06––BA07ΔHMG1655ΔEcYdfGpBA06pPAH–BA07ΔH-βMG1655ΔEcYdfG–pPAH–BA07ΔDMG1655ΔEcYdfGpBA06pPAD–BA07ΔD-βMG1655ΔEcYdfG–pPAD–PA1+EcCspCMG1655ΔEcYdfGpBA06pPADpPA-EcCspCPA1+EcYneIMG1655ΔEcYdfGpBA06pPADpPA-EcYneIPA1+EcYghBMG1655ΔEcYdfGpBA06pPADpPA-EcYghBPA1+EcYchHMG1655ΔEcYdfGpBA06pPADpPA-EcYchHPA1+(EcKbl-EcTdh)MG1655ΔEcYdfGpBA06pPADpPA-EcKbl-EcTdhPA1+eGFPMG1655ΔEcYdfGpBA06pPADpPA-eGFPPA16+pfreeMG1655ΔEcYdfGpBA06pPADpfreePA16plMG1655ΔEcYdfGPA16R1MG1655ΔEcYdfGpBA06pPADPA16R2MG1655ΔEcYdfGpBA06-2pPADMG1655Δ (ΔrecA, ΔendA, ΔydfG, DE3) was selected as the default host for plasmid transformation. Here, the ‘Δ’ designation denotes that the EcYdfG gene in MG1655 was additionally disrupted.
RNA extraction and transcriptome analysis
3.6
PA1 and PA16 were grown on M9-CSM-10PDO. Total RNA was extracted during the early exponential phase denoted when OD_600_ was measured to be around 0.5 to 1, according to the manufacturer's protocol (Thermo Scientific GeneJET RNA purification kit, K0731). After verification of RNA concentrations using Nanodrop, the samples were sequenced using the Illumina platform through a third-party service provider (NovogeneAIT Genomics Singapore). The default workflow was used except that the rRNA depletion was omitted for cost-saving. The resulting FASTQ data was subsequently process with an in-house developed MATLAB application. The resulting transcription levels (in terms of rpkm values) from both samples were exported to an Excel spreadsheet file for differential analysis.
Genome extraction and analysis
3.7
PA1 and PA16 were grown on LB media overnight. Genomic DNA was extracted according to the manufacturer's protocol (Thermo Scientific GeneJET Genomic DNA Purification Kit). After verification of DNA concentrations using Nanodrop the samples were sequenced using an Illumina platform through a third-party service provider (NovogeneAIT Genomics Singapore). The resulting BAM data was viewed using the Integrative Genomics Viewer [28]. Single Nucleotide Polymorphism (SNP) data were processed via an in-house developed MATLAB application and exported as an Excel spreadsheet file for further analysis.
CRediT authorship contribution statement
Nga Yu Poon: Writing – review & editing, Writing – original draft, Visualization, Validation, Software, Project administration, Methodology, Investigation, Formal analysis, Data curation, Conceptualization. Anthony J. Sinskey: Writing – review & editing, Supervision, Conceptualization. Kang Zhou: Writing – review & editing, Supervision, Resources, Funding acquisition, Conceptualization.
Ethical statement
This article does not contain any studies with human participants or animals performed by any of the authors.
Declaration of competing interest
The author Kang Zhou is an Editorial Board Member for Synthetic and Systems Biotechnology and was not involved in the editorial review or the decision to publish this article. The authors declare that they have no known competing financial interests or personal relationships that could have appeared to influence the work reported in this paper.
The reference list from the paper itself. Each links out to its DOI / PubMed record.
- 1Sharma S.S.Anjana V.N.John A.K.PTT-based polymer blends and IP Ns: preparation methods Ajitha A.R.Thomas S.Poly trimethylene terephthalate: based blends, IP Ns, composites and nanocomposites 2023 Springer Nature Singapore Singapore 1335
- 2Kurian J.V.A new polymer platform for the future — sorona® from corn derived 1,3-Propanediol J Environ Polym Degrad 132200515916710.1007/s 10924-005-2947-7 · doi ↗
- 3Cervin M.A.Soucaille P.Valle F.Process for the biological production of 1,3-propanediol with high titer 09/6412003 Patent Appl.652
- 4Skraly F.A.Lytle B.L.Cameron D.C.Construction and characterization of a 1,3-propanediol operon Appl Environ Microbiol 641199898105943506610.1128/aem.64.1.98-105.1998 PMC 124678 · doi ↗ · pubmed ↗
- 5Saxena R.K.Anand P.Saran S.Isar J.Microbial production of 1,3-propanediol: recent developments and emerging opportunities Biotechnol Adv 276200989591310.1016/j.biotechadv.2009.07.00319664701 · doi ↗ · pubmed ↗
- 6Frazão C.J.R.Construction of a synthetic pathway for the production of 1,3-propanediol from glucose Sci Rep 9120191157610.1038/s 41598-019-48091-7PMC 668906231399628 · doi ↗ · pubmed ↗
- 7Nakamura C.E.Whited G.M.Metabolic engineering for the microbial production of 1,3-propanediol Curr Opin Chem Biol 145200345445910.1016/j.copbio.2003.08.00514580573 · doi ↗ · pubmed ↗
- 8Marr A.C.1,3‐Propanediol, an exemplary bio‐renewable organic platform chemical Adv Synth Catal 3662320244835484510.1002/adsc.202401066 · doi ↗