Propofol attenuates angiogenesis by activating endoplasmic reticulum stress to suppress TFAP2C-driven VEGFA transcription
Fan Yang, Yi Liu, Hui Li, Xue Shang, Qing Hua, Yun Zhu, Beibei Tao, Zhirong Sun

TL;DR
Propofol reduces blood vessel growth by triggering endoplasmic reticulum stress, which suppresses a key transcription factor involved in VEGFA production.
Contribution
The study reveals a novel mechanism by which propofol inhibits angiogenesis through the PERK/eIF2α/TFAP2C pathway.
Findings
Propofol activates endoplasmic reticulum stress, suppressing TFAP2C translation.
TFAP2C binds to the VEGFA promoter to regulate its transcription.
Propofol inhibits VEGFA/VEGFR2-dependent angiogenesis in vitro and in vivo.
Abstract
During anesthesia, significant hemodynamic changes often alter the vascular microenvironment and affecting endothelial cell behavior. Propofol, a commonly used intravenous anesthetic, has been widely studied for its role in tumor angiogenesis through tumor cell–derived VEGF–mediated endothelial interactions. However, its direct effects on endothelial cell–mediated angiogenesis in non-malignant diseases such as diabetic retinopathy, diabetic nephropathy, and coronary heart disease remain unclear. To address this gap, we examined the effects of propofol on VEGFA-mediated angiogenesis in vitro and in vivo. Mechanistically, propofol triggers endoplasmic reticulum stress by promoting phosphorylation of PERK and its downstream effector eIF2α, leading to suppressed translation of TFAP2C—a transcription factor critical for endothelial function. Further analysis revealed that TFAP2C directly…
Genes, proteins, chemicals, diseases, species, mutations and cell lines named across the full text — each resolved to its canonical identifier and authoritative record.
Click any figure to enlarge with its caption.
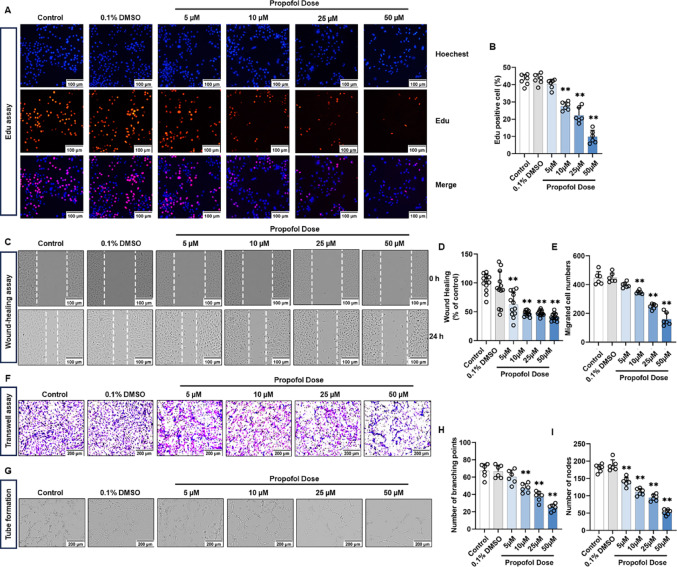 Figure 1
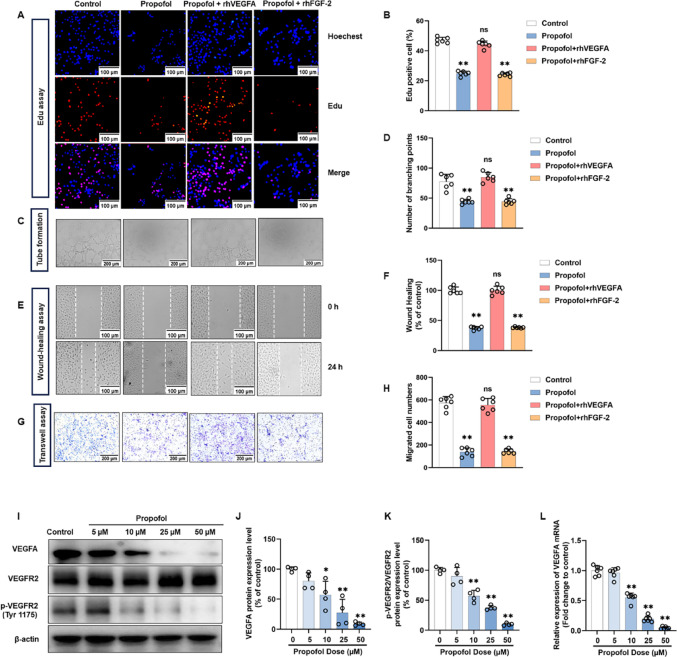 Figure 2
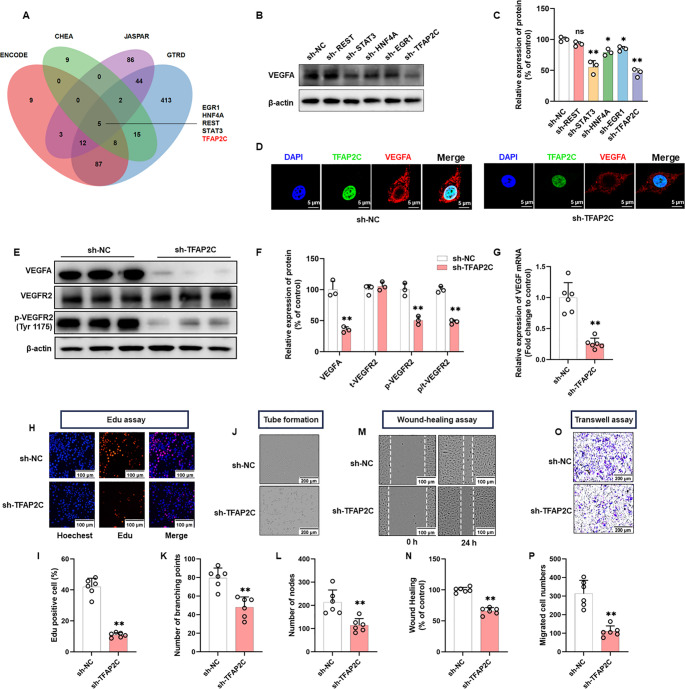 Figure 3
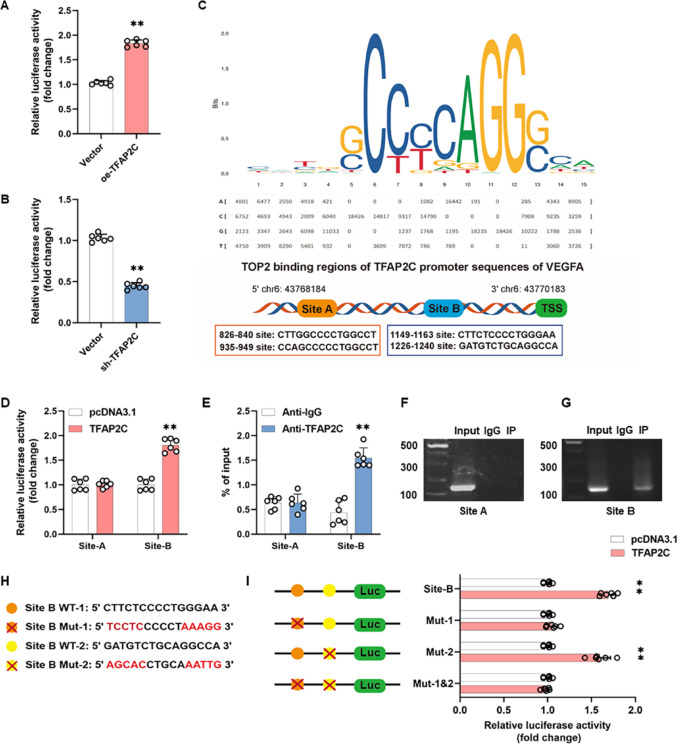 Figure 4
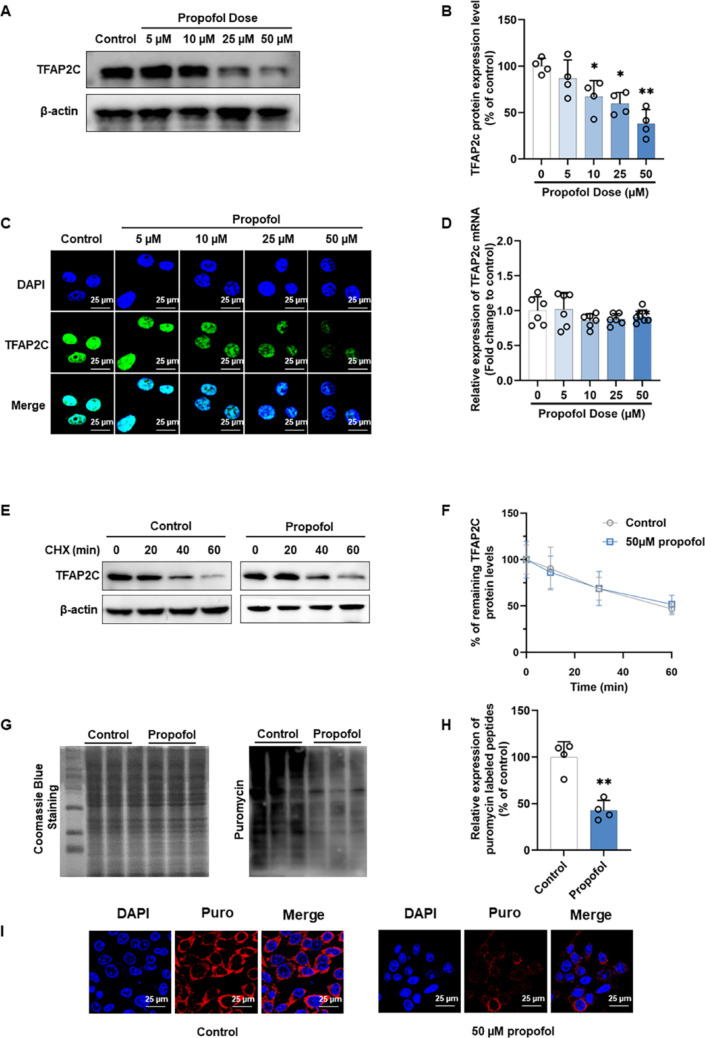 Figure 5
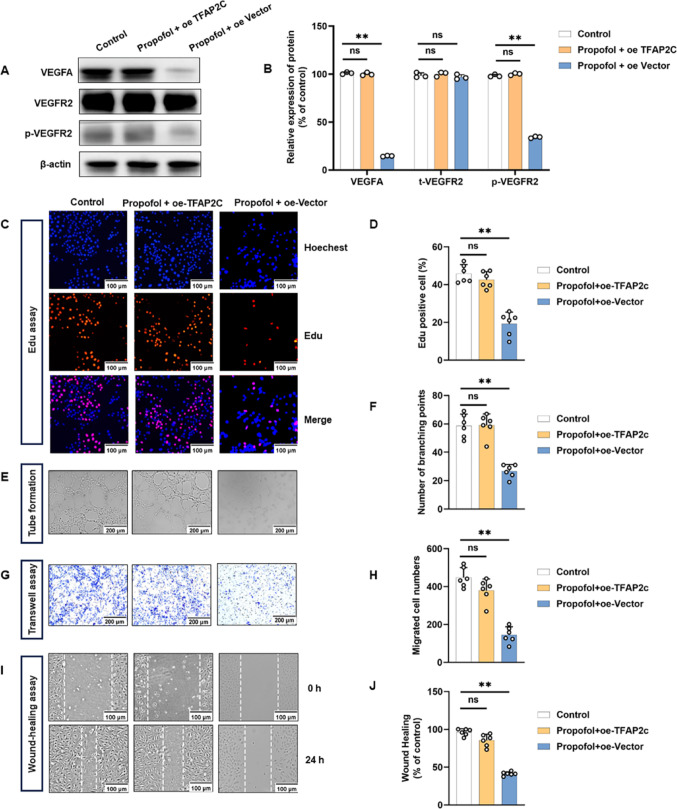 Figure 6
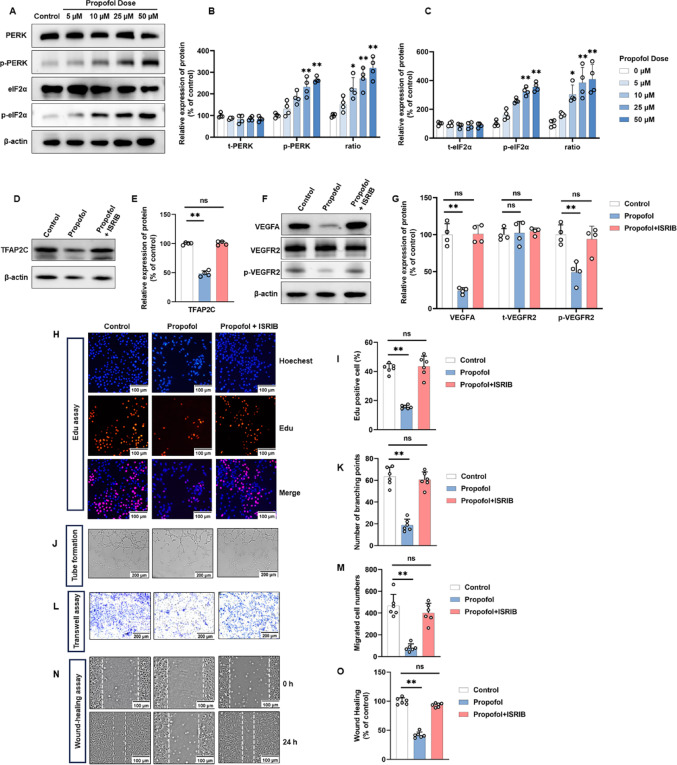 Figure 7
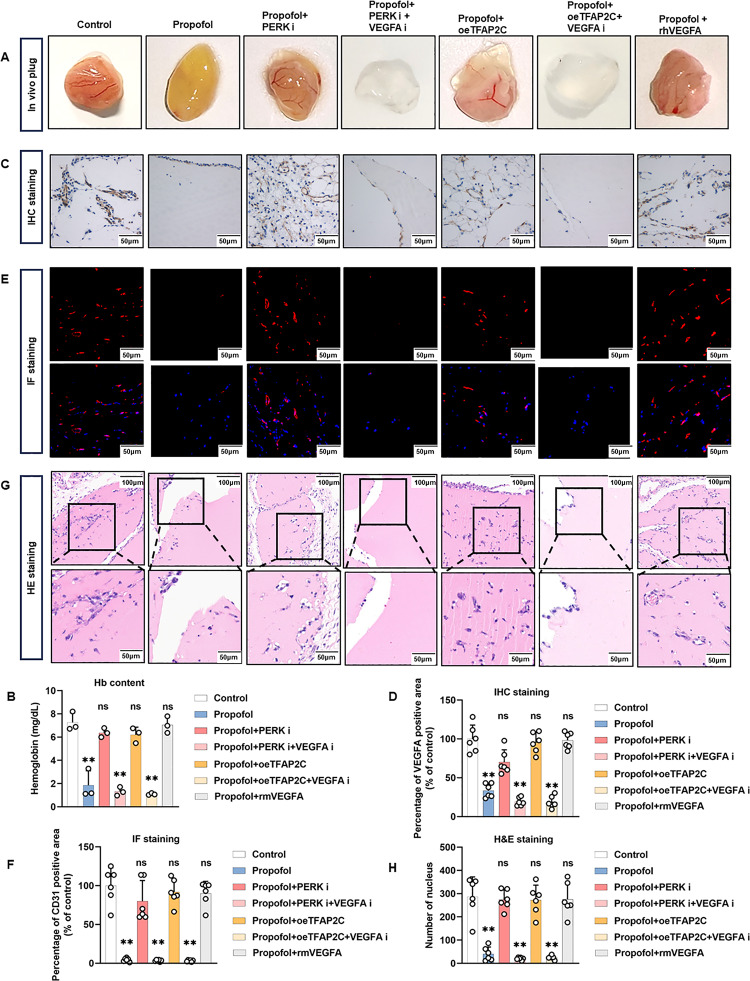 Figure 8
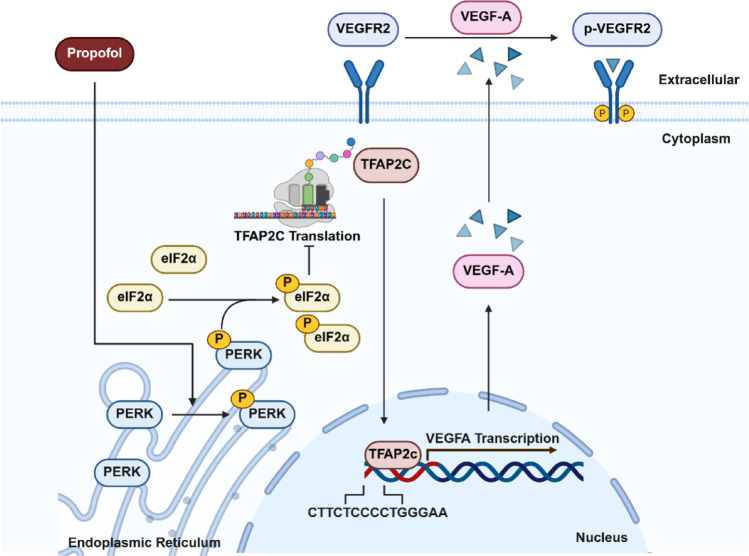 Figure 9
- —National Natural Science Foundation of China
Peer Reviews
No public reviews on file for this paper yet. If you reviewed it on a platform where reviews are public (OpenReview, ICLR, NeurIPS, ICML), you can paste yours below so the community can read it here.
Videos
No videos yet. Explain this paper in a talk, walkthrough, or lecture? Add one.
Taxonomy
TopicsCancer, Stress, Anesthesia, and Immune Response · Endoplasmic Reticulum Stress and Disease · Anesthesia and Neurotoxicity Research
Introduction
Angiogenesis refers to the formation of new capillaries from pre-existing blood vessels through endothelial cell proliferation, migration, and tube formation [1, 2]. This process is essential for maintaining normal physiological functions and facilitating tissue repair [3]. However, in certain pathological conditions such as malignant tumors [4], diabetic retinopathy [5], rheumatoid arthritis [6], and atherosclerosis [7], angiogenesis can become aberrantly activated, leading to the formation of dysfunctional blood vessels. These structurally abnormal and functionally impaired blood vessels not only fail to provide adequate perfusion but also exacerbate disease progression and pathological damage [8]. Vascular endothelial growth factor (VEGF) plays an important role in endothelial cells (ECs) as an angiogenic factor [9]. VEGFA is the most important angiogenic factor of the VEGF family, and it controls neovascularization through the VEGFR2-mediated signaling pathway [10–15]. Abnormal expression of VEGFA can lead to a variety of diseases, so VEGFA and its signaling pathway have become an important target for anti-angiogenesis therapy [16].
Anaesthesia is often accompanied by significant changes in haemodynamics, such as a decrease in blood pressure and cardiac output, which may affect tissue perfusion and vascular function [17]. The intravenous anaesthetic propofol not only affects the patients’ state of consciousness, but may also indirectly regulate tissue perfusion and microenvironment by altering the haemodynamic state, which in turn may act on ECs [18, 19]. Our previous study found that anaesthetic drugs modulate the inflammatory response, oxidative stress and barrier function of ECs [20–25]. It has also been shown that propofol disrupts the tumor angiogenic microenvironment by inhibiting the secretion of pro-angiogenic factors by tumor cells [26–29]. For example, Wang et al. identified that propofol inhibits the VEGF/VEGFR2 and mTOR/4EBP1 signalling pathway in tumor angiogenesis model in vitro [29].
Previous studies have mainly focused on the role of propofol in modulating VEGF secretion from tumor cells and their interaction with ECs. However, as indispensable participants in angiogenesis, ECs produce endogenous VEGF that plays a crucial role not only in tumors but also in other pathological conditions. Nevertheless, whether propofol directly targets ECs to regulate angiogenesis in broader pathological contexts remains to be fully elucidated, and the underlying mechanisms are not yet clear.
Previous studies have shown that propofol induces activation of endoplasmic reticulum stress (ERS) [30–33]. ERS is the accumulation of misfolded or unfolded proteins in the endoplasmic reticulum when cells are exposed to deleterious stimuli or physiological changes [34]. This process triggers signaling cascades such as activation of protein kinase R (PKR)-like endoplasmic reticulum kinase (PERK) and phosphorylation of eukaryotic initiation factor 2α (eIF2α) downstream of PERK [35–37]. While propofol is known to influence ERS, the role of ERS in angiogenesis and its potential modulation by propofol in ECs remains unexplored.
TFAP2C (also known as AP2γ), a member of the AP2 family of transcription factors, is widely involved in the biological processes of cell proliferation, differentiation and apoptosis [38–41]. Abnormal TFAP2C expression is closely associated with malignant biological behaviors such as proliferation, migration, invasion, and epithelial-mesenchymal transition (EMT) etc., and it has become one of the most important biomarkers for the assessment of tumorigenesis, progression and prognosis [42, 43]. In addition to this, the transcription factor TFAP2C reversed miR − 3656-induced damage to human umbilical vein endothelial cells (HUVECs) by promoting the transcription of Krüppel-like factor 10 (KLF10), implying that TFAP2C may have a potential protective effect on ECs [44]. However, the role of TFAP2C as a transcription factor in angiogenesis remains largely unexplored, and its regulation of VEGFA transcription has not been previously characterized.
In the current study, we investigated the direct effects of propofol on ECs–mediated angiogenesis and further explored its molecular mechanisms in vitro and in vivo. The results indicate that propofol hinders angiogenesis through the inhibition of ECs proliferation, migration, and tube formation. Mechanistically, propofol activates the ER stress–associated PERK/eIF2α pathway, which suppresses TFAP2C translation. Reduced TFAP2C levels in turn decrease its binding to the VEGFA promoter, thereby limiting VEGFA/VEGFR2-dependent angiogenesis. These findings reveal TFAP2C as a novel VEGFA transcription factor and extend the pharmacological profile of propofol beyond anesthesia, offering new avenues to inhibit VEGFA-mediated angiogenesis.
Materials and methods
Cell culture
HUVECs were obtained from Zhong Qiao Xin Zhou Biotechnology Co.Ltd.(Shanghai, China), with cells being passaged at a 1:3 ratio. Primary HUVECs were cultured in ECM (ScienCell, USA) supplemented with 10% fetal bovine serum and 1% endothelial cell growth supplement, along with 1% penicillin/streptomycin solution, under 5% CO2 at 37 °C. Passages 3 to 7 of HUVECs were used in all experiments. Human embryonic kidney 293T (HEK 293T) cells were obtained from ATCC (Gibco, USA) and cultured in DMEM medium (Gibco, USA) supplemented with 10% fetal bovine serum at 37 ◦C with 5% CO2. Using dimethyl sulfoxide (DMSO) or PBS as a solvent, propofol (1572503-500 MG, SigmaAldrich, USA), ISRIB (trans- isomer) (HY-12495, MedChemExpress, China), Rapamycin (HY-10219, MedChemExpress, China), MHY1485 (HY-B0795, MedChemExpress, China) and Bevacizumab (HY-P9906, MedChemExpress, China) were prepared as base solution according to the instructions. Propofol was administered to HUVECs at concentrations of 5, 10, 25, and 50 µM. The change of cellular RNA and protein levels were detected after 24 h incubations.
Lentivirus-mediated gene knockdown
To establish cell lines stably overexpressing TFAP2C, pcDNA3.1-TFAP2C plasmid was designed and synthesized by Guangzhou GeneReal Co. (Guangzhou, China) for TFAP2C gene overexpression, along with a negative control. The pLKO.1-CMV-copGFP-Puro (Genomeditech, Shanghai, China) plasmid was used to generate the TFAP2C shRNA constructs. Lentiviral particles were produced by transfecting the psPAX2 and pMD2.G plasmids into HEK 293T cells using Lipofectamine 2000 (Invitrogen, USA) according to the manufacturer’s protocol. Polybrene (6 µg/mL) was used to enhance lentivirus transfection efficiency, and puromycin (10 µg/mL) was used to select stably expressing cell lines. Transfection efficiency was assessed via Western blot analysis.
Cell proliferation assay
The viability of cells was detected using Edu Cell Proliferation Kit with Alexa Fluor 555 (Beyotime, C0075). HUVECs were seeded into 24-well plates (3 × 10^5^ cells/well) and treated in accordance with the manufacturer’s instructions. Finally, images were visualized and photographed using Olympus cellSens Entry.
Wound healing assay
The HUVECs were counted and seeded into a 6-well plate and cultured until 100% confluence and then synchronized with ECM basal medium containing 0.5% fetal bovine serum for 12 h. The monolayer cells were scratched with a plastic pipette; detached cells were washed away 3 times by PBS. Images of the wound were taken at 0 h and 24 h after the scratch and subsequently quantified by ImageJ software.
Transwell migration assay
The transwell migration assay was performed using 24-well cell culture inserts containing a transparent PET membrane (BD Biosciences, USA). A total of 2 × 10⁵ cells in 200 µL serum-free ECM were added to the upper chamber, and 800 µL ECM supplemented with 10% fetal bovine serum was added to the lower chamber. Following 24 h of incubation, the migrated cells on the bottom of the membrane were fixed with 4% PFA for 20 min and stained with 0.1% crystal violet for further analysis.
Tube formation assay
Matrigel (Corning, USA) was plated in 96-well plates and incubated at 37 ◦C for 30 min before seeding the HUVECs. The HUVECs were pre-synchronized with ECM basal medium containing 0.5% FBS for 12 h. Then, 1 × 10^4^ cells were counted and seeded into the solidified Matrigel and incubated for 4 h before photographing. Number of branching points and nodes were quantified using the ImageJ software.
Flow cytometry analysis
Apoptosis was determined using an Annexin V-FITC/PI Apoptosis Detection Kit (Beyotime, Shanghai, China), consistent with previously reported methods. Cells were collected and incubated with 195 µL of binding buffer. Subsequently, 5 µL of Annexin V-FITC and 10 µL of PI were added, and the incubation was carried out for 20 min at room temperature in the absence of light. The analysis of apoptosis was finally conducted using a flow cytometer.
Caspase-3 activity assay
Caspase-3 activity was measured using a Caspase-3 Activity Assay Kit (Beyotime, Shanghai, China) following the manufacturer’s protocol. Briefly, HUVECs were treated with various concentrations of propofol (0–50 µM) for 24 h and lysed on ice in the supplied lysis buffer for 15 min. After centrifugation at 16,000 × g for 10 min at 4 °C, the supernatants were collected and incubated with the Ac-DEVD-pNA substrate at 37 °C for 1 h. The release of p-nitroaniline (pNA) was measured at 405 nm using a microplate reader. Caspase-3 activity was expressed as the fold change relative to the control group.
RNA isolation and quantitative real‑time PCR (qRT‒PCR)
RNAs from HUVECs were isolated using TRNzol reagent (Tiangen Biotech, Beijing, China) with reference to the manufacturer’s protocol. The RNAs were reverse transcribed into cDNA by using PrimeScript FAST RT reagent Kit with gDNA Eraser (Takara, Beijing, China), followed by qRT‒PCR. It was conducted as stated in the manual of TB Green^®^ Premix Ex Taq™ II FAST qPCR (Takara, Beijing, China) with an Applied Biosystems 7300 Detection System (Applied Biosystems^®^, CA). The primers used are shown in Table S1.
Western blot (WB) analysis
Total protein was extracted from treated HUVECs, and protein concentrations were determined using a BCA protein assay kit (Epizyme, Shanghai, China). Equal amounts of protein samples were separated by 10% SDS-PAGE and transferred onto 0.45 μM PVDF membranes (Epizyme, Shanghai, China). Membranes were blocked with 5% non-fat milk for 2 h at room temperature and then incubated with primary antibodies overnight at 4 °C. After incubation with secondary antibodies, chemiluminescent signals were detected using a chemiluminescence imaging system and quantified with ImageJ software. The antibodies used are shown in Table S2.
Immunofluorescence (IF) staining
HUVECs were seeded into 35 mm glass-bottom culture dishes and fixed with 4% paraformaldehyde. After washing three times with PBS, the cells were blocked with 10% BSA solution at room temperature for 2 h. Primary antibodies were then added simultaneously and incubated for 12 h at 4 °C. After incubation with fluorescent secondary antibodie for 2 h, the cells were labeled with 4’,6-diamidino-2-phenylindole (DAPI). Confocal laser scanning microscopy was performed using a confocal microscope. The antibodies used are shown in Table S2.
Prediction of VEGFA-related transcription factors
To identify potential transcription factors regulating VEGFA transcription, we analyzed the VEGFA promoter region using four public databases: ENCODE, CHEA, GTRD, and JASPAR. Each database was queried independently for transcription factors predicted or experimentally validated to bind to this region. Candidate transcription factors were defined as those present in the intersection of all four databases, ensuring robust prediction.
Luciferase reporter assay
To examine the influence of TFAP2C on the activation of the VEGFA promoter, the VEGFA promoter or its truncated variants were inserted upstream of the luciferase reporter gene in the pGL3.0 Basic vector (GenePharma, Shanghai, China), as previously described in studies examining VEGF promoter activity. Stable overexpression or knockdown of HEK 293T cells and their control cells (1 × 10^5^) were seeded in a 24-well plate and cultured for 24 h. Then, cells were co-transfected with the wide-type or mutant luciferase plasmids, pRL-TK plasmid using Lipo3000TM transfection reagent. After transfection for 48 h, the luciferase activity was quantified using the Dual Luciferase Reporter Gene Assay Kit (Promega, USA). The measured Firefly luciferase activity was normalized against the Renilla luciferase activity as an internal control.
Chromatin Immunoprecipitation (ChIP)—qPCR
ChIP was performed using the ChIP assay kit (GeneCreate Biotechnology, Wuhan, China) according to the manufacturer’s instruction. Briefly, HUVECs (1 × 10^6^ cells) were cross-linked in 1% formaldehyde for 10 min at 37 °C, and then glycine solution was added to stop the reaction. After washing with pre-cold PBS buffer (supplemented with 1 mM PMSF), cells were centrifuged and lysed with SDS lysis buffer containing 1 mM PMSF. The chromatin was ultra-sonicated to fragments (200–500 bp) 10 times with 10 s ultra-sonication at 10 s intervals. The lysates were subsequently incubated with IgG or ChIP-grade antibody against TFAP2C at 4 °C overnight and then incubated with Protein A + G Agarose/Salmon Sperm DNA at 4 °C for 3 h. After washing with low salt and high salt buffer, elution, and reverse cross-linking, the DNA was added with EDTA, Tris pH 6.5, and proteinase K at 45 °C for 1 h and then was purified for qPCR analysis. The primer sequences used for ChIP-qPCR assay in the VEGFA promotor region were provided in Table S3, while the antibodies were listed in Table S2.
Protein half-life assays
The protein synthesis inhibitor cycloheximide (CHX, 100 µg/ml, SigmaAldrich) was used to treat HUVECs and evaluate protein stability. Total proteins were extracted from cells at 0-, 20-, 40-, and 60-min post CHX administration. Western blot was carried out to evaluate TFAP2C protein levels.
Puromycin intake assay
HUVECs were exposed to 50 μM propofol for a duration of 24 h. After 24 h, cells were incubated by using puromycin with final concentration of 10 µM for 30 min at 37 °C. After incubation, the levels of puromycin were detected by Western blot and immunofluorescence staining with an anti-puromycin antibody. The antibodies used in this study are listed in Table S2.
Matrigel plugs assay in vivo
All in vivo experiments were performed in 6-week-old C57BL/B6 female mice. The mice were housed in a room with controlled temperature and a 12-hour light/dark cycle, with ad libitum access to food and water. The animal protocols were approved by the IACUC of Shanghai Model Organisms Center, Inc (approval number: 2024-0072), ensuring compliance with the Guide for the Care and Use of Laboratory Animals (8th edition, National Academies Press), as stipulated in our contractual agreements.
For in vivo evaluation of angiogenesis, Matrigel plugs assay was performed in 6-week-old C57BL/B6 female mice. Mice were anesthetized and injected subcutaneously in both flanks with 0.5 mL ice-cold Matrigel (Corning, USA) mixed with 60U/ml heparin. The mice were randomly divided into control group, propofol group, propofol + ISRIB group, propofol + ISRIB + Bevacizumab group, propofol + oeTFAP2C group, propofol + oeTFAP2C + Bevacizumab group and propofol + rmVEGFA group. Mice were anesthetized and injected with 0.5 mL of ice-cold Matrigel (Corning Incorporated, USA) mixed with 60U/ml heparin subcutaneously in both abdomens. For the propofol group, 30 mg/kg of propofol was injected daily through the tail vein, and the control group was injected with an equivalent dose of 0.1% DMSO solution. Additionally, the propofol + ISRIB group was administered an additional 0.25 mg/kg of ISRIB daily via intraperitoneal injection. The propofol + oeTFAP2C group received a daily tail vein injection of lentiviral overexpression of TFAP2C concentrated 2 × 10⁷ PFU / 200 µL. Additionally, the propofol + ISRIB + bevacizumab group and the propofol + oeTFAP2C + bevacizumab group received bevacizumab at 5 mg/kg daily via intraperitoneal injection. Recombinant mouse VEGFA (rmVEGFA) was prepared in PBS containing 0.1% bovine serum albumin (BSA) to prevent protein adsorption. propofol + rmVEGFA group mice received daily tail vein injections of VEGFA at a dose of 100 µg/kg for a total of 1 injection per day. Control mice received an equal volume of PBS containing 0.1% BSA. All injections were performed under sterile conditions, and mice were monitored daily for health status and injection site reactions.
After 1 week, the Matrigel plugs were collected and measured for hemoglobin (Hb) content (Beyotime, Shanghai, China) or made paraffin-embedded.
Immunohistochemical (IHC) staining
For Matrigel plugs collected from the C57BL/B6 mice, Matrigel plugs were embedded in paraffin and cut into 4 μM sections. After the sections were dewaxed and hydrated, the tissues were treated with 3% H_2_O_2_ to block the presence of endogenous peroxidase. Antigen repair was performed using citrate buffer (pH 6.0) or TE buffer (pH 9.0). To prevent nonspecific binding, sections were blocked with normal goat serum. Primary antibodies were then applied to the tissues and incubated at 4 °C overnight. Diaminobenzidine was used for colour development and hematoxylin was used as a counterstain. Images were acquired under a light microscope and positively stained cells were analysed. The antibodies used are shown in Table S2.
Hematoxylin & Eosin (H&E) staining
The Matrigel plugs embedded in paraffin were deparaffinized and stained with haematoxylin for 10 min. After treatment with hydrochloric acid alcohol solution and ammonium hydroxide for 30 s, the samples were stained with eosin for 3 min. Increased concentrations of alcohol were used to dehydrate the sections. Next, the sections were treated with xylene three times for 3 min each. Finally, neutral balsam was used for section mounting.
Statistical analyses
Data were reported as mean ± standard deviation (SD) from at least three independent experiments unless otherwise specified. Data were analyzed by two-tailed unpaired Student t test between two groups and by oneway ANOVA followed by Bonferroni test for multiple comparisons. Statistical analysis was carried out using SPSS 16.0 for Windows. All statistical tests were two sided. significance was defined as follows: * P < 0.05; ** P < 0.01; ns, not significant.
Results
Propofol suppresses proliferation, migration and tube formation of HUVECs
To evaluate the effect of propofol on HUVECs, we incubated the cells with medium alone (control), 0.1% DMSO (solvent), and different concentrations of propofol (5–50 µM) for 24 h, and subsequently assessed cell proliferation, migration, and tube formation. The results of Edu assay showed that propofol treatment ranging from 10 to 50 µM inhibited the proliferation of HUVECs, while 5 µM propofol did not produce any significant effect on cell proliferation (Fig. 1A, B). To determine whether the reduced EdU incorporation was due to cytotoxicity, we evaluated apoptosis in HUVECs exposed to propofol. Flow cytometry analysis with Annexin V–FITC/PI staining showed no significant differences in apoptosis among the control, solvent, and 5–50 µM propofol-treated groups (Fig. S1A). Quantitative analysis demonstrated that the proportions of early apoptotic, late apoptotic, and total apoptotic cells remained comparable across all groups (Fig. S1B–D). Consistently, Caspase-3 activity assays revealed no significant change after 24 h of treatment with propofol (Fig. S1E). These results indicate that propofol does not induce apoptosis or cytotoxicity in HUVECs, suggesting that its inhibitory effect on proliferation reflects cytostatic rather than cytotoxic mechanisms.
Fig. 1. Propofol inhibits the proliferation, migration and tube-formation of HUVECs in a dose dependent manner in vitro. HUVECs cell lines were treated with different concentrations of propofol (5–50 µM), while a blank control and solvent control were set up. A,** B** Representative Edu proliferation assay images of HUVECs (A) and quantification (B). C,** D** Representative wound healing migration images of HUVECs (C) and quantification (D). E,** F** Representative transwell migration images of HUVECs (E) and quantification (F). G-I Representative tube-formation images of in vitro angiogenesis (G) and quantification of the branches points (H) and nodes (I). All data are presented as the mean ± SD from 6–12 independent experiments. *P < 0.05, **P < 0.01
The wound healing assay showed that 5–50 µM propofol inhibited the migration of HUVECs (Fig. 1C, D). As for the transwell assay, 10–50 µM propofol inhibited the migration of HUVECs per field of view compared with the control (Fig. 1E, F). These data demonstrate that propofol inhibits HUVECs migration in a concentration-dependent manner. In Fig. 1G, HUVECs from control and solvent groups showed robust and well-developed tube structures, but the addition of propofol inhibited tube formation in a concentration-dependent manner. Inhibition of tube formation by propofol is manifested by a reduction in the number of branching points (Fig. 1H) and the number of nodes (Fig. 1I). In conclusion, these data demonstrate that propofol inhibits the proliferation, migration, and tube formation of HUVECs in vitro.
Exogenous VEGFA reverses the anti-angiogenic effect of Propofol
VEGFA and FGF2 are the two most potent angiogenic factors [45]. To investigate whether the inhibitory effect of propofol on angiogenesis is mediated through the VEGFA or FGF2, we performed in vitro rescue experiments using 10 ng/mL recombinant human VEGFA (rhVEGFA) or 10 ng/mL recombinant human FGF2 (rhFGF2). The EdU assay showed that treatment with 50 µM propofol for 24 h significantly inhibited the proliferation of HUVECs. Supplementation with rhVEGFA markedly restored the proliferative capacity, whereas rhFGF2 failed to exert any rescuing effect (Fig. 2A, B). In the tube formation assay, control HUVECs formed extensive and well-organized tubular networks. This ability was markedly suppressed by 50 µM propofol, but rhVEGFA supplementation partially reversed the inhibition, as evidenced by increased numbers of branching points. In contrast, rhFGF2 did not restore tube formation (Fig. 2C, D). Similarly, wound healing and transwell assays revealed that 50 µM propofol markedly suppressed HUVECs migration, and this inhibitory effect was partially rescued by rhVEGFA but not by rhFGF2 (Fig. 2E, H).
Collectively, these data demonstrate that exogenous rhVEGFA, but not rhFGF2, can counteract the inhibitory effects of propofol, indicating that propofol suppresses angiogenesis predominantly by targeting the VEGFA rather than FGF2.
Fig. 2. Propofol inhibits angiogenesis through the VEGFA/VEGFR2 signaling pathway in vitro. HUVECs cell lines were treated with 0–50 µM propofol or 10 ng/mL rhVEGFA or rhFGF-2 for 24 h and a solvent control was set up. A,** B** Representative Edu proliferation assay images of HUVECs (A) and quantification (B). C,** D** Representative tube-formation images of in vitro angiogenesis (C) and quantification of the branches points (D). E,** F** Representative wound healing migration images of HUVECs (E) and quantification (F). G-H Representative transwell migration images of HUVECs (G) and quantification (H). I Western blot was performed to detect protein expression after treating HUVECs with different concentrations of propofol (0–50 µM) for 24 h. J,** K** Densitometric ratios for protein expression in (I) were quantified. L qPCR was performed to detect VEGFA mRNA expression after treating HUVECs with different concentrations of propofol (0–50 µM) for 24 h. All data are presented as the mean ± SD from 4–6 independent experiments. *P < 0.05, **P < 0.01
To confirm the pro-angiogenic effect of VEGFA, we treated HUVECs with 10 ng/mL rhVEGFA in vitro. The EdU assay showed that rhVEGFA significantly promoted HUVECs proliferation compared with untreated controls (Fig. S2A, B). In the tube formation assay, rhVEGFA-treated HUVECs formed more extensive and well-organized tubular networks, as indicated by an increased number of branching points relative to controls (Fig. S2C, D). Consistently, wound healing and transwell assays demonstrated that rhVEGFA markedly enhanced HUVEC motility (Fig. S2E, H). These results confirm VEGFA as a positive control for endothelial proliferation, migration, and tube formation.
Propofol downregulates the VEGFA/VEGFR2 signaling cascade
To determine the molecular mechanism by which propofol controls angiogenesis, we examined changes in the levels of the VEGFA/VEGFR2 pathway in propofol-treated HUVECs. The results indicated that treatment with 10–50 µM propofol for 24 h significantly suppressed both the protein and mRNA expression levels of VEGFA, compared to the control group (Fig. 2I, L). While 5 μM propofol did not significantly inhibit the expression level of VEGFA (Fig. 2I, L). Meanwhile, the level of VEGFR2 phosphorylation (Tyr1175) downstream of VEGFA was also inhibited after propofol treatment (Fig. 2I, L). Therefore, the inhibition of angiogenesis by propofol may mainly involve the inhibition of the VEGFA/VEGFR2 signaling pathway, thus inhibiting the proliferation, migration and tube formation of HUVECs.
TFAP2C acts as a positive transcriptional regulator of VEGFA
Considering that both mRNA and protein levels of VEGFA were altered following propofol treatment, we hypothesized that propofol could impact the transcriptional levels of VEGFA. Initially, we considered several well-known transcription factors reported to regulate VEGFA expression, including HIF-1α [46–49], SP-1 [50–52], AP-1 [53–55] and NF-κB [56–58]. However, propofol treatment did not significantly alter the protein levels of these classical regulators (Fig. S3A, D), suggesting that the observed changes in VEGFA expression were unlikely mediated through these pathways. This prompted us to explore other potential transcription factors that might be responsible for propofol-induced VEGFA regulation.
Consequently, we searched the ENCODE, CHEA, GTRD, and JASPAR databases for transcription factors that might activate VEGFA transcription. This led to the identification of five candidate: EGR1, HNF4A, REST, STAT3 and TFAP2C (Fig. 3A). We knocked down each of these five genes and observed VEGFA protein expression. Our results found that except for REST, all candidate proteins were reduced to different degrees (Fig. 3B, C). Among them, STAT3 and TFAP2C showed the most obvious degree of reduction. Given that the transcriptional regulation of VEGFA by STAT3 has been reported [56], TFAP2C was chosen as the next step of the study.
Fig. 3. Candidate transcription factors TFAP2C regulates the VEGFA/VEGFR2 signalling pathway and angiogenesis in vitro. A Multi-database joint analysis predicts five candidate transcription factors of VEGFA. B Western blot analysis shows that VEGFA protein expression levels were observed knocked down for five candidate transcription factors. C Quantification of the protein expression of VEGFA represented in (B). D Representative photomicrographs showing the expression and distribution of TFAP2C and VEGFA in HUVECs with or without TFAP2C knockdown. E Western blot analysis showed that decreased levels of VEGFA protein expression and reduced levels of VEGFR2 phosphorylation were observed in TFAP2C knockdown HUVECs cells. F Quantification of the protein expression of VEGFA, total-VEGFR2 and p-VEGFR2 (Tyr1175) represented in (E). G Quantification of the mRNA expression of VEGFA after TFAP2C knockdown. H,** I** Representative Edu proliferation assay images of HUVECs (H) and quantification (I). J-L Representative tube-formation images of in vitro angiogenesis (J) and quantification of the branches points (K) and nodes (L). M,** N** Representative wound healing migration images of HUVECs (M) and quantification (N). O,** P** Representative transwell migration images of HUVECs (O) and quantification (P). All data are presented as the mean ± SD from 3–6 independent experiments. *P < 0.05, **P < 0.01
To evaluate the knockdown and overexpression efficiency of TFAP2C in HUVECs, western blot analysis was performed. Among the three designed shRNAs targeting TFAP2C, shTFAP2C-2 exhibited the most pronounced and stable silencing effect, and was therefore selected for subsequent experiments (Fig. S3E). In contrast, TFAP2C protein levels were markedly increased in cells transfected with oe-TFAP2C compared with control and oe-NC groups (Fig. S3F). These findings confirmed the successful establishment of TFAP2C knockdown and overexpression models in HUVECs.
Immunofluorescence revealed that TFAP2C was mainly localized in the nucleus, whereas VEGFA was mainly localized in the cytoplasm, and knockdown of TFAP2C significantly reduced the expression level of VEGFA (Fig. 3D). Western blot (Fig. 3E, F) and qRT – PCR (Fig. 3G) results showed that knockdown of TFAP2C significantly reduced the activation of VEGFA/VEGFR2 signaling pathway. These results indicate that TFAP2C positively regulates VEGFA expression in HUVECs, suggesting a potential role of TFAP2C in modulating angiogenic activity.
TFAP2C knockdown inhibits angiogenesis in vitro
Ren et al. reported that deletion of the transcription factor TFAP2C was associated with ECs dysfunction in hypertension [44]. Therefore, we generated a TFAP2C knockdown HUVECs to validate the role of TFAP2C in angiogenesis. We assayed cell proliferative activity with the Edu assay, cell migration with the wound healing and transwell assay, and cell lumen forming ability with the tube formation assay. The results of Edu assay showed that cell proliferative activity was significantly decreased in HUVECs with knockdown of TFAP2C (Fig. 3H, I). TFAP2C knockdown inhibited HUVECs tube formation, which was mainly manifested as reduction in the number of branching points and the number of nodes (Fig. 3J, L). Wound healing assay showed that scratch healing was significantly slowed down in TFAP2C low-expressing cells compared with control cells (Fig. 3M, N). In addition, transwell assay showed that TFAP2C knockdown significantly inhibited the migration ability of HUVECs (Fig. 3O, P).
These results indicate that TFAP2C, a candidate gene involved in the regulation of VEGFA transcription, not only positively modulates the VEGFA/VEGFE2 signaling pathway but also enhances proliferation, migration, and angiogenesis in HUVECs in vitro.
TFAP2C binds to the VEGFA promoter sequence
Based on the above research findings, TFAP2C emerged as a potential transcription factor regulating VEGFA and was selected for further study because of its important role in angiogenesis. To construct a reporter gene plasmid, the 2000 bp sequence upstream of the VEGFA transcription start site (TSS) (Table S3) was amplified and inserted upstream of the firefly luciferase reporter gene. To reduce the influence of intrinsic variability factors on experimental accuracy, the renilla luciferase gene was constructed as a control plasmid. The TFAP2C overexpression or knockdown plasmid was co-transfected with the reporter gene plasmid and control plasmid to detect the expression of luciferase. Dual-luciferase reporter gene assay showed that overexpression of TFAP2C increased luciferase activity (Fig. 4A), whereas knockdown of TFAP2C decreased luciferase activity (Fig. 4B). JASPAR database was used to predict potential TFAP2C-binding sites in the VEGFA promoter. Starting at 2000 bp before the VEGFA TSS, four predicted TFAP2C-binding sites (826–840 bp, 935–949 bp, 1149–1163 bp, 1226–1240 bp) were present in this genomic segment (Fig. 4C). We grouped the four sequences with similar sites and designed them as Site-A (826–949 bp) and Site-B (1149–1240 bp), as shown in Fig. 4C. The dual-luciferase reporter gene assay confirmed that TFAP2C is recruited to the Site-B (1149–1240 bp) of the VEGFA promoter region, rather than the Site-A (826–949 bp, Fig. 4D). ChIP-qPCR experiments similarly showed that TFAP2C binds to the Site-B site in the chromatin region of the VEGFA promoter, but not to the predicted Site-A site (Fig. 4E–G). Given that there are two potential binding sites (1149–1163 bp, 1226–1240 bp) in the Site-B site, we designed point mutations at two potential sites (Mut-1 and Mut-2), as well as simultaneous mutations at two sites, Mut-1 & Mut-2 (Fig. 4H). The luciferase reporter gene plasmids, which contain wild-type (Site-B), mutant (Mut-1 or Mut-2), and co-mutant (Mut-1 and Mut-2) variants, were cloned into the pcDNA3.1 vector. The results of the dual luciferase reporter gene assay showed that mutations in the Mut-1 and Mut-1 & Mut-2 sequences reversed the elevated luciferase activity caused by overexpression of TFAP2C, whereas the luciferase activity of the Mut-2 sequence was unaffected (Fig. 4I). It is suggested that the 1149–1163 bp site of the VEGFA promoter is a binding region for TFAP2C binding.
Fig. 4TFAP2C binds to VEGFA promoter sequences. A,** B** Luciferase reporter gene studies of the TFAP2C and VEGFA promoters in HEK 293T cells. Cells were cotransfected with VEGFA promoter sequence plasmid (2000 bp) and TFAP2C overexpression (A) or knockdown (B) plasmid plasmid. C JASPAR database predicts putative TFAP2C binding sites identified in the promoter region of VEGFA gene. D Luciferase reporter gene studies of TFAP2C and VEGFA promoter in HEK 293T cells. Cells were co-transfected with a plasmid with a truncated VEGFA promoter sequence (Site A and Site B) and a TFAP2C overexpression plasmid. E RT-qPCR of the ChIP products confirmed the binding capacity of TFAP2C to the VEGFA promoter. F-G Binding of ChIP to PCR provides evidence that TFAP2C binds to Site A in the promoter region of the VEGFA gene. H Schematic of Site-B mutation design. I Dual-luciferase reporter assays showing that the site mutation abrogated capacity of TFAP2C to act on the VEGFA promoter region. The red “X” within the binding regions indicates altered TFAP2C binding sequences. All data are presented as the mean ± SD from 6 independent experiments. *P < 0.05, **P < 0.01
Propofol inhibits translation of TFAP2C mRNA into protein
We examined alterations in TFAP2C levels in HUVECs treated with propofol. The results showed that treatment with 10–50 µM propofol for 24 h significantly inhibited TFAP2C protein expression levels in a concentration dependent manner compared with the control group. However, 5 µM propofol did not significantly affect TFAP2C protein expression levels (Fig. 5A, B). Immunofluorescence results showed that propofol inhibited the nuclear expression of TFAP2C in a concentration-dependent manner (Fig. 5C). Interestingly, the expression level of TFAP2C mRNA in HUVECs did not decrease with the increase of propofol concentration (Fig. 5D). These data suggest that propofol does not regulate TFAP2C at the transcriptional or post-transcriptional level. Next, we added 100 µg/ml CHX to HUVECs and examined the effect of propofol on the rate of TFAP2C protein degradation. The results indicated that propofol does not significantly impact the degradation rate of the TFAP2C protein (Fig. 5E**–**F). Previous studies have shown that although protein levels are generally correlated with mRNA levels, quantitative studies have demonstrated that translation and protein degradation have a major impact on protein expression control [59]. Our results show that propofol neither affects the transcriptional or post-transcriptional regulation of TFAP2C nor its protein stability. Thus, these findings suggest that propofol regulates TFAP2C at the translational level. To investigate the effect of propofol on TFAP2C translation, we first performed a puromycin intake assay. We found a decrease in TFAP2C translation levels in propofol-treated HUVECs, as indicated by a decrease in the incorporation of protein peptides (Fig. 5G–H). The same results were obtained by immunofluorescence assay (Fig. 5I).
Fig. 5. Propofol reduces TFAP2C protein expression from the translational level. A Western blot was performed to detect TFAP2C protein expression after treating HUVECs with different concentrations of propofol (0–50 µM) for 24 h. B Densitometric ratios for TFAP2C expression in (A) were quantified. C Representative photomicrographs showing the expression and distribution of TFAP2C in HUVECs treated with different concentrations of propofol (0–50 µM) for 24 h. D RT-qPCR was performed to detect TFAP2C mRNA expression after treating HUVECs with different concentrations of propofol (0–50 µM) for 24 h. E The expression of TFAP2C in HUVECs after 100 µg/ml CHX treatment was assessed by Western blot. F Quantification of TFAP2C protein degradation according to (E). G Western blot with anti-puromycin antibody and ponceau staining on HUVECs treated with 50 µM propofol for 24 h and 10 µM puromycin for 1 h. H Quantification of puromycin labeled peptides according to (G). I Representative photomicrographs showing the expression and distribution of puromycin labeled peptides in HUVECs treated with 50 µM propofol for 24 h and 10 µM puromycin for 1 h. All data are presented as the mean ± SD from 4–6 independent experiments. *P < 0.05, **P < 0.01
TFAP2C overexpression reverses the anti-angiogenic effects of Propofol in vitro
To further verify whether TFAP2C could counteract the anti-angiogenic effect of propofol, we established TFAP2C-overexpressing HUVECs and exposed them to propofol. Western blot analysis showed that overexpression of TFAP2C significantly restored the propofol-induced reduction of VEGFA/VEGFR2 pathway (Fig. 6A, B). Functionally, EdU assays revealed that TFAP2C overexpression rescued the inhibitory effect of propofol on HUVECs proliferation (Fig. 6C, D). Consistently, tube-formation assays demonstrated that TFAP2C overexpression markedly restored tube-forming ability, as evidenced by increased branch points compared with the propofol + oeVector group (Fig. 6E, F). Similarly, transwell and wound-healing assays showed that TFAP2C overexpression reversed the suppression of migration induced by propofol (Fig. 6G–J). These findings indicate that TFAP2C overexpression rescues the propofol-induced inhibition of proliferation, migration, and tube-formation in HUVECs.
Fig. 6TFAP2C overexpression rescues propofol-induced inhibition of angiogenesis in vitro. HUVECs transfected with oe-Vector or overexpressing TFAP2C were treated with propofol for 24 h, with untreated cells serving as the control. A,** B** Western blot was performed to detect VEGFA/VEGFR2 pathway expression in different groups. C,** D** Representative EdU proliferation assay images of HUVECs (C) and quantification (D). E,** F** Representative tube-formation images of in vitro angiogenesis (E) and quantification of the branch points (F). G,** H** Representative transwell migration images of HUVECs (G) and quantification (H). I,** J** Representative wound healing migration images of HUVECs (I) and quantification (J). All data are presented as the mean ± SD from 3–6 independent experiments. *P < 0.05, **P < 0.01
Propofol suppresses TFAP2C protein expression through PERK/eIF2α-dependent ER stress
Propofol has been reported to suppress the mTOR/eIF4E signaling cascade [29]. To determine whether mTOR is involved in the observed translational repression of TFAP2C, we treated HUVECs with the mTOR inhibitor rapamycin and the activator MHY1485. Neither mTOR inhibition nor activation affected TFAP2C protein expression, suggesting that the mTOR pathway is not implicated in this process (Fig. S3G).
Previous studies have found that propofol is associated with the activation of ERS [30–33]. The PERK arm of the unfolded protein response (UPR) is a crucial signaling pathway for cellular RES. PERK-mediated phosphorylation of eIF2α employs the upstream open reading frame (the 5’ untranslated region of the mRNA) in the regulation of translation [60]. To investigate whether the PERK/eIF2α pathway is involved in the translational regulation of TFAP2C by propofol in HUVECs, we treated HUVECs with 5–50 µM propofol and assessed changes in PERK/eIF2α and its phosphorylation levels using western blot experiments. It was found that 10–50 µM propofol significantly increased the expression levels of phosphorylated PERK and eIF2α in total proteins, implying the activation of the PERK/eIF2α pathway. While 5 µM propofol did not significantly affect the percentage of p-PERK and p-eIF2α in total protein (Fig. 7A–C).
Given that transcription factor ATF4 is a canonical downstream effector of the PERK/eIF2α pathway and has been reported to transcriptionally upregulate VEGFA [61], we next examined whether ATF4 is involved in the anti-angiogenic effect of propofol. Interestingly, in our experimental system, propofol treatment significantly activated PERK and eIF2α phosphorylation but did not lead to marked changes in ATF4 protein levels (Fig. S3H).
ISRIB (trans-isomer) is a potent PERK inhibitor that effectively reverses the effects of eIF2α phosphorylation [62]. To further demonstrate that the PERK/eIF2α pathway lies upstream of TFAP2C/VEGFA, we performed rescue experiments using ISRIB. We found that 50 µM propofol inhibited TFAP2C protein expression compared with the control group, whereas inhibition of the PERK/eIF2α pathway reversed these effects (Fig. 7D, E). Furthermore, 50 µM propofol suppressed VEGFA protein expression and inhibited VEGFR2 phosphorylation levels compared with the control group, whereas inhibition of the PERK/eIF2α pathway reversed these effects (Fig. 7F, G).
Fig. 7. Propofol inhibits angiogenesis via ER stress–associated PERK/eIF2α signaling in HUVECs. HUVECs were treated with propofol or PERK/eIF2α signaling pathway inhibitors (ISRIB) for 24 h, with untreated cells serving as the control. A Western blot was performed to detect protein expression after treating HUVECs with different concentrations of propofol (0–50 µM) for 24 h. B Densitometric ratios for t-PERK and p-PERK expression in (A) were quantified. C Densitometric ratios for t-eIF2α and p-eIF2α expression in (A) were quantified. D,** E** Western blot was performed to detect TFAP2C protein expression after treating HUVECs with different concentrations of PERK/eIF2α signaling pathway inhibitors for 24 h. F,** G** Western blot was performed to detect VEGFA/VEGFR2 signaling pathway protein expression after treating HUVECs with PERK/eIF2α signaling pathway inhibitors for 24 h. H,** I** Representative EdU proliferation assay images of HUVECs (H) and quantification (I). J,** K** Representative tube-formation images of in vitro angiogenesis (J) and quantification of the branch points (K). L,** M** Representative transwell migration images of HUVECs (L) and quantification (M). N,** O** Representative wound healing migration images of HUVECs (N) and quantification (O). All data are presented as the mean ± SD from 4–6 independent experiments. *P < 0.05, **P < 0.01
To determine whether the anti-angiogenic effects of propofol were mediated by ER stress–associated PERK/eIF2α signaling in vitro, HUVECs were treated with propofol in the presence or absence of PERK/eIF2α pathway inhibitors. EdU assays demonstrated that inhibition of PERK/eIF2α signaling partially rescued the propofol-induced suppression of HUVECs proliferation (Fig. 7H, I). Consistently, tube-formation assays showed that blocking PERK/eIF2α signaling restored tube-forming capacity, as indicated by an increased number of branch points compared with cells treated with propofol alone (Fig. 7J, K). Transwell and wound-healing assays further revealed that PERK/eIF2α inhibition mitigated the propofol-induced reduction in cell migration (Fig. 7L–O). These results indicate that propofol suppresses HUVECs proliferation, migration, and tube-formation through activation of ER stress–associated PERK/eIF2α signaling.
Propofol suppresses angiogenesis through the PERK/eIF2α-TFAP2C-VEGFA axis in vivo
To evaluate the anti-angiogenic effect of propofol in vivo, Matrigel plug assays were performed. One week after subcutaneous implantation, plugs from propofol-treated mice showed markedly reduced hemoglobin content compared with controls, indicating suppressed angiogenesis (Fig. 8A, B). To test whether this effect involves the PERK/eIF2α–TFAP2C–VEGFA axis, rescue experiments were performed.
Fig. 8. Propofol inhibits angiogenesis via PERK/eIF2α-TFAP2C-VEGFA pathway in vivo. Six-week-old female C57BL/6 mice were randomly divided into control group, propofol group, propofol + ISRIB group, propofol + ISRIB + Bevacizumab group, propofol + oeTFAP2C group, propofol + oeTFAP2C + Bevacizumab group and propofol + rmVEGFA group. Matrigel plugs were collected 7 days after subcutaneous injection. A Representative image of the Matrigel plugs formed after 7 days of subcutaneous injection in 6-week-old C57BL/B6 female mice. B The Hb concentration of the Matrigel plugs were calculated. C,** D** Representative images of IHC staining for VEGFA (C) with quantitative analysis of vessel density using VEGFA positive area (D). E,** F** Representative images of IF staining for CD31 (E) with quantitative analysis of vessel density using CD31 positive area (F). G,** H** Representative photomicrographs of H&E staining from Matrigel sections (G) and cell counts under each field of view in H&E staining (H). All data are presented as the mean ± SD from 3–6 independent experiments. *P < 0.05, **P < 0.01
Pharmacological inhibition of PERK signaling or overexpression of TFAP2C partially restored hemoglobin accumulation, demonstrating that propofol-mediated angiogenesis inhibition depends on this pathway. Similarly, co-administration of rmVEGFA also rescued hemoglobin content, confirming that VEGFA is a key downstream effector (Fig. 8A, B). Importantly, VEGFA neutralization with bevacizumab abolished the rescue induced by ISRIB or TFAP2C overexpression, indicating that the anti-angiogenic effects of PERK/eIF2α–TFAP2C modulation are mediated by VEGFA.
Consistent with hemoglobin measurements, both VEGFA immunohistochemistry and CD31 immunofluorescence showed that microvessel density was significantly reduced in propofol-treated plugs. This reduction was partially rescued by ISRIB, TFAP2C overexpression, or rmVEGFA, but remained low when bevacizumab was co-administered (Fig. 8C–F). H&E staining similarly confirmed these findings (Fig. 8G–H). Together, these results demonstrate that propofol suppresses angiogenesis in vivo through the PERK/eIF2α–TFAP2C–VEGFA pathway, and that restoration of VEGFA activity is sufficient to rescue the anti-angiogenic effect.
Discussion
In this study, we provide compelling evidence that propofol directly inhibits angiogenesis in ECs through the PERK/eIF2α–TFAP2C–VEGFA/VEGFR2 signaling axis. While previous studies predominantly focused on propofol’s effects on tumor angiogenesis by modulating VEGF secretion from cancer cells, our findings demonstrate that propofol also acts directly on ECs in non-tumor contexts, expanding its pharmacological significance beyond anesthesia and tumor biology.
Propofol (2,6-dipropylphenol), a fat-soluble intravenous drug with fast onset of action, rapid recovery, and few side effects, is therefore commonly used for surgical anesthesia or intensive care [63]. Beyond its anesthetic role, propofol has been shown to modulate the inflammatory response, oxidative stress, and barrier function of ECs [20–25]. In addition, propofol has been reported to modulate VEGF expression in tumor cells and influence their interactions with ECs, thereby disrupting the tumor microenvironment [26–29]. For example, Wang et al. demonstrated that propofol suppressed VEGF/VEGFR2 signaling and affected the mTOR/eIF4E pathway in tumor–endothelial co-culture models [29]. Nevertheless, its direct effects on ECs–mediated angiogenesis in non-tumor pathological contexts remain largely unexplored. Clinically, plasma concentrations of propofol during general anaesthesia typically range from 2 to 6 µg/mL [64–68]. We selected a concentration range of 5–50 µM to encompass clinically relevant levels while permitting assessment of potential dose-dependent effects [18, 29, 69–71]. Although this range approximates the clinically achievable plasma concentrations, the in vitro setting does not account for pharmacokinetic factors such as protein binding, metabolism, and tissue partitioning, which may affect the actual bioavailable concentration in vivo.
In the current study, we found that 10, 25, and 50 µM propofol inhibited the proliferation, migration, and tube formation ability of HUVECs in a concentration-dependent manner. In contrast, propofol at 5 µM had no significant effect on the angiogenesis of HUVECs in vitro. Notably, the reduction in cell proliferation induced by propofol reflected growth arrest rather than cytotoxicity. Importantly, our in vivo Matrigel plug assay confirmed that propofol effectively suppresses angiogenesis, indicating that its anti-angiogenic effects are not limited to in vitro conditions. These findings highlight a broader role of propofol in modulating vascular remodeling under pathological conditions characterized by aberrant angiogenesis.
ECs are essential regulators of angiogenesis, and their proliferation, migration, and tube formation are tightly controlled by VEGFA/VEGFR2 signaling [15, 66]. VEGFA plays an important role in several physiological angiogenesis processes, such as the female physiological cycle and wound healing [67, 68]. Its aberrant expression or activity is closely associated with the development of various pathological conditions, such as tumors, diabetic retinopathy, and atherosclerosis, etc [14, 69, 70]. The action of VEGFA is mainly achieved through the signaling pathway of its downstream receptor, VEGFR2 [14]. VEGFR2 is a receptor tyrosine kinase that is mainly expressed on the surface of ECs [71]. VEGFA binds to VEGFR2 and activates the phosphorylation of VEGFR2 and a series of downstream signaling pathways, such as PI3K/Akt, MAPK, and PLCγ, which in turn promotes ECs proliferation, migration, and tube formation [72–75]. Consistent with earlier studies showing propofol can disrupt tumor angiogenesis, we observed that propofol treatment significantly reduced VEGFA expression and impaired VEGFR2 activation in ECs.
Given the consistent changes in mRNA and protein levels of VEGFA, we hypothesized that propofol might inhibit the transcriptional levels of VEGFA. We identified TFAP2C as a potential transcription factor related to VEGFA by public database prediction. Although the transcriptional effects of TFAP2C on VEGFA have not been reported, Ren et al. found that TFAP2C reversed ECs injury by promoting KLF10 transcription [44]. This implies that TFAP2C may have a potential protective effect on ECs. To confirm our conjecture, we knocked down TFAP2C in HUVECs and found that the proliferation, migration, and tube formation of HUVECs were attenuated. Meanwhile, knockdown of TFAP2C inhibited activation of the VEGFA/VEGFR2 signaling axis. To explore whether TFAP2C directly regulates the transcriptional activity of VEGFA in pathologic angiogenesis, we performed luciferase reporter gene and CHIP experiments. Our results revealed a direct binding of TFAP2C in the VEGFA promoter region and the binding portion is located at 1149–1163 bp of the VEGFA promoter sequence. These findings indicate that TFAP2C functions as a novel transcriptional activator of VEGFA in endothelial cells. Furthermore, our data suggest that modulation of TFAP2C activity could represent a therapeutic strategy for controlling abnormal angiogenesis in disease contexts beyond tumors, such as diabetic vascular complications or ischemic disorders.
Previous studies have found that propofol is associated with activation of the ERS signaling pathway, which refers to the accumulation of misfolded or unfolded proteins in the endoplasmic reticulum when cells are exposed to noxious stimuli or physiological changes [76]. This process triggers a series of downstream signaling cascades, such as activation of PERK/eIF2α signaling pathway [36, 37]. The eIF protein family is a group of key factors involved in the translation initiation process of eukaryotic proteins [35, 77–80]. eIF2α, a member of the eIF protein family, is also involved in the regulation of translation [77]. Yang et al. found that African swine fever virus RNA polymerase subunits C315R and H359L inhibit host translation by activating the PERK-eIF2α pathway [81]. In contrast, Wang et al. found that ADAR1 deaminase facilitated the translation process by reducing PKR-dependent eIF2α phosphorylation [82]. Previous studies have established that PERK activation during ER stress primarily regulates the classical downstream transcription factor ATF4, which mediates a variety of cellular responses to stress [83]. Interestingly, in our experimental system, although propofol robustly induces eIF2α phosphorylation, ATF4 protein levels remain unchanged, likely because ATF4 translation depends on both sufficient mRNA availability and uORF-mediated reinitiation, which can be restricted under specific stress conditions [84–88].
Instead, we identified TFAP2C as a novel downstream effector of PERK in ECs. Propofol-induced PERK activation suppressed TFAP2C translation, leading to decreased VEGFA expression and impaired VEGFR2 signaling. These findings indicate that, beyond the canonical PERK-eIF2α-ATF4 axis, alternative transcription factors such as TFAP2C may mediate the effects of ER stress on angiogenesis, revealing a previously unrecognized mechanism linking ER stress to endothelial function.
In summary, our study demonstrates that propofol directly inhibits ECs–mediated angiogenesis through the PERK/eIF2α–TFAP2C–VEGFA/VEGFR2 signaling axis. While previous studies primarily focused on the role of propofol in tumor-associated angiogenesis via modulation of VEGF secretion from cancer cells, our findings reveal that propofol acts directly on ECs in non-tumor pathological contexts, highlighting its broader pharmacological significance. Notably, propofol-induced activation of the PERK/eIF2α pathway suppresses TFAP2C translation without affecting its mRNA levels, linking ER stress to translational control of a key transcription factor. Unlike the classical PERK/eIF2α/ATF4 axis, ATF4 was not involved in this regulatory process in our system, suggesting that alternative transcription factors such as TFAP2C can serve as novel effectors of ER stress in endothelial cells. Beyond these initial findings, the identification of TFAP2C as a novel transcription factor for VEGFA opens new avenues for understanding the regulation of pathological angiogenesis. Future studies should evaluate the therapeutic potential of targeting TFAP2C in diverse disease settings characterized by abnormal vascular growth.
Supplementary Information
Below is the link to the electronic supplementary material.
Supplementary Material 1
Supplementary Material 2