Diagnostic value of combined CT artificial intelligence (AI) system and lung cancer biomarkers in pulmonary nodule evaluation
Lile Wang, Shuying You, Jianyi Zhou, Mo Liang, Ruicheng Hu

TL;DR
Combining CT AI with lung cancer biomarkers improves the accuracy of diagnosing pulmonary nodules compared to using AI alone.
Contribution
Demonstrates that combining CT AI with biomarkers significantly enhances diagnostic performance for pulmonary nodules.
Findings
The CT/AI system combined with biomarkers achieved 93% accuracy, compared to 80.5% with AI alone.
Biomarkers like CEA, NSE, and SCCA showed strong predictive value for malignancy.
Age, smoking, and chronic lung disease were significant risk factors for malignant nodules.
Abstract
To analyze the diagnostic value of a Computed Tomography (CT) artificial intelligence (AI) system combined with lung cancer biomarkers for pulmonary nodules. A retrospective analysis was conducted on 200 patients with pulmonary nodules treated at our hospital from February 2021 to January 2025. Based on pathological results, patients were divided into a benign group and a malignant group. The two groups were compared in terms of baseline data and lung cancer biomarkers, including carcinoembryonic antigen (CEA), neuron-specific enolase (NSE), cytokeratin 19 fragment 21–1 (CYFRA 21–1), squamous cell carcinoma antigen (SCCA), and pro-gastrin-releasing peptide (ProGRP). The sensitivity, specificity, accuracy, misdiagnosis rate, and missed diagnosis rate of the CT/AI system alone and in combination with lung cancer biomarkers were analyzed. There were no statistically significant…
Genes, proteins, chemicals, diseases, species, mutations and cell lines named across the full text — each resolved to its canonical identifier and authoritative record.
Click any figure to enlarge with its caption.
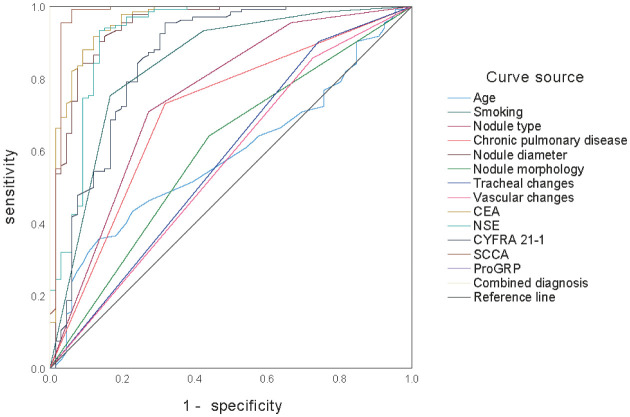 Figure 1
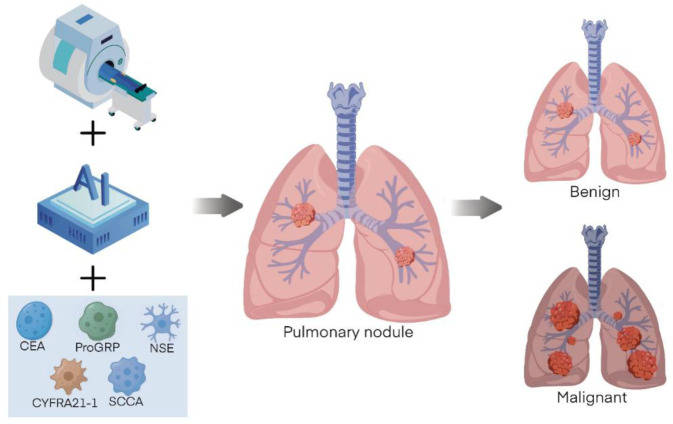 Figure 2
| Pathologic diagnosis | CT/AI | CT/AI + Lung cancer biomarkers | ||
| malignant | benign | malignant | benign | |
| Malignant (n = 66) | 47 | 19 | 61 | 5 |
| Benign (n = 134) | 20 | 114 | 9 | 125 |
| Diagnostic method | Sensitivity | Specificity | Accuracy rate | Misdiagnosis rate | Miss rate |
| CT/AI | 71.21 | 85.07 | 80.50 | 19.50 | 28.79 |
| CT/AI + Lung Cancer biomarkers | 92.42 | 93.28 | 93.00 | 7.00 | 7.58 |
|
| 9.982 | 4.679 | 13.594 | 13.594 | 9.982 |
| P | 0.002 | 0.031 | <0.001 | <0.001 | 0.002 |
| Item | Benign group (n = 134) | Malignant group (n = 66) |
|
| |
| Sex | Male | 84 | 40 | 0.081 | 0.776 |
| Female | 50 | 26 | |||
| Age (years) | 56.54 ± 10.16 | 59.59 ± 8.85 | 2.080 | 0.039 | |
| Smoking (years) | No | 101 | 11 | 78.069 | <0.001 |
| 1–9 | 24 | 17 | |||
| 10–20 | 7 | 22 | |||
| >20 | 2 | 16 | |||
| Chronic pulmonary disease | No | 98 | 21 | 31.325 | <0.001 |
| Yes | 36 | 45 | |||
| Nodule type | SN | 95 | 18 | 44.462 | <0.001 |
| mGGN | 33 | 26 | |||
| pGGN | 6 | 22 | |||
| Nodule diameter (cm) | 4.67 ± 1.24 | 8.67 ± 2.35 | 15.768 | <0.001 | |
| Nodule morphology | Rules | 86 | 29 | 7.413 | 0.006 |
| Irregularities | 48 | 37 | |||
| Lobulated | No | 108 | 46 | 2.967 | 0.085 |
| Yes | 26 | 20 | |||
| Spiculation | No | 112 | 48 | 3.256 | 0.071 |
| Yes | 22 | 18 | |||
| SPN | No | 70 | 40 | 1.251 | 0.263 |
| Yes | 64 | 26 | |||
| Tracheal changes | No | 121 | 49 | 8.941 | 0.003 |
| Yes | 13 | 17 | |||
| Vascular changes | No | 115 | 48 | 5.028 | 0.025 |
| Yes | 19 | 18 | |||
| Average CT (HU) | 40.29 ± 8.36 | 38.49 ± 7.70 | 1.469 | 0.144 |
| Item | Benign group (n = 134) | Malignant group (n = 66) |
|
|
| CEA (ng/mL) | 2.81 ± 1.23 | 7.34 ± 2.26 | 18.367 | <0.001 |
| NSE (ng/mL) | 15.67 ± 4.35 | 28.39 ± 7.16 | 15.563 | <0.001 |
| CYFRA21–1 (ng/mL) | 2.08 ± 0.79 | 3.74 ± 1.35 | 10.943 | <0.001 |
| SCCA (µg/mL) | 2.62 ± 0.57 | 5.73 ± 1.40 | 22.279 | <0.001 |
| ProGRP (pg/mL) | 31.50 ± 7.35 | 75.27 ± 10.36 | 34.416 | <0.001 |
| Variable |
|
|
|
|
| 95% |
| Age | 1.041 | 0.524 | 3.791 | 2.832 | 0.032 | 1.654–5.578 |
| Smoking >20 years | 3.301 | 0.458 | 15.737 | 27.127 | <0.001 | 23.758–32.672 |
| Chronic pulmonary disease | 1.541 | 0.367 | 11.441 | 4.670 | <0.001 | 9.615–16.783 |
| pGGN | 0.700 | 0.507 | 2.723 | 2.013 | 0.071 | 1.236–3.127 |
| Nodule diameter | 2.522 | 0.678 | 5.486 | 12.452 | 0.016 | 10.479–15.350 |
| Nodule irregularities | 1.976 | 0.480 | 8.576 | 7.215 | <0.001 | 6.829–11.435 |
| Tracheal changes | 1.792 | 0.427 | 9.828 | 6.002 | <0.001 | 8.769–12.340 |
| Vascular changes | 2.117 | 0.519 | 7.859 | 8.310 | <0.001 | 7.560–10.738 |
| CEA | 0.666 | 0.489 | 2.785 | 1.947 | 0.058 | 1.345–2.770 |
| NSE | 1.446 | 0.403 | 8.903 | 4.245 | <0.001 | 3.261–7.249 |
| CYFRA21–1 | 3.140 | 0.678 | 6.831 | 23.106 | 0.001 | 21.098–29.560 |
| SCCA | 1.685 | 0.336 | 14.925 | 5.393 | <0.001 | 4.347–10.234 |
| ProGRP | 0.162 | 0.410 | 0.964 | 1.176 | 0.783 | 0.867–2.430 |
| Variable | AUC | Sensitivity (%) | Specificity (%) | Significance | 95% |
| Age | 0.586 | 35.80 | 86.40 | 0.016 | 0.516–0.655 |
| Smoking | 0.840 | 75.40 | 83.30 | <0.001 | 0.791–0.889 |
| Nodule type | 0.750 | 70.90 | 72.70 | <0.001 | 0.691–0.809 |
| Chronic pulmonary disease | 0.707 | 73.10 | 69.20 | <0.001 | 0.643–0.770 |
| Nodule diameter | 0.944 | 90.30 | 86.40 | <0.001 | 0.916–0.973 |
| Nodule morphology | 0.601 | 64.20 | 56.10 | 0.004 | 0.533–0.669 |
| Tracheal changes | 0.580 | 90.30 | 25.80 | 0.024 | 0.512–0.649 |
| Vascular changes | 0.565 | 85.80 | 27.30 | 0.065 | 0.497–0.634 |
| CEA | 0.958 | 91.80 | 87.90 | <0.001 | 0.934–0.981 |
| NSE | 0.922 | 93.30 | 86.40 | <0.001 | 0.887–0.957 |
| CYFRA21–1 | 0.856 | 95.50 | 68.20 | <0.001 | 0.809–0.903 |
| SCCA | 0.978 | 99.30 | 93.90 | <0.001 | 0.958–0.998 |
| ProGRP | 0.990 | 99.30 | 100.00 | <0.001 | 0.975–1.000 |
| Combined diagnosis | 0.993 | 99.30 | 100.00 | <0.001 | 0.986–1.000 |
Peer Reviews
No public reviews on file for this paper yet. If you reviewed it on a platform where reviews are public (OpenReview, ICLR, NeurIPS, ICML), you can paste yours below so the community can read it here.
Videos
No videos yet. Explain this paper in a talk, walkthrough, or lecture? Add one.
Taxonomy
TopicsLung Cancer Diagnosis and Treatment · Radiomics and Machine Learning in Medical Imaging · Lung Cancer Research Studies
Introduction
Pulmonary nodules are solid or subsolid localized areas of increased density within the lung that are detected during chest X-ray or CT examinations. They can be caused by various factors, including pulmonary inflammation, granulomatous diseases, and abnormal cellular proliferation [1]. Among them, benign nodules account for approximately 80%–90% of all detected pulmonary nodules, while the detection rate of malignant nodules is closely related to the duration of smoking and increasing age [2],[3]. Vindum et al. [4] conducted a retrospective cohort study involving 4181 patients with pulmonary nodules and found that only 6% of pulmonary nodules developed into lung cancer over a three-year CT follow-up period, and 77.9% of lung cancer patients were able to receive curative treatment. This suggests that timely diagnosis through CT in the early or precancerous stages of lung cancer can effectively improve early prognosis and help control disease progression. Artificial intelligence (AI) can analyze, summarize, and model massive amounts of data using different algorithms and behavior simulations to intelligently integrate the pathological characteristics and biological manifestations of specific diseases. This enables AI to be widely applied in many medical fields, including oncology and radiological imaging [5].
However, the early onset of lung cancer is characterized by concealment and complexity. When the lesion is less than 3 cm in diameter, its impact on lung function is not obvious, and relying solely on a CT/AI system to determine the nature of pulmonary nodules may still result in missed or incorrect diagnoses, thereby affecting the prevention and treatment of precancerous lesions or early-stage lung cancer [6]. Carcinoembryonic antigen (CEA) is a common tumor marker, and a meta-analysis of non-small cell lung cancer (NSCLC) [7] showed that CEA is significantly associated with epidermal growth factor receptor (EGFR) mutations and lung cancer staging. Neuron-specific enolase (NSE) is a glycolytic enzyme primarily distributed in neuronal cells that has high diagnostic and predictive value for small cell lung cancer (SCLC) and tumors of the nervous system [8]. Additionally, NSE, together with other tumor markers such as cytokeratin 19 fragment 21–1 (CYFRA21–1) and squamous cell carcinoma antigen (SCCA), can be used in the diagnosis of different types of lung cancer [9]. However, it has been suggested [10] that the sensitivity and specificity of NSE are inferior to those of pro-gastrin-releasing peptide (ProGRP), indicating that its diagnostic value for pulmonary nodules or lung cancer remains limited. Based on this, the present study analyzes the value of combining a CT/AI system with lung cancer biomarkers in diagnosing pulmonary nodules, with the aim of improving the diagnostic accuracy of malignant pulmonary nodules and early-stage lung cancer, thereby optimizing clinical outcomes.
Subjects and methods
Study subjects
2.1.
A total of 200 patients with pulmonary nodules treated at our hospital from February 2021 to January 2025 were selected for retrospective analysis. All study data were collected during treatment or follow-up periods. Among them, there were 124 males and 76 females, aged 35–82 years, with a mean age of 57.55 ± 9.83 years.
(1) Inclusion criteria: ① Patients aged ≥18 years who provided signed informed consent and whose participation was approved by the hospital ethics committee. ② Presence of pulmonary nodules confirmed by chest CT or X-ray examination. ③ Use of AI-assisted systems during the diagnostic process for pulmonary nodules. ④ Availability of pathological and lung cancer-related examination results, such as sputum cytology, percutaneous lung biopsy, and tumor markers for lung cancer. ⑤ Newly diagnosed patients without a history of cardiothoracic surgery, radiotherapy, chemotherapy, immunotherapy, or targeted therapy.
(2) Exclusion criteria: ① Presence of malignancies in other sites, congenital immunodeficiency diseases, or hematological disorders. ② Combined with acute cerebral infarction (ACI), craniocerebral trauma, sepsis-associated encephalopathy, Alzheimer's disease (AD), epilepsy, or other neurologically impairing conditions. ③ Severe anemia, malnutrition, or active gastrointestinal bleeding, such as gastric or duodenal ulcer or erosive esophagitis. ④ Presence of infectious diseases, severe cardiovascular or cerebrovascular diseases, hemodynamic instability, or severe hepatic or renal dysfunction. ⑤ Incomplete clinical, imaging, or pathological data, or women who were pregnant or breastfeeding. ⑥ Patients with implanted stents or metallic devices in the body.
Examination methods
2.2.
CT/AI examination
2.2.1.
All patients underwent examination using the NeuViz 128 In-Mobile multi-slice spiral CT system (Neusoft Medical Systems Co., Ltd.). Before the scan, patients were instructed to remove any metal objects from their body and lie supine on the CT table. Under the guidance of the technician, patients were asked to take a deep breath and hold it to ensure full lung expansion. After positioning, images were obtained, and plain scanning was performed from the lower neck to the diaphragm, covering a range of approximately 35–40 cm. The scanning parameters were as follows: tube voltage 120 kV, tube current 220–300 mA, pitch 0.5–1.0 mm, slice thickness 1.0 mm, reconstruction interval 1.0 mm. The lung window was set to a width of 1700 HU and a level of –650 HU, and the mediastinal window to a width of 320 HU and a level of 35 HU. Following plain scanning, 50–100 mL of iodine-based contrast agent could be administered as appropriate, at a flow rate of 3 mL/s, for contrast-enhanced scanning of the nodule. After the scan, imaging data were imported into the AI-assisted diagnostic system (Shukun Technology Co., Ltd.). Using a high-spatial-resolution sharp algorithm, the system intelligently analyzed features such as nodule vascular supply and vessel traversal, size, type, edge characteristics, and average CT value. These results were combined with radiologists' image interpretations and lung cancer biomarker levels to determine the nature of the pulmonary nodules.
Grouping criteria
2.2.2.
Risk stratification of pulmonary nodules was performed according to the Chinese Expert Consensus on the Diagnosis of Early Lung Cancer (2023 Edition) and the 2015 British Thoracic Society (BTS) guidelines [11],[12].
According to the Brock model, nodules with a malignancy probability <10% (solid or subsolid) were defined as low risk, and annual CT follow-up was recommended; nodules with a malignancy probability of 10%–70% were defined as intermediate risk, requiring enhanced CT or tissue biopsy for qualitative assessment, followed by CT review every 3–6 months; nodules with a malignancy probability >70% were defined as high risk, for which histological diagnosis was strongly recommended, followed by appropriate surgical, radiotherapeutic, or chemotherapeutic management based on the results.
Detection of lung cancer biomarkers
2.2.3.
Five milliliters of venous blood were drawn from each patient and centrifuged at 3000 rpm for 10 minutes (centrifuge radius 10 cm). After standing, the supernatant was collected. Carcinoembryonic antigen (CEA), neuron-specific enolase (NSE), and cytokeratin 19 fragment 21–1 (CYFRA21–1) were measured using chemiluminescence immunoassay, while squamous cell carcinoma antigen (SCCA) and pro-gastrin-releasing peptide (ProGRP) were measured using enzyme-linked immunosorbent assay (ELISA). All reagents were purchased from Shenzhen New Industries Biomedical Engineering Co., Ltd., and concentrations were uniformly measured using the Stream SuperB-800 fully automated biochemical analyzer (Guangzhou DaAn Gene Co., Ltd.). Reference ranges for each marker were based on the recommended values provided by the assay methods.
Observation indicators
2.3.
Basic patient data were collected, including sex, age, smoking history, chronic lung disease, nodule type, nodule diameter, and nodule morphology. Referring to the Chinese Expert Consensus on the Diagnosis of Early Lung Cancer (2023 Edition) [11] and the Chinese Expert Consensus on Diagnosis and Treatment of Pulmonary Nodules (2024 Edition) [13], and using pathological results as the gold standard, the sensitivity, specificity, accuracy, misdiagnosis rate, and missed diagnosis rate of the CT/AI system alone and combined with lung cancer biomarkers in diagnosing pulmonary nodules were analyzed. Sensitivity was calculated as true positives / (true positives + false negatives) × 100%; specificity as true negatives / (true negatives + false positives) × 100%; accuracy as (true positives + true negatives) / total number × 100%; misdiagnosis rate as (false negatives + false positives) / total number × 100%; and missed diagnosis rate as false negatives / confirmed cases × 100%.
Statistical analysis
2.4.
Data were corrected and processed using SPSS version 27.0 software. Count data were recorded as n (%), and comparisons between two independent sample rates or composition ratios were analyzed using the chi-square test. Multiple group comparisons were performed using the z-test. Measurement data were expressed as mean ± standard deviation (±SD) and analyzed with the grouped t-test. Multivariate logistic regression analysis was used to identify risk factors for malignant pulmonary nodules. The predictive value of various indicators for malignant pulmonary nodules was assessed using the area under the receiver operating characteristic (ROC) curve (AUC). A p-value < 0.05 was considered statistically significant.
Results
Analysis of diagnostic performance of the CT/AI system combined with lung cancer biomarkers
3.1.
Using pathological results as the reference standard, among the 200 patients, 66 had malignant nodules and 134 had benign nodules. The CT/AI system detected 67 cases of malignant pulmonary nodules, while the CT/AI system combined with lung cancer biomarkers detected 70 cases. The diagnostic sensitivity, specificity, accuracy, misdiagnosis rate, and missed diagnosis rate of the combined method were all significantly better than those of the CT/AI system alone (P < 0.05), as shown in Tables 1 and 2.
Comparison of baseline data
3.2.
There were no statistically significant differences between the two groups in terms of sex, lobulation sign, spiculation sign, solitary pulmonary nodule (SPN), or average CT value (P > 0.05). However, the benign group showed significantly lower values in age, years of smoking, chronic lung disease, pure ground-glass nodules (pGGN), nodule diameter, irregular nodules, bronchial changes, and vascular changes compared to the malignant group, with all differences reaching statistical significance (P < 0.05), as shown in Table 3.
Comparison of lung cancer biomarkers between the two groups
3.3.
The levels of CEA, NSE, CYFRA21–1, SCCA, and ProGRP in the benign group were all significantly lower than those in the malignant group, with the differences being statistically significant (P < 0.05), as shown in Table 4.
Multivariate logistic analysis of malignant pulmonary nodules
3.4.
Logistic regression analysis showed that age, smoking duration over 20 years, chronic lung disease, nodule diameter, irregular nodules, bronchial changes, vascular changes, NSE, CYFRA21–1, and SCCA were all risk factors for malignant pulmonary nodules (P < 0.05), as shown in Table 5.
ROC curve analysis of each indicator for predicting malignant pulmonary nodules
3.5.
ROC curve analysis showed that age, nodule type, chronic lung disease, nodule morphology, bronchial changes, and vascular changes had moderate predictive value for malignant pulmonary nodules, with AUCs of 0.586, 0.750, 0.707, 0.601, 0.580, and 0.565, respectively. Smoking history, nodule diameter, CEA, NSE, CYFRA21–1, SCCA, and ProGRP demonstrated better predictive value, with AUCs of 0.840, 0.944, 0.958, 0.922, 0.856, 0.978, and 0.990, respectively. The combined diagnosis of all indicators achieved an AUC of 0.993, as shown in Figure 1 and Table 6.
ROC curve analysis of each indicator for predicting malignant pulmonary nodules.
Discussion
The clinical application value of the CT/AI system for pulmonary nodules
4.1.
Among the 200 cases of pulmonary nodules analyzed in this study, malignant nodules accounted for 33%, indicating that most pulmonary nodules do not develop into lung cancer. However, because of the significant differences in management strategies between general practitioners and specialists, their assessments of the nature and histological types of pulmonary nodules are often inconsistent [14]. Meanwhile, conventional CT has relatively low sensitivity for determining the nature of pulmonary nodules, and pathological biopsy is an invasive procedure with low efficiency [15]. Compared with traditional methods of pulmonary nodule classification and characterization, the CT/AI system represents a diagnostic approach that integrates efficient and scientific network information technology with radiological imaging. It not only combines multiple imaging features of lesions, shortens diagnostic time, and enables standardized multi-parameter and multi-modality sharing as well as the construction of specific pathological models, but also enhances clinical diagnostic performance and reduces redundant screening and diagnostic harm [16],[17].
Moreover, through techniques such as cluster analysis, image filtering adjustments, reinforcement learning, and decision trees, AI systems can provide precise predictions for CT-based lung cancer diagnosis, pathological markers, surgery, recurrence, and metastasis, significantly improving the image interpretation efficiency of pathologists and radiologists. In addition, employing AI systems as decision-support tools in conjunction with CT can further promote the application of low-dose chest CT, enabling optimal feature, parameter, and model selection for the clinical prevention and management of precancerous lesions, thereby enhancing the early detection rate of lung cancer [18],[19]. However, different studies [20],[21] have indicated that due to insufficient cytological data training and low resolution in distinguishing mixed ground-glass nodules (mGGN), AI-assisted CT evaluation of pulmonary nodules may still misclassify nodule nature. This finding suggests that AI technology, as a general decision-support tool, can only provide a relatively superficial analysis of CT-related parameters of pulmonary nodules. In particular, when patients present with multiple pulmonary diseases, excessive reliance on AI may fail to accurately distinguish overlapping and complex imaging manifestations, potentially misleading clinicians' judgment.
Role and value of lung cancer biomarkers
4.2.
Carcinoembryonic antigen (CEA) is an important early warning indicator for early-stage cancer and tumor recurrence; in a considerable proportion of post-operative cancer patients whose imaging follow-ups show no abnormalities, significant elevation of CEA usually indicates a higher risk of recurrence [22]. Kuo et al. [23], through cellular experiments and multivariate analysis, demonstrated a significant positive correlation between CEA expression and tumor metastasis, and found that CEA helps guide adjustments to radiotherapy and chemotherapy regimens and monitor prognosis. A related meta-analysis [24] also showed that CEA and CYFRA21–1 have strong practicality and objectivity in assessing treatment efficacy and tumor staging response. This is because CEA serves as a specific targeting system in radiotherapy, capable of reflecting tumor cell activity in real time (including cell morphology, size, and proliferation rate), thereby avoiding insufficient or excessive radiation doses that may affect clinical efficacy [25]. Therefore, the sensitivity, specificity, accuracy, misdiagnosis rate, and missed diagnosis rate of the CT/AI system combined with lung cancer biomarkers were all significantly better than those of the CT/AI system alone.
In addition, Rumende et al. [26] studied the one-year survival rate of patients with advanced non-small cell lung cancer (NSCLC) and found that higher CYFRA21–1 levels were associated with shorter survival times and poorer chemotherapy tolerance. Therefore, CYFRA21–1 has considerable predictive potential for tumor progression and remission. Neuron-specific enolase (NSE) is a specific marker of neuroendocrine cells, with a positive diagnostic rate of up to 90% in NSCLC. NSE not only effectively differentiates NSCLC from small cell lung cancer (SCLC) but also assesses the impact of chemotherapy on the neuroendocrine system of patients [27]. These findings indicate that CEA, CYFRA21–1, and NSE have strong predictive potential for tumor progression and remission, and that lung cancer biomarker detection can effectively compensate for the limitations of the CT/AI system.
In the study by Trulson et al. [28], the combined diagnostic AUC for NSE, CEA, and CYFRA21–1 was 0.93; for ProGRP and NSE, it was 0.89; and for NSE and CEA, it was 0.86. In this study, the combined AUC of all indicators was 0.993, with sensitivity and specificity both exceeding 90%, and individual predictive values of CEA, NSE, CYFRA21–1, SCCA, and ProGRP all greater than 0.80. These findings suggest that combining CT/AI systems with lung cancer biomarkers offers strong flexibility and feasibility for diagnosing pulmonary nodules, allowing for various combination strategies based on clinical needs. For example, Hou et al. [29] extracted imaging features of lesions using the CT/AI system and combined them with patients' clinical characteristics and markers such as CEA and CYFRA21–1 to diagnose pulmonary nodules, significantly improving the predictive probability of malignancy and enhancing the accuracy of surgical decision-making.
Value and limitations of the CT/AI system combined with lung cancer biomarkers
4.3.
Typically, malignant nodules exhibit significantly faster growth rates, larger diameters or average volume on CT, and more pronounced bronchial and vascular changes compared to benign nodules. Some patients may also present with symptoms such as cough with sputum, fever, and chest pain [30]. However, ROC curve analysis indicated that age, nodule type, chronic lung disease, nodule morphology, bronchial changes, and vascular changes have only moderate predictive value for malignant pulmonary nodules, which is related to the heterogeneity and variability of pulmonary nodules. Additionally, cases with rapid growth or new nodules detected during follow-up are not always malignant [31]. For example, pulmonary fibromas, hamartomas, and inflammatory nodules, although sometimes larger in size and associated with elevated lung cancer biomarkers, are benign and have favorable prognoses [32]. Conversely, nodules smaller than 5 mm exhibiting pleural retraction, spiculation, or lobulation signs—especially with deep lobulation—have a high probability of malignancy and poorer prognosis [33]. Moreover, AI analysis of the dynamic changes in biomarkers such as CYFRA21–1, CEA, and NSE before, during, and after treatment, as well as during follow-up, can help establish survival models and databases for different lung cancer types, providing scientific evidence for intervention strategies at various stages of pulmonary nodule development [34]. Therefore, diagnosing the nature of pulmonary nodules through the combined use of CT/AI systems and lung cancer biomarkers is of great necessity.
A multicenter retrospective study [35] confirmed that dynamic monitoring of serum tumor markers in lung cancer patients not only improves the treatment efficacy for squamous cell carcinoma and adenocarcinoma but also enhances patients' quality of life and reduces treatment costs. Additionally, the CT/AI system can effectively identify the type of pulmonary nodules and predict the occurrence and progression of other chronic lung diseases, thereby supporting public health improvement [36]. It should be noted, however, that several limitations remain in the combined detection using CT/AI systems and lung cancer biomarkers: (1) most patients detected with pulmonary nodules do not adhere to standardized and complete CT/AI or biomarker follow-up plans before the disease progresses to lung cancer [37],[38]; (2) for patients undergoing immunotherapy or targeted therapy, changes in ProGRP, CEA, NSE, SCCA, and CYFRA21–1 are influenced by multiple factors, which may interfere with test results and increase false-positive rates; (3) although AI technology offers significant advantages in identifying typical CT features of pulmonary nodules and in summarizing and extracting relevant parameters, the absence of unified standards limits its ability to perform deep understanding and comprehensive judgment of complex cases [39]; and (4) the generalizability of CT/AI system models is insufficient [40],[41], as variations in CT equipment, scanning parameters, individual differences, and serum testing methods can all impact the accuracy of CT/AI combined biomarker diagnosis.
Conclusions
The combined use of CT/AI systems and lung cancer biomarkers demonstrates high predictive value for determining the nature of pulmonary nodules (Figure 2), and the occurrence of malignant nodules is mainly associated with risk factors such as age, smoking, and chronic lung disease. Clinically, targeted interventions can be implemented based on these factors to control the development and progression of lung cancer. However, AI technology currently serves only as an auxiliary decision-support tool and still has notable limitations in clinical applications. To achieve widespread, accurate, real-time, and continuous prediction and targeted treatment of malignant pulmonary nodules, it is necessary to continuously optimize CT/AI systems and strengthen AI dataset training while ensuring patient privacy, thereby further improving the flexibility, simplicity, and accuracy of combined diagnostic approaches.
CT/AI systems and lung cancer biomarkers demonstrate high predictive value for determining the nature of pulmonary nodules.
The reference list from the paper itself. Each links out to its DOI / PubMed record.
- 1Huang G Wei X Tang H A systematic review and meta-analysis of diagnostic performance and physicians' perceptions of artificial intelligence (AI)-assisted CT diagnostic technology for the classification of pulmonary nodules J Thorac Dis 2021134797481110.21037/jtd-21-81034527320 PMC 8411165 · doi ↗ · pubmed ↗
- 2Chen D Yang L Zhang W Prevalence and management of pulmonary nodules: a systematic review and meta-analysis J Thorac Dis 2024164619463210.21037/jtd-24-87439144359 PMC 11320231 · doi ↗ · pubmed ↗
- 3Weir-Mc Call JR Joyce S Clegg A Dynamic contrast-enhanced computed tomography for the diagnosis of solitary pulmonary nodules: a systematic review and meta-analysis Eur Radiol 2020303310332310.1007/s 00330-020-06661-832060716 · doi ↗ · pubmed ↗
- 4Vindum HH Kristensen K Christensen NL Outcome of Incidental Pulmonary Nodules in a Real-World Setting Clin Lung Cancer 20232467368110.1016/j.cllc.2023.09.00337839963 · doi ↗ · pubmed ↗
- 5Tandon YK Bartholmai BJ Koo CW Putting artificial intelligence (AI) on the spot: machine learning evaluation of pulmonary nodules J Thorac Dis 2020126954696510.21037/jtd-2019-cptn-0333282401 PMC 7711413 · doi ↗ · pubmed ↗
- 6de Margerie-Mellon C Chassagnon G Artificial intelligence: A critical review of applications for lung nodule and lung cancer Diagn Interv Imaging 2023104111710.1016/j.diii.2022.11.00736513593 · doi ↗ · pubmed ↗
- 7Gan T An W Long Y Correlation between carcinoembryonic antigen (CEA) expression and EGFR mutations in non-small-cell lung cancer: a meta-analysis Clin Transl Oncol 202426991100010.1007/s 12094-023-03339-738030870 · doi ↗ · pubmed ↗
- 8Liu D Wu D Ni J NSE and Pro GRP Are Promising Markers for Diagnosis, Efficacy Evaluation, Follow-Up Monitoring, and Prognosis of Small Cell Esophageal Carcinoma Thorac Cancer 202516 e 7002610.1111/1759-7714.7002639993944 PMC 11850090 · doi ↗ · pubmed ↗