A public resource of 15 genomically characterized representative strains of Shigella sonnei
Sydney L. Miles, Jane Hawkey, Ben Vezina, Vincenzo Torraca, Claire Jenkins, François-Xavier Weill, Stephen Baker, Kate S. Baker, Serge Mostowy, Kathryn E. Holt

TL;DR
Researchers created a public collection of 15 diverse Shigella sonnei strains with full genome data to better study this disease-causing bacterium.
Contribution
The study provides a publicly accessible set of genomically characterized S. sonnei strains representing current diversity and including the pINV plasmid.
Findings
The 15 S. sonnei strains represent diverse phylogenetic lineages and epidemiological patterns.
Complete genome sequences reveal ongoing adaptive evolution through insertion sequences and structural changes.
The pINV invasion plasmid was preserved in these isolates, unlike many public datasets.
Abstract
Shigella sonnei is rapidly emerging as the dominant agent of shigellosis, an enteric disease responsible for a significant burden of morbidity and mortality worldwide. Whole-genome sequencing of S. sonnei isolated over the last three decades has revealed phylogenomic diversity within the population and the emergence of multiple lineages associated with distinct epidemiological patterns such as resistance to critical antimicrobials and/or transmission within different groups. However, most experimental work on S. sonnei biology and pathogenicity has focused on a single laboratory strain (53G), which is phylogenetically distant from currently circulating strains. Here, we introduce a set of phylogenetically diverse and epidemiologically relevant S. sonnei isolates made available through publicly accessible culture collections as a resource for laboratory science. We present their complete…
Genes, proteins, chemicals, diseases, species, mutations and cell lines named across the full text — each resolved to its canonical identifier and authoritative record.
Click any figure to enlarge with its caption.
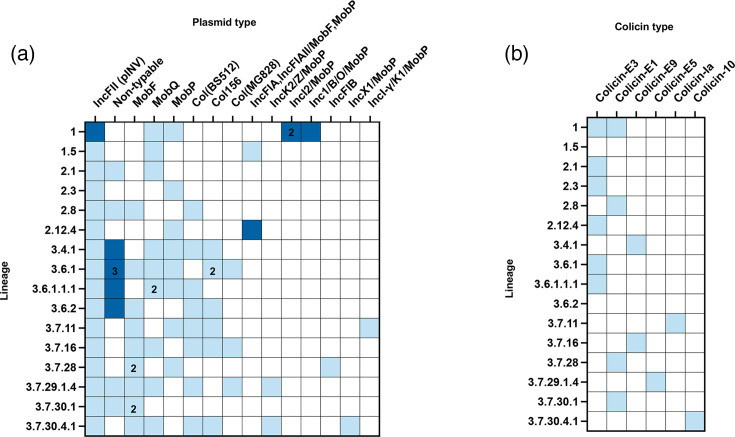 Fig. 1
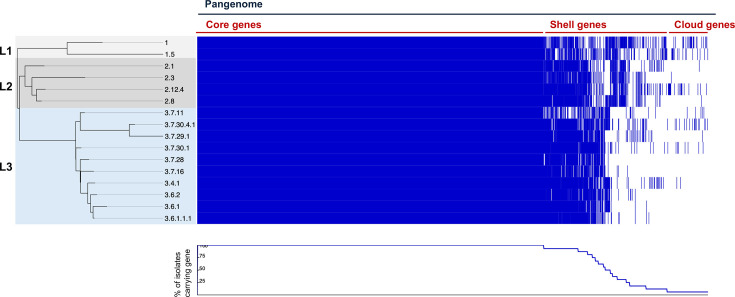 Fig. 2
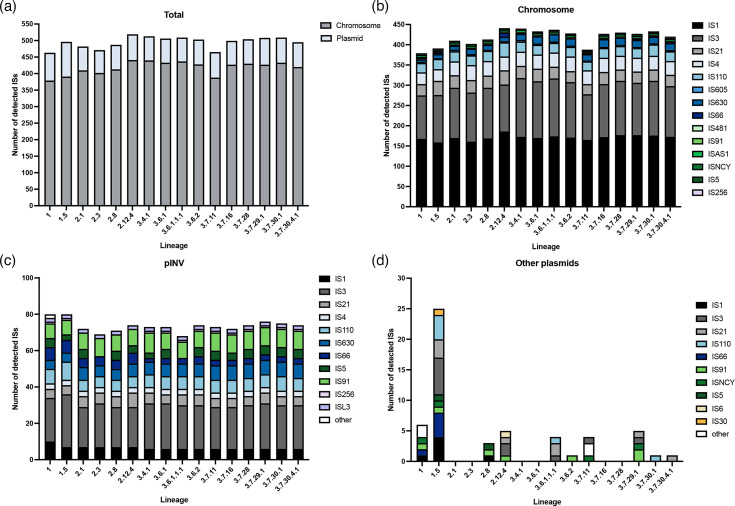 Fig. 3
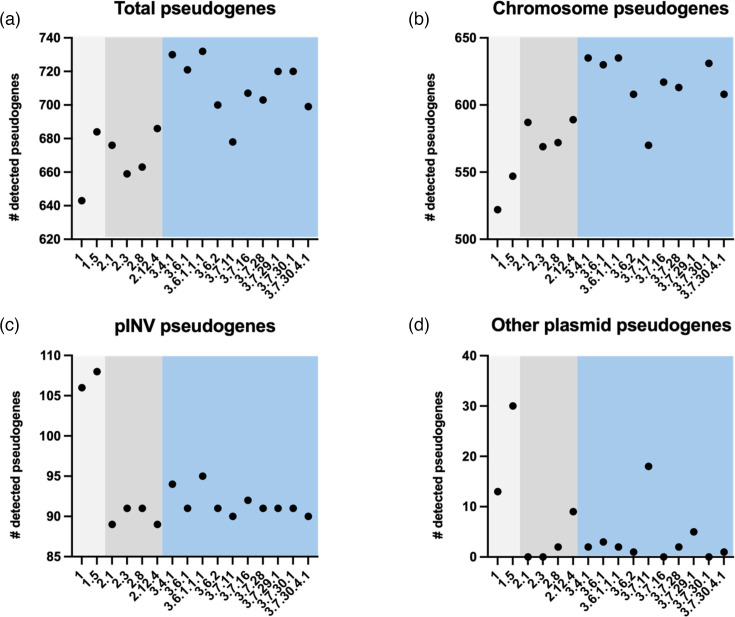 Fig. 4
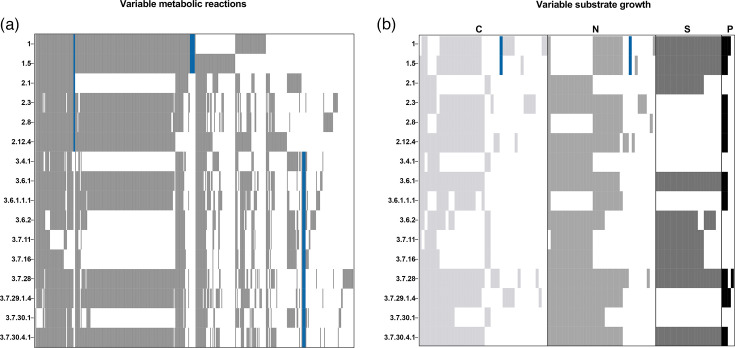 Fig. 5
| Strain ID | Genotype* | Genome size (bp) | ONT depth | CDS† | tRNA | Contig | Chromosome size (bp) | pINV size (bp) | Other plasmids |
|---|---|---|---|---|---|---|---|---|---|
| 201809330 | 1 | 5,389,660 | 61× | 5428 | 97 | 7 | 4,916,714 | 242,731 | 5 |
| 391324 | 1.5 | 5,260,824 | 59× | 5255 | 97 | 4 | 4,888,493 | 238,313 | 2 |
| 356538 | 2.1 | 5,170,588 | 76× | 5176 | 97 | 4 | 4,946,399 | 216,858 | 2 |
| 830292 | 2.3 | 5,150,027 | 60× | 5166 | 96 | 3 | 4,924,717 | 220,157 | 1 |
| 373220 | 2.12.4 | 5,289,501 | 47× | 5306 | 93 | 4 | 4,983,563 | 223,662 | 2 |
| 590907 | 3.4.1 | 5,174,681 | 74× | 5229 | 97 | 7 | 4,940,164 | 215,149 | 5 |
| 623218 | 3.6.1 | 5,112,917 | 68× | 5154 | 97 | 9 | 4,862,817 | 214,316 | 7 |
| 02_1157 | 3.6.1.1.1 | 5,073,758 | 86× | 5110 | 96 | 5 | 4,832,017 | 212,976 | 3 |
| 642321 | 3.6.2 | 5,100,173 | 43× | 5135 | 97 | 6 | 4,866,958 | 213,229 | 4 |
| 633497 | 3.7.11 | 4,986,415 | 46× | 5046 | 93 | 7 | 4,657,310 | 214,646 | 5 |
| 598955 | 3.7.16 | 5,039,937 | 54× | 5067 | 98 | 7 | 4,807,305 | 214,536 | 5 |
| 618335 | 3.7.28 | 5,138,354 | 61× | 5177 | 98 | 6 | 4,806,102 | 214,666 | 4 |
| 03_0142 | 3.7.29.1.4 | 5,156,461 | 86× | 5182 | 96 | 9 | 4,824,935 | 214,579 | 7 |
| 627346 | 3.7.30.1 | 5,122,274 | 42× | 5168 | 100 | 6 | 4,884,953 | 216,152 | 4 |
| 381259 | 3.7.30.4.1 | 5,260,132 | 58× | 5322 | 91 | 8 | 4,933,886 | 214,700 | 6 |
| 53G‡ | 2.8 | 5,220,473 |
| 5248 | 96 | 5 | 4,988,504 | 215,774 | 3 |
| Antibiotic class | ||||||||||
|---|---|---|---|---|---|---|---|---|---|---|
| Genotype | Strain ID | Beta-lactam | Aminoglycoside | Trimethoprim | Sulphonamide | Phenicol | Tetracycline | Streptothricin | Quinolone | AMR encoding plasmids |
| 1 | 201809330 | blaTEM-1 | aph(6)-Id, aph(3″)-Ib | dfrA14 | sul2 | Inc1, 102,906 bp IncI2, 65,348 bp IncI2, 43,917 bp | ||||
| 1.5 | 391324 |
| ||||||||
| 2.1 | 356538 | blaOXA-1 | aadA1 | catA1 | tet(B) |
| ||||
| 2.3 | 830292 |
| ||||||||
| 2.8 | 53G |
| ||||||||
| 2.12.4 | 373220 | blaTEM-1 | aadA1, aph(6)-Id, aph(3″)-Ib | dfrA1 | sul2 | tet(B) | sat2 | IncFIA/IncFII, 77,123 bp | ||
| 3.4.1 | 590907 | blaOXA-1 | aadA1 | catA1 | tet(B) | qnrB19 | Non-typable, 2,699 bp | |||
| 3.6.1 | 623218 | aph(6)-Id, aph(3″)-Ib | dfrA1 | sul2 | tet(A) | sat2 | gyrA_S83L | Non-typable, 8,401 bp | ||
| 3.6.1.1.1 | 02_1157 | aph(6)-Id, aph(3″)-Ib | dfrA1 | sul2 | tet(A) | sat2 | gyrA_S83L, gyrA_D87G, parC_S80I | Non-typable, 8,401 bp | ||
| 3.6.2 | 642321 | aph(6)-Id, aph(3″)-Ib | dfrA1 | sul2 | tet(A) | sat2 | Non-typable, 10,093 bp | |||
| 3.7.11 | 633497 | aadA1 | dfrA1 | sat2 |
| |||||
| 3.7.16 | 598955 | aadA1 | dfrA1 | sat2 |
| |||||
| 3.7.28 | 618335 | aadA1 | dfrA1, dfrA51 | sat2 |
| |||||
| 3.7.29.1.4 | 03_0142 | aadA1, aph(6)-Id, aph(3″)-Ib | dfrA1 | sul2 | sat2 | gyrA_S83L |
| |||
| 3.7.30.1 | 627346 | aadA1 | dfrA1 | sat2 |
| |||||
| 3.7.30.4.1 | 381259 | aadA1 | dfrA1 | sat2 |
| |||||
| Lineage | No. of genes unique to isolate | No. of genes unique to lineage |
|---|---|---|
| 1 | 95 | 63 |
| 1.5 | 104 | |
| 2.1 | 9 | 6 |
| 2.3 | 18 | |
| 2.8 | 6 | |
| 2.12.4 | 78 | |
| 3.4.1 | 24 | 27 |
| 3.6.1 | 5 | |
| 3.6.1.1.1 | 3 | |
| 3.6.2 | 3 | |
| 3.7.11 | 3 | |
| 3.7.16 | 3 | |
| 3.7.28 | 1 | |
| 3.7.29.1.4 | 11 | |
| 3.7.30.1 | 31 | |
| 3.7.30.4.1 | 90 |
| Type | Description | Gene involved | IS flanked? |
|---|---|---|---|
| Deletion | ~22 kbp absent in all lineage 2 and 3 genomes | xylFGH, xylR, bax, baxL, malS, avtA, ES036, ysaA, yiaJKLMNO, lyxK, ulaD, sgbU, araD, yesN, melB | No |
| Deletion | ~7 kbp absent in all lineage 2 and 3 genomes | ISSd1, IS3, ISEc27, IS630, hypothetical protein, yehM, yehL, zorO | No |
| Deletion | ~16 kbp absent in all lineage 3 genomes | yahBCD, pdeL, ehaA, hypothetical protein, betT, betI, betAB, unnamed (locus tag IAHEGK_19900) | Flanked by IS3 family transposase on one side |
| Deletion | ~7 kbp absent in all lineage 3 genomes | Hypothetical protein, hypothetical protein, fimHGFDB, ISSso6 | No |
| Inversion | ~20 kbp inversion in all lineage 2 and 3 genomes | idnO, idnT, idnR, yjgR, lptGF, pepA, holC, valS, yjgN, istB, IS21, IS1, yjgM, rraB, argF, hypothetical protein, hypothetical protein, hypothetical protein | No |
| Inversion | ~45 kbp inversion in all lineage 2 genomes, ~20 kbp inversion in all lineage 3 genomes | Lineage 2: raiA, hypothetical protein, pheA, tyrA, aroF, hypothetical protein, yfiR, ISSd1, ISSfl10, hypothetical protein, IS21, istB, dgcN, yfiB, rplS, trmD, rimM, rpsP, ffh, ypjD, grpE, nadK, recN, bamE, IS4, yfjF, ratA, smpB, ssrA, 16 unnamed phage related proteins, gpL, ISSd1, ISSfl10, unnamed phage protein Lineage 3:, yfjF, ratA, smpB, ssrA, 16 unnamed phage related proteins, gpL, ISSd1, ISSfl10, unnamed phage protein | IS4 family transposase flanked |
| Inversion | ~40 kbp inversion in all lineage 3 genomes | Hypothetical protein, hypothetical protein, ansB, yggN, yggL, trmB, mutY, yggX, mltC, nupC, hypothetical protein, IS110, ldcC, yqgH, yqgA, trnF, hypothetical protein, ISEc11, hypothetical protein, dNA2, hypothetical protein, sigA, hypothetical protein, yghQ, yghR, yghS, yghR | Flanked by IS630 on one side |
| Inversion | ~34 kbp inversion in all lineage 3 genomes | IS2, IS2, araA1, rclC, rclA, rclR, ykgEFG, hypothetical protein, hypothetical protein, yahEFG, yahIJK, hypothetical protein, yahL, IS3, ISSfl10, yahN, hypothetical protein, hypothetical protein, lacZ, lacI, hypothetical protein, mhpAB, hypothetical protein, IS600 | IS3 family transposase flanked |
| Inversion | ~130 kbp inversion in clades 3.4 and 3.6, ~107 kbp translocation inversion in clade 3.7 | Listed in supplementary material | No |
| Deletion* | ~11 kbp deletion in all lineage 3 genomes and lineage 1.5 | Rhs element protein, faeG, faeDEF, cshE, faeH, faeI, ybdN, spo0j | Flanked by IS66 on one side |
- —http://dx.doi.org/10.13039/100010269 Wellcome Trust
- —http://dx.doi.org/10.13039/501100000781 European Research Council
- —http://dx.doi.org/10.13039/100010269 Wellcome Trust
- —http://dx.doi.org/10.13039/501100000268 Biotechnology and Biological Sciences Research Council
Peer Reviews
No public reviews on file for this paper yet. If you reviewed it on a platform where reviews are public (OpenReview, ICLR, NeurIPS, ICML), you can paste yours below so the community can read it here.
Videos
No videos yet. Explain this paper in a talk, walkthrough, or lecture? Add one.
Taxonomy
TopicsEscherichia coli research studies · Viral gastroenteritis research and epidemiology · Salmonella and Campylobacter epidemiology
Data Summary
All sequencing reads and complete assemblies (with PGAP annotations) have been deposited into the National Center for Biotechnology Information (NCBI) database (accessions can be found in Table S1, available in the online Supplementary Material 1. Genome assemblies and Bakta annotations used in the analysis can be found in Figshare (https://doi.org/10.6084/m9.figshare.28302986) together with Mauve multiple-sequence alignments for the chromosome and pINV plasmid sequences and genome-scale metabolic models produced for each strain.
Pure cultures of 13 strains were deposited in the publicly accessible National Collection of Type Cultures (NCTC, UK) or the ‘Collection de l’Institut Pasteur’ (CIP, France) (accessions listed in Table S1).
Introduction
Shigella are human-adapted lineages of Escherichia coli which have evolved to cause severe diarrhoeal disease, known as shigellosis. Shigellosis is the second leading cause of diarrhoeal deaths globally, most of which occur in children under 5 years of age in low- and middle-income countries [1].
Within Shigella, there are four recognized subgroups that are separated based on their antigenic properties: Shigella boydii, Shigella dysenteriae, *Shigella flexneri *and Shigella sonnei. Each Shigella subgroup emerged from E. coli following the acquisition of a large virulence plasmid (pINV, 210–240 kbp) which conferred the ability to invade human cells [23]. Aside from pINV acquisition, several other gain- and loss-of-function events have been established as stepwise evolutionary changes which facilitated the human adaptation of Shigella [45]. Throughout the course of pathoadaptation, considerable gene loss has been observed [5], a process that is also documented in other host-restricted pathogens such as Salmonella enterica serovar Typhi, Bordetella pertussis and Mycobacterium leprae [68]. In the case of Shigella, gene loss is mostly associated with insertion sequences (ISs), small transposable elements that can mobilize within the genome, disrupt coding sequences and mediate genome rearrangements, insertions and deletions [59]. Interrogation of Shigella and E. coli genomes has revealed that each Shigella subgroup harbours significantly more copies of ISs than other E. coli pathotypes [510].
S. sonnei represents the youngest and least genetically diverse Shigella subgroup [11], with multidrug-resistant clones emerging as the dominant agent of shigellosis in both high-income and economically transitioning countries [1214]. A hierarchical single nucleotide variant (SNV)-based framework has been applied to genotype S. sonnei which sees the current population of S. sonnei delineated into five main lineages (separated by 600 pairwise SNVs), each with varying degrees of global dissemination and expansion [15]. Lineage 1 represents an ancestral lineage rarely detected outside of Europe; lineage 4 represents an extinct lineage comprising a single known isolate [11]; lineage 5 is restricted to Latin America and parts of Africa [16]. Lineage 2 has undergone limited dissemination, establishing localized clones in some regions, but overall, lineage 3 has been the most successful at global dissemination having been detected on every continent and today represents the most epidemiologically significant lineage [15]. Within lineage 3, clades 3.6 (Central Asia III/CipR) and 3.7 (Global III) dominate the epidemiological landscape, with regional studies highlighting a pattern of clonal replacement and expansion, seemingly driven by the independent acquisitions of genes conferring multidrug resistance [encoded on a class II integron (Int2)-bearing transposon, Tn7] [1317].
Increased resistance to antimicrobials is a clear signature of lineage 3 S. sonnei, but there is evidence of ongoing adaptation elsewhere in the genome, marked by the expansion of ISs and the loss of catabolic genes [1011]. However, a lack of completed genomes (and even fewer genomes containing pINV [11], which is readily lost during laboratory culture due to the deletion of toxin-antitoxin systems involved in plasmid maintenance [18]) has left gaps in our knowledge of IS-mediated diversity and genome variability. Furthermore, genomic data reveals that the classical laboratory strain 53G (isolated in 1954 and used for the vast majority of experimental work on S. sonnei [19]) belongs to lineage 2 which is now comparatively rare amongst clinical isolates and is quite distant from the dominant lineage 3 [1115].
Here, we present the complete genomes of 15 pINV-containing S. sonnei isolates, including representatives from lineages 1, 2 and 3. The comparison of completed genomes supports ongoing adaptive evolution in lineage 3, characterized by increased IS abundance, gene pseudogenization and genomic rearrangements. Overall, the results presented here provide novel insights into the genomic variation of S. sonnei lineages and significantly further the resources available for the study of S. sonnei.
Methods
Bacterial strains used in this study
S. sonnei isolates used in this study are listed in Tables 1 and S1. Isolates were originally collected as part of routine public health surveillance in the UK [20] and France [21], or as part of a cohort study in Vietnam [22]. Bacterial isolates were fully anonymized and de-identified prior to their use in this study. Strains were received on agar slants or stabs and streaked onto tryptic soy agar plates, supplemented with 0.01% Congo Red to select for pINV+ isolates [23]. Smooth, red colonies (which indicate T3SS and pINV presence) were picked and stored in 25% (v/v) glycerol at −80 °C.
Genome sequencing
The DNA extraction and long-read (Oxford Nanopore Technology) and short-read (Illumina) sequencing of S. sonnei clinical isolates were performed by MicrobesNG as a paid service. Briefly, an overnight culture was grown in tryptic soy broth (TSB) (incubation at 37 °C, 400 r.p.m.) and sub-cultured to prepare isolates for sequencing. Once the sub-culture reached mid-exponential phase, cells were pelleted by centrifugation at 4,000 g for 4 min, washed in 1 ml PBS and resuspended at a density of 4×10^9^ cells in 500 µl DNA shield (Zymo Research). For Illumina sequencing, paired-end libraries were prepared with the Nextera XT Library Prep Kit and sequenced on an Illumina NovaSeq 6000 instrument to generate 2×250 bp paired-end reads (472.50–811.06 Mbp per isolate). For ONT sequencing, libraries were prepared with the SQK-RBK114.96 kit (Oxford Nanopore Technologies) and barcoded samples were pooled together into a sequencing library. The library was loaded onto an R.10.4.1 flow cell and sequenced over seven runs (until the desired coverage was reached) on a GridION instrument. Across the seven runs, run time ranged from 4 to >24 h and 262.25–397.69 Mbp of data per isolate was generated. Reads were basecalled using Dorado (model r1041_e82_400bps_hac_v4.2.0).
De novo genome assembly
Prior to genomic analysis, sequencing reads were quality checked using FastQC (v.0.12.0) [24], trimmed using Filtlong (v.0.2.1) [25] (for long reads) or Trimmomatic (v.0.4.0) [26] (for short reads). Genomes were then assembled using the Hybracter (v.0.7.3) [27] long-read first assembly pipeline, with Flye (v.2.9.4) [28] selected as the long-read assembler. As part of the pipeline, genomes were polished with Medaka (v.1.8.0) first and then with short reads using PyPOLCA (v.0.3.1) [2930]. The quality of assemblies was checked using Quast (v.5.0.2) [31] [using 53G as a reference genome (accession NC_016822)]. Completeness and contamination were analysed using CheckM (v.1.2.3) [32]. Contigs were concatenated into a multifasta file using SeqKit (v.2.8.2) [33], and then genomes were annotated using Bakta (v.1.9.3) [34], with the full database option selected.
Genome characterization
Complete genomes were genotyped using the S. sonnei genotyping framework implemented in Mykrobe (v.0.13.0) [1535], to confirm S. sonnei lineage assignments matched those obtained previously from published Illumina sequence data for the same isolates [15]. Plasmid sequences were replicon-typed using MOB-suite (v.3.1.9) [36] ‘Mob-typer’ function. Antimicrobial resistance (AMR) determinants were identified using NCBI AMRFinderplus (v.3.12.8) [37]. Colicins were identified using ABRicate (v.1.0.1) [38] using the custom colicin database created by De Silva et al. [39] (https://figshare.com/articles/dataset/colicin_database/20768260/1?file=37009930).
IS elements were identified using ISEScan (v.1.7.2.3) [40], and results were filtered to identify ISs present in the chromosome, pINV and other plasmids. Bakta did not efficiently annotate pseudogenes (tested on 53G for which the number of pseudogenes was previously reported [510]), so the prokaryotic genome annotation pipeline (PGAP) (v.6.7) [41] was used to quantify and compare pseudogenes.
Pangenome analysis
Pangenome analysis was performed using Panaroo (v.1.5.0) [42] using the ‘strict’ mode, MAFFT (v.7.526) [43] was selected to perform core genome alignment and otherwise default settings were used. The phylogenetic tree for pangenome visualization was produced using the core genome alignment file generated by Panaroo as an input to FastTree (v.2.1.1) [44] which was run using the generalized time-reversible model and otherwise default settings. Visualization was performed using Phandango (accessed on 18 August 2024) [45]. Unique homologous gene clusters (HGCs) for each lineage were classified into biological process Gene Ontology (GO) categories using the PANTHER functional classification system (v.19.0) [46].
Whole-genome alignment
Complete genome sequences were reoriented to the fabB gene where necessary due to an inverted collinear block involving the dnaA gene. Whole-genome alignments were performed using progressive Mauve (v.2.4.0) [47]. This approach generates locally collinear blocks which enable the visualization of structural genome rearrangements. Alignments were manually inspected for any rearrangements (inversions, deletions or insertions) that were greater than 7 kb. The structural variants were confirmed by mapping the long reads back to the assembly and checking for congruence. To create isolated gene cluster comparison figures, relevant gene clusters were extracted following visualization in Mauve and aligned using Clinker (v.0.0.29) [48].
Genome-scale metabolic models
Metabolic models were constructed using CarveMe (v1.5.1) with the following options: ‘-u gramneg -g M9’ [49]. Metabolic reaction presence/absence was generated using reaction_presence_absense_generate.py (https://github.com/bananabenana/Metabolic_modelling_scripts/tree/main/reaction_pres_abs). Growth simulations were then performed with Bactabolize (v1.0.3) using the ‘fba’ command [50] whereby each metabolite with an exchange reaction was tested as a sole carbon, nitrogen, phosphorus and sulphur nutrient source.
Results and discussion
The complete genomes of 15 phylogenetically diverse S. sonnei isolates
S. sonnei isolates were selected based on existing short-read (Illumina) data to represent the diversity of the current S. sonnei population (for which lineage-associated epidemiological trends are detailed in Table 2 and Fig. 3 of Hawkey et al. [15]). They comprised two lineage 1 isolates, four lineage 2 isolates (including 53G) and ten lineage 3 isolates (Table S1). We initially sought to include representatives from lineages 4 and 5 but found that cultures were either non-viable following many years of laboratory storage or simply had lost pINV (including the only known lineage 4 isolate) and thus were unsuitable for inclusion. Complete chromosomal and pINV sequences were obtained using hybrid short- and long-read sequencing; general features of the newly sequenced isolates are summarized in Table 1.
There was some variation in genome size, with chromosome sizes ranging from 4.65 to 4.98 Mbp. In line with expectations from prior reports on genome reduction [10], lineage 1 genomes had an average chromosome size of 4.90 Mbp (range 4.89 to 4.92 Mbp), lineage 2 chromosomes averaged at 4.96 Mbp (range 4.92 to 4.99 Mbp), whilst lineage 3 chromosomes were the smallest, averaging at 4.84 Mbp (range 4.66 to 4.94 Mbp). Likewise, pINV sizes ranged from 212 to 242 kbp, and pINV in lineage 1 genomes was ~24 kbp larger than lineage 2 and 3 genomes (average 240 vs 216 kbp).
In addition to the chromosome and pINV, each genome also harboured additional plasmids (between 1 and 8 per genome, ranging from 1,459 to 108,503 bp) (Fig. 1a, Table S2). Plasmid typing using MOB-suite revealed a diverse plasmid repertoire, with Col plasmids (colicinogenic plasmids which encode the genes required for colicin production [51]) being frequently detected. Colicins are bactericidal proteins (bacteriocins) which are known to drive the antibacterial activity of S. sonnei and are thought to aid in competition within the intestinal niche [3952]. The carriage of colicins E3 (which arrests protein synthesis [53]) and E1 (which depolarizes the cell membrane [54]) was most common (Fig. 1b, Table S3) and has been associated with local lineage replacement in S. sonnei [1339], although no global lineage-associated trends were evident amongst the selected isolates.
Summary of plasmid content and colicin presence in S. sonnei assemblies presented here. (a) Plasmids were typed using the MobTyper function in MOB-suite. White squares indicate the absence of the plasmid type, light blue indicates its presence and dark blue indicates that the plasmid type is present and encodes AMR determinants. Where a number is printed in the cell, this indicates multiple of the same plasmid type present in a single strain. (b) Colicins were identified using ABRicate and the full colicin database created previously [39]. White indicates the absence of colicin type, and light blue indicates its presence.
Carriage of AMR determinants is representative of known lineage associations
Screening assemblies for known AMR determinants confirmed that the isolates we selected were representative of the AMR profiles that had previously been associated with the genotypes they were selected to represent (detailed in Fig. 3 of Hawkey et al. [15]). Isolates belonging to clade 3.6.1 were both found to carry the GyrA-S83L mutation associated with this sub-clade [55]; the isolate representing subclade 3.6.1.1.1 also carried the additional mutations GyrA-D87G and ParC-S80I, which are characteristic of subclade 3.6.1.1 and its descendants, and are responsible for its high-level fluoroquinolone resistance [56]. All clade 3.6 isolates carried Tn7 harbouring dfrA1 and sat2 in the integron cassette (conferring resistance to trimethoprim and streptothricin), which was located between an IS4-family transposase and glmS. Similarly, all clade 3.7 isolates carried a distinct Tn7 variant at the same chromosomal locus (Fig. S1A) harbouring dfrA1, sat2 and aadA1 (conferring aminoglycoside resistance). Additionally, all isolates belonging to clade 3.6 were found to carry the small spA plasmid, encoding tetA, aph(6)-Id, aph(3″)-Ib and sul2 (Tables 2 and S4), as is commonplace within this clade [55]. Genotypes 2.1 and 3.4.1 were both found to harbour distinct variants of the chromosomally located Shigella resistance locus (SRL) which encodes for aadA1, tetB, catA1 and blaOXA-1, typical of Latin American-associated S. sonnei (Fig. S1B) [57]. Insertions of the SRL occurred at different sites in the chromosome, but in both cases, they were inserted into a copy of trnS (which encodes for tRNA-Ser), consistent with previous reports [58]. Until now, the location of some resistance determinants as either chromosomally encoded (and so stably fixed) or plasmid encoded (which may be more easily lost) was unclear due to a lack of completed genomes. Resolution of the location of resistance determinants may be beneficial for future use in experimental work, where stable chromosomally encoded genes may act as selective markers.
Pangenome analysis highlights limited lineage-associated gene content variation
To explore overall gene content variation within S. sonnei lineages, a pangenome analysis was performed using Panaroo, including the 15 novel isolates and the laboratory strain 53G. The resulting pangenome was found to be open (γ=0.07) and a total of 6,317 HGCs were identified: of these, 4,282 genes were present in all 16 genomes, representing the core genome; 1,268 genes were present in ≥3 strains, representing ‘shell’ genes and 767 genes were present in <3 strains representing the ‘cloud’ genes (Fig. 2). The number of unique HGCs varied from 1 to 104 per isolate (Table 3). Lineage 1 had the most lineage-specific HGCs (HGCs present in every isolate of that lineage and absent in the other lineages) at 63, consistent with previous reports of gene loss in lineages 2 and 3 compared to lineage 1 [10]. Lineage 2 had only 6 lineage-specific HGCs and Lineage 3 had 27 lineage-specific HGCs. Many lineage-specific HGCs in lineages 2 and 3 were annotated as ISs or IS accessory genes (discussed below). These results highlight minimal fixed gene content variation between S. sonnei lineages, suggesting that variation in the success of lineages is not largely driven by gene content alone.
Linear visualization of the S. sonnei pangenome plotted alongside a maximum-likelihood phylogenetic tree. Panaroo was used to build a pangenome and a core genome alignment. FastTree was used to construct a maximum likelihood tree, which is rooted at the midpoint. The resulting outputs were then visualized using Phandango. Blue stripes indicate the presence of a gene, and white stripes indicate the absence of a gene. Core genes are those present in all genomes; shell genes are defined by the presence in ≥3 genomes; cloud genes are those present in <3 genomes.
Variations in the carriage of ISs
Previous studies have produced evidence for ongoing IS activity within S. sonnei, with data from short-read sequences highlighting the proliferation of ISs specifically within lineages 2 and 3 [10]. However, this has not been examined in completed chromosomal sequences, and never in pINV. We therefore examined the abundance and composition of ISs across S. sonnei lineages using our reference genomes. A total of 16 distinct IS families were identified across all genomes (Fig. 3a). There was some variation in the total IS burden by lineage, with lineage 1 genomes harbouring the fewest, with an average of 480; lineage 2 had an average of 490, whilst lineage 3 genomes had an average of 501.
ISs detected in complete S. sonnei genome sequences by ISEscanner. (a) Total number of ISs identified across all contigs of completed genomes and their location. (b) ISs identified in completed chromosomal sequences. (c) ISs identified in pINV sequences. (d) ISs identified in other plasmids present in S. sonnei genomes. ISs were detected using ISEscanner, ‘other’ represents ISs that could not be matched to a known IS family within the database used.
The detected ISs were split based on their presence in the chromosome, pINV or other plasmids to account for their different evolutionary histories and dynamics. Considering the abundance of ISs in the chromosome alone revealed a clearer trend, with lineage 1 harbouring the fewest chromosomal ISs (median 385, range 379 to 391) and lineage 3 harbouring the most (median 429, range 388 to 440) (Fig. 3b). In pINV, a total of 12 different IS families were identified and two were unique to pINV: IS5 and ISL3, neither of which has been reported in S. sonnei before to our knowledge, likely owing to a scarcity of pINV sequences. A contradictory trend in IS abundance in pINV (compared to chromosomal IS abundance) was observed (Fig. 3c), consistent with pINV being larger in lineage 1, although the differences in IS count were smaller compared to chromosomal ISs (median 80 in lineage 1, median 71.5 in lineage 2 and median 73.5 in lineage 3). For ISs carried on other plasmids, lineage 1.5 harboured the most (n=25), which is consistent with its carriage of the largest plasmid (126 kbp IncFIA, IncFII/MOB_F_, MOB_P_ plasmid, accession: CP179999; Fig. 3d). ISs carried on other plasmids were sporadically detected in single strains, but there was no clear lineage-associated pattern, in line with the limited lineage-associated trends in plasmid carriage.
Lineage 3 genomes harbour more pseudogenes
The accumulation and proliferation of ISs have been linked to increased formation of pseudogenes (inactivated gene remnants) [59]. To investigate any changes in gene functionality, genomes were screened for the presence of pseudogenes using PGAP. The number of pseudogenes predicted using this method is higher than previously published predictions (for 53G at least [10]), but this is likely due to differences in the annotation method, whereby PGAP may be recording 2 separate pseudogenes in situations where a single gene is interrupted by an IS thus creating two fragments.
In agreement with the increased abundance of ISs in lineage three isolates, this analysis also revealed a similar increase in the total number of pseudogenes present in lineage 3 genomes, with mean 711 identified compared to 671 in lineage 2 and 663.5 in lineage 1 (Fig. 4a–d). The differences in pseudogene number were mostly concentrated in the chromosome, where the lineage 3 chromosomes harboured the most pseudogenes (Fig. 4b). In pINV, the same pattern of IS abundance was observed in the number of pseudogenes, where lineage 1 genomes had the greatest abundance of pseudogenes (Fig. 4c), likely due to the larger pINV size.
Abundance of pseudogenes predicted by the NCBI prokaryotic genome annotation pipeline (PGAP). (a) Total pseudogenes identified across all contigs of completed genomes. (b) Pseudogenes identified in completed chromosomal sequences. (c) Pseudogenes identified in pINV sequences. (d) Pseudogenes identified in other plasmids present in S. sonnei genomes. Lineage 1 isolates are in light grey, lineage 2 in dark grey and lineage 3 in blue.
Structural variation in S. sonnei genomes
Shigella genomes are documented to have an exceptionally high rate of structural variation compared to other pathogenic (and non-pathogenic) E. coli [60], likely mediated by the large complement of ISs in their genomes [10]. To investigate lineage-associated structural variation, whole-genome alignments of chromosomal and pINV sequences were inspected (represented in Figs S2 and S3).
In the chromosomes, we identified four large-scale (>7 kbp) variations that were conserved within lineages (summarized in Table 4), two of which were identified in all lineage 2 and 3 genomes, and two of which occurred in only lineage 3 genomes. In lineages 2 and 3, of particular note was the absence of xylFGH and xylR, which have a role in xylose utilization [61], which suggests adaptive loss of metabolic function, since these genes are also disrupted in other Shigella subgroups [5]. Another structural variant included the absence of the type 1 fimbrial operon in all lineage 3 genomes and distinct partial disruptions of the operon in lineage 1 and 2 genomes, as described fully in [62]. In agreement, recent work described the specific loss of putative immunogenic components (including type 1, K88 and Curli fimbrial loci), whilst other determinants of pathogenicity (including the T3SS and O-antigen encoding regions) remained highly conserved [62]. Furthermore, the convergent disruption of type 1 fimbriae has been previously reported in all other Shigella subgroups [63], suggesting that its presence is detrimental to Shigella, and thus, its parallel loss in multiple lineages may reflect adaptive evolution.
We identified five large-scale inversions conserved within lineages which were confirmed by mapping long-reads to the complete assemblies. Two were identified in all lineage 2 and 3 genomes (~20 and 45 kbp), and in this case, both were flanked by IS4-family transposases, suggestive of IS-mediated homologous recombination. Three inverted regions were identified uniquely in lineage 3 genomes, but only one of these was flanked by IS copies, suggesting that other mechanisms may also be driving structural variation in S. sonnei. The implications of these chromosomal rearrangements remain ambiguous, but potential impacts on gene expression, or inactivation, are likely important for conferring adaptive changes. Furthermore, lineage-associated variations identified here might indicate differential niche occupation, since rearrangements are known to contribute to bacterial adaptability [64].
For pINV, we observed limited structural variation, and the differences in pINV size (described above) did not seem to be mediated by a single large structural rearrangement, but instead by smaller-scale deletions. The most prominent example is an ~11 kbp loss shared by all lineage 3 genomes in our reference set, as well as lineage 1.5, which included the region encoding for a K88 fimbriae (previously reported to play a role in the pathogenesis of enterotoxigenic E. coli [65] and recently described as absent from lineage 3 S. sonnei [62]). The remaining difference can largely be attributed to the increased abundance of ISs within lineage 1 pINV, which contains an additional 9–14 kbp of IS content. The overall lack of variation observed here is consistent with an essential role for pINV maintenance in the pathogenesis and spread of S. sonnei [66].
Metabolic capacity of S. sonnei genotypes
The convergent loss of metabolic function has been previously documented in all Shigella subgroups [1067] and likely represents a key step towards host adaptation. To investigate any lineage-associated trends in the metabolic capacity of S. sonnei, strain-specific genome-scale metabolic models were built, and growth capacities were simulated. On average, the number of metabolic reactions predicted for each lineage was similar (Fig. 5a, Table S5); a total of 2,898 metabolic reactions were identified; of these, 2,505 were shared between all strains. A median of 2,748 reactions was identified in lineage 1 strains (range 2,742 to 2,753), 2741 in lineage 2 (range 2,625 to 2,746) and 2,691 in lineage 3 strains (range 2,602 to 2,749). Few reactions were specific to a single lineage: seven were predicted in only lineage 1 isolates (alpha amylase, periplasmic alpha-amylase, dextrin import, starch import, glutathione transport, succinate dehydrogenase and l-cysteine-specific tryptophanase); two predicted only in lineage 1 and 2 isolates (betaine-aldehyde dehydrogenase and a raffinose proton symporter) and four predicted in only lineage 3 isolates (a d-galactose ABC transporter which facilitates glutamate synthesis and a polysaccharide ABC transporter which imports maltotetraose, melibiose and raffinose). Intriguingly, the genes underlying these four reactions are truncated or disrupted in lineage 3 genomes, suggesting that these reactions may reflect annotation artefacts arising from pseudogenization rather than true metabolic differences, and their functional relevance will require experimental verification in future. For growth simulations, no growth was detected under anaerobic conditions on any substrates (despite Shigella being a facultative anaerobe), so only aerobic growth was considered here. Consistent with the metabolic reaction data, we identified a median of 410 predicted growth phenotypes in lineage 1 (range 408–412), 398 (range 384–407) in lineage 2 and 396 (range 374–422) in lineage 3. All strains were predicted to grow on 350 substrates, with variability observed for 105 substrates (Fig. 5b). The predicted ability to utilize l-tryptophan was restricted to lineage 1, which likely represents another instance of adaptive change, since the inability to utilize tryptophan (resulting in the indole-negative phenotype) has been observed in parallel across many Shigella lineages [68]. Otherwise, there were no predicted growth phenotypes that were unique to a single lineage. This variation between the presence of reactions and predicted growth could be explained by the exclusion of anaerobic growth conditions in our analysis, as well as being unable to model unknown/novel metabolism likely encoded within Shigella. Another limitation of this approach is the lack of phenotypic data available for S. sonnei, which left us unable to validate these models (although we note the similarity of * S. sonnei*’s metabolic capacity to E. coli, for which CarveMe models have demonstrated accuracy [49]). Overall, this data suggests a trend towards metabolic streamlining in lineage 3 S. sonnei; however, the differences observed here are minor and would benefit from functional verification.
Heatmap of variable metabolic capacities predicted for each S. sonnei genome. (a) Presence or absence of variable metabolic reactions in each strain. Grey indicates presence, white indicates absence and blue indicates reactions unique to one or more lineages, n=394 reactions presented. (b) Predicted growth simulations on carbon (C), nitrogen (N), sulphur (S) or phosphorus (P) based metabolites. Grey or black indicates presence, white indicates absence and blue indicates reactions unique to one or more lineages, n=105 substrates presented. Full genome-scale metabolic models and tables summarizing all metabolic reactions and growth capacities can be downloaded from https://doi.org/10.6084/m9.figshare.28302986.
Conclusions
Here, we report the completed genomes of 15 S. sonnei isolates, representing epidemiologically relevant and phylogenetically distinct genotypes. The bacterial isolates and complete reference genomes made available here support future experimental and computational research on S. sonnei. For example, recent work utilizing this collection demonstrated significant variation in virulence phenotypes in both zebrafish and human neutrophil infection models, proving insights into factors driving the success of specific S. sonnei clones. These resources facilitate experimental studies that more accurately reflect contemporary infections and can be used to uncover mechanisms of pathogen success, informing vaccine and therapeutic development. Furthermore, the in-depth characterization of these complete genome sequences highlights ongoing adaptive evolution in S. sonnei and identifies areas deserving of further functional investigation to better understand S. sonnei biology, which remains vastly understudied in comparison to S. flexneri.
Supplementary material
10.1099/mgen.0.001596Uncited Supplementary Material 1.
The reference list from the paper itself. Each links out to its DOI / PubMed record.
- 1Khalil IA Troeger C Blacker BF Rao PC Brown A et al Morbidity and mortality due to shigella and enterotoxigenic Escherichia coli diarrhoea: the Global Burden of Disease Study 1990-2016 Lancet Infect Dis 2018181229124010.1016/S 1473-3099(18)30475-430266330 PMC 6202441 · doi ↗ · pubmed ↗
- 2Sansonetti PJ Kopecko DJ Formal SB Involvement of a plasmid in the invasive ability of Shigella flexneri Infect Immun 19823585286010.1128/iai.35.3.852-860.19826279518 PMC 351125 · doi ↗ · pubmed ↗
- 3Lan R Reeves PR Escherichia coli in disguise: molecular origins of Shigella Microbes Infect 200241125113210.1016/s 1286-4579(02)01637-412361912 · doi ↗ · pubmed ↗
- 4Day WA Fernández RE Maurelli AT Pathoadaptive mutations that enhance virulence: genetic organization of the cad A regions of Shigella spp Infect Immun 2001697471748010.1128/IAI.69.12.7471-7480.200111705922 PMC 98836 · doi ↗ · pubmed ↗
- 5Yang F Yang J Zhang X Chen L Jiang Y et al Genome dynamics and diversity of Shigella species, the etiologic agents of bacillary dysentery Nucleic Acids Res 2005336445645810.1093/nar/gki 95416275786 PMC 1278947 · doi ↗ · pubmed ↗
- 6Parkhill J Sebaihia M Preston A Murphy LD Thomson N et al Comparative analysis of the genome sequences of Bordetella pertussis, Bordetella parapertussis and Bordetella bronchiseptica Nat Genet 200335324010.1038/ng 122712910271 · doi ↗ · pubmed ↗
- 7Eiglmeier K Parkhill J HonoréN Garnier T Tekaia F et al The decaying genome of Mycobacterium leprae Lepr Rev 20017238739810.5935/0305-7518.2001004711826475 · doi ↗ · pubmed ↗
- 8Holt KE Parkhill J Mazzoni CJ Roumagnac P Weill F-X et al High-throughput sequencing provides insights into genome variation and evolution in Salmonella Typhi Nat Genet 20084098799310.1038/ng.19518660809 PMC 2652037 · doi ↗ · pubmed ↗