Metabolic Syndrome and Obesity‐related cancer Risk and Survival: An Umbrella Review of Systematic Reviews With Meta‐analysis of Observational Studies
Maci Winn, Prasoona Karra, Ryzen Benson, Svenja Pauleck, Nathorn Chaiyakunapruk, Win Khaing, Sajesh K. Veettil, Mary M. McFarland, Tallie Casucci, Yizhe Xu, Siwen Hu‐Lieskovan, Michelle Litchman, Mary Playdon, Sheetal Hardikar

TL;DR
This study finds that metabolic syndrome increases the risk of several obesity-related cancers and worsens survival in some cases, highlighting the need for better prevention and management strategies.
Contribution
The study provides a comprehensive umbrella review of systematic reviews and meta-analyses on the link between metabolic syndrome and obesity-related cancer risk and survival.
Findings
Metabolic syndrome is associated with increased risk of several obesity-related cancers.
The evidence for the association between metabolic syndrome and cancer survival is weaker but still present in some cases.
Publication bias was observed in a significant proportion of the associations analyzed.
Abstract
Metabolic syndrome (MetS) may be associated with obesity‐related cancer (ORC) owing to shared risk factors like physical inactivity, insulin resistance, gut microbiome dysfunction, and inflammation. We conducted an umbrella review of systematic reviews with meta‐analysis to synthesize the evidence on the association between MetS and ORC risk and survival. Searches in five databases (Medline, Embase, CINAHL, Cochrane Library, and Scopus) retrieved 2524 systematic reviews with meta‐analyses (SRMAs), which underwent title and abstract screening (2524), full‐text review (41), and data extraction for included SRMAs (21). Summary effects and 95% confidence intervals were re‐estimated using random‐effects models. Methodological quality, certainty of evidence, and publication bias were assessed using the AMSTAR 2, modified Ioannidis criteria, and Egger's test, respectively. A total of 25…
Genes, proteins, chemicals, diseases, species, mutations and cell lines named across the full text — each resolved to its canonical identifier and authoritative record.
Click any figure to enlarge with its caption.
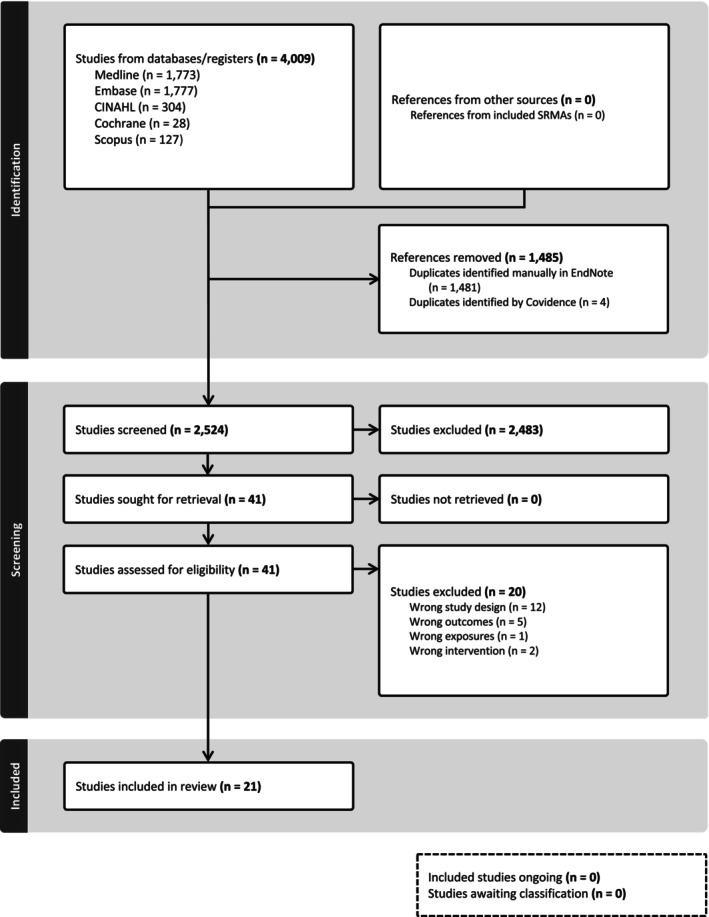 FIGURE 1
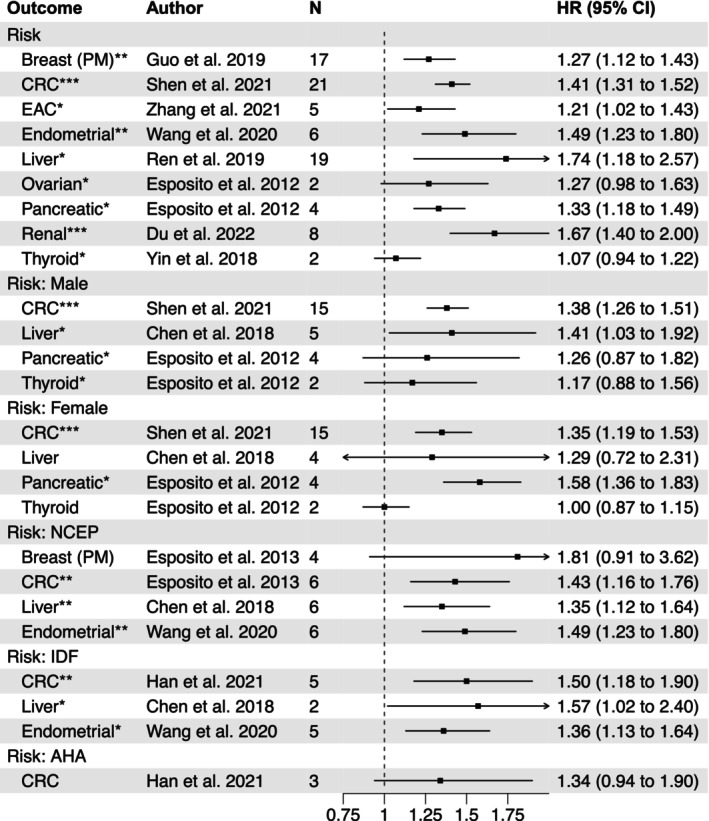 FIGURE 2
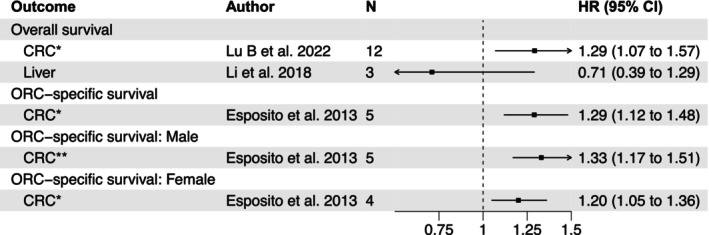 FIGURE 3
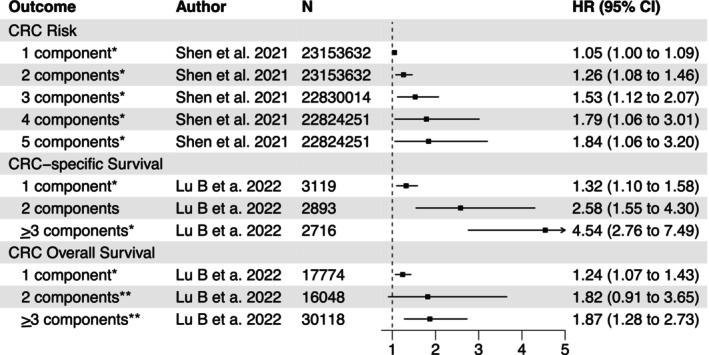 FIGURE 4
| Strength of Evidence | Criteria |
|---|---|
| Convincing (class I) |
Number of cases > 1000
Heterogeneity (I2) < 50% 95% prediction interval excluding the null No small‐study effects ( No excess significance bias (p < 0.1) |
| Highly suggestive (class II) |
Number of cases > 1000 p < 10−6 Largest study with a statistically significant effect ( |
| Suggestive (class III) |
Number of cases > 1000 p < 10−3 |
| Weak (class IV) |
p < 0.05 |
| Nonsignificant |
|
| Source | Cancer(s) | Included Studies | Total Sample Size | Cases | Reported RR(95% CI) | MetS Definition | Heterogeneity | AMSTAR 2 |
|---|---|---|---|---|---|---|---|---|
|
| ||||||||
|
| Breast, Colorectal, Endometrial, Liver, Ovarian, Pancreatic, Thyroid | 43 |
Breast: 309,163 CRC: 713,800 (M 380,786; F 333,014) Endometrial: 307,556 Liver: 846,328 (M 451,569; F 411,436) Ovarian: 303,997 Pancreatic: 639,371 (M 315,723; F 323,648) Thyroid: 612,054 (M 306,543; F 305,511) |
Breast: 1338 CRC: 10,021 (M 6124; F 3897) Endometrial: 2190 Liver: 4196 (M 2828; F 1368) Ovarian: 654 Pancreatic: 1294 (M 767; F 527) Thyroid: 395 (M 137; F 258) |
Breast: 1.56(1.08–2.24) CRC: M 1.25(1.19–1.32); F 1.34(1.09–1.64) Endometrial: 1.40(1.32–1.49) Liver: 1.60(1.32–1.94) Ovarian: 1.26(1.00–1.59) Pancreatic: M 1.29(0.88–1.89); F 1.58(1.35–1.84) Thyroid: 1.15(0.96–1.37); 1.00(0.87–1.15) | Included traditional and non‐traditional definitions with at least 3 factors |
Breast: 88% CRC: M 35%, F 60% Endometrial: 46% Liver: Overall 79%, M 80%, F 87% Ovarian: 9% Pancreatic: M 65%, F 0.0% Thyroid: M 8%, F 0% |
|
|
| Breast | 9 | 375,876 | 7308 | 1.52 (1.20–1.93) | Strict and modified NCEP ATP III, ≥ 3 metabolic abnormalities, z‐scores |
Overall: 85% NCEP ATP III: 63% |
|
|
| Colorectal | 17 | 730,307 (M 379,162; F 351,145) | 10,575 (M 6350; F 4225) |
M 1.33(1.18–1.50) F 1.41(1.18–1.70) | Modified NCEP ATP III, ≥ 3 metabolic abnormalities, z‐score, quartiles, use of metabolic agents |
M: 45% F: 58% NCEP ATP III: 33% |
|
|
| Colorectal | 18 | 677,851 | 10,889 | 1.34 (1.24–1.44) | NCEP ATP III, IDF, AHA, WHO | 51% |
|
|
| Breast | 8 | 79,101 | 5834 | 1.81 (1.28–2.56) | Strict and modified NCEP ATP III, IDF, modified IDF, modified WHO, NHLBI, J‐MeS, ≥ 3 metabolic abnormalities, tertiles, use of metabolic agents | 70% |
|
|
| Endometrial | 6 | 310,219 | 3132 | 1.89 (1.34–2.67) | Strict and modified NCEP ATPIII, IDF, ≥ 2 or 3 metabolic abnormalities, z‐score | 92% |
|
|
| Liver | 4 | 829,651 | 4074 | 1.81 (1.37–2.41) | NCEP ATP III, IDF, AHA | 79% |
|
|
| Liver | 6 | 747,981 (M 97,912; F 88,046) | 1061 (M 614; F 181) |
NCEP 1.43 (1.19–1.72) IDF 1.59(1.13–2.23) | NCEP ATP III, IDF |
Overall: 29% M: 65%, F: 57% IDF: 0% |
|
|
| Liver | 10 | 887,572 (M 19,477; F 33,562) | 4346 (M 113; F 56) | 1.60 (1.12–2.28) | NCEP ATP III, WHO, IDF, AHA, JASSO, IASO, J‐Mes, Unknown |
Overall: 90% M: 0%, F: 78% |
|
|
| Thyroid | 2 | 578,782 | 429 | 1.04 (0.94–1.16) | HOMA‐IR, IR, dyslipidemia, hypertension, z‐score | 0% |
|
|
| Breast | 17 | 506,868 | 10,045 | 1.25 (1.12–1.39) | NCEP ATP III, IDF | 79% |
|
|
| Liver | 19 | 1,566,996 | 2907 | 1.76 (1.33–2.33) | NCEP ATP III, AHA, WHO, ICD, HOMA, ADA, Asian and Chinese Criteria | 88% |
|
|
| Endometrial | 6 | 270,052 | 35,193 | 1.50 (1.22–1.82) | Strict and modified NCEP ATP III, IDF, modified IDF |
NCEP ATP III: 78% IDF: 65% |
|
|
| Breast | 25 | 120,340 | 2130 | 2.01 (1.55–2.60) | Strict and modified NCEP ATP III | 56% |
|
|
| Colorectal | 18 | 23,643,370 | 161,280 | 1.25 (1.18–1.32) | Strict and modified NCEP ATP III, WHO, IDF, AHA, ≥ 3 metabolic abnormalities, use of metabolic agents |
Overall: 44% NCEP: 0% IDF: 26% AHA: 57% |
|
|
| Colorectal | 21 | 53,010,256 (M 15,605,776; F 14,056,875) | 350,817 (M 95,474; F 84,188) | 1.36(1.26–1.47) | NCEP ATP III, ≥ 3 MetS components |
Overall: 86%, M: 75%, F: 75% NCEP ATP III: M 72%, F 67% |
|
|
| Esophageal adenocarcinoma | 5 | 793,049 | 3978 | 1.19 (1.10–1.27) | NCEP ATP III, IDF, AHA, ≥ 3 or 5 metabolic abnormalities | 17% |
|
|
| Renal | 8 | 10,601,007 | 32,130 | 1.62 (1.41–1.87) | NCEP ATP III | Overall: 85%, M: 80%, F: 77% |
|
|
| ||||||||
|
| Colorectal (CSS) | 4 | 107,128 | 887 | 1.61 (1.28–2.01) | Traditional and non‐traditional definitions with at least 3 factors | 0% |
|
|
| Colorectal (CSS) | 5 | 671,704 | 2607 |
M 1.36 (1.25–1.48) F 1.16(1.03–1.3) | Modified NCEP ATP III, ≥ 3 metabolic abnormalities, z‐score, quartiles, use of metabolic agents |
M: 1% F: 21% |
|
|
| Colorectal (CSS) | 12 | 83,303 | 24,579 | 1.72 (1.03–2.42) | Strict and modified NCEP ATP III, WHO, IDF, AHA, ≥ 3 metabolic abnormalities, use of metabolic agents |
OS: 85% CSS: 85% |
|
|
| Colorectal (CSS and OS) | 2 CSS, 12 OS |
CSS: 3364 OS: 116,226 |
CSS: 996 OS: 22,792 |
CSS: 2.12 (1.08–4.17) OS: 1.34(1.11–1.63) | Strict and modified NCEP ATP III, IDF, CDS, AHA, NHLBI, Harmonized, other |
OS: 85% CSS: 93% |
|
|
| Colorectal (CSS and OS) | 3 CSS, 7 OS |
CSS: 4528 OS: 41,476 |
CSS: 889 OS: 21,752 |
CSS: 1.80 (1.04–3.12) OS: 1.04(0.94–1.15) | Strict and modified NCEP ATP III, CDS, AHA, ≥ 3 metabolic abnormalities |
OS: 44% CSS: 93% |
|
|
| Liver (OS) | 6 | 494 | 96 | 0.92(0.83–0.99) | NCEP ATP III, WHO, IDF, AHA, JASSO, IASO, J‐Mes, other | 28% |
|
|
| Colorectal (OS) | 4 | 4096 | 2787 | 1.17 (0.91–1.49) | Harmonized, AHA, CDS, other | 65% |
|
| Outcome | Author, year | N studies | HR (95% CI) |
| Prediction interval | N cases |
| Egger's test (p)
| Excess significance (p) | Largest study significant | Strength of evidence class |
|---|---|---|---|---|---|---|---|---|---|---|---|
|
| |||||||||||
| Breast | Guo et al. 2019 | 17 | 1.27 (1.12–1.43) | 1.4E‐04 | 0.87–1.85 | 10,058 | 75% | 7.2E‐03 | 8.0E‐06 | N | III |
| Colorectal | Shen et al. 2021 | 21 | 1.41 (1.31–1.52) | 3.0E‐19 | 1.04–1.91 | 186,123 | 77% | 1.7E‐03 | 5.3E‐02 | Y | II |
| Esophageal | Zhang et al. 2021 | 5 | 1.21 (1.02–1.43) | 2.8E‐02 | 0.76–1.92 | 3978 | 31% | 5.4E‐01 | 2.9E‐01 | Y | IV |
| Endometrial | Wang et al. 2020 | 6 | 1.49 (1.23–1.80) | 5.4E‐05 | 0.81–2.74 | 17,768 | 79% | 2.6E‐02 | 8.1E‐02 | Y | III |
| Liver | Ren et al. 2019 | 19 | 1.74 (1.18–2.57) | 5.6E‐03 | 0.43–7.08 | 2684 | 89% | 8.3E‐01 | 1.5E‐01 | Y | IV |
| Ovarian | Esposito et al. 2012 | 2 | 1.27 (0.98–1.63) | 6.6E‐02 | N/A | 654 | 88% | N/A | 7.7E‐01 | N | ns |
| Pancreatic | Esposito et al. 2012 | 4 | 1.33 (1.18–1.49) | 3.3E‐06 | 1.02–1.72 | 779 | 54% | 9.9E‐01 | 3.5E‐01 | Y | IV |
| Renal | Du et al. 2022 | 8 | 1.67 (1.40–2.00) | 1.9E‐08 | 0.98–2.85 | 17,025 | 86% | 2.4E‐01 | 2.2E‐01 | Y | II |
| Thyroid | Yin et al. 2018 | 2 | 1.07 (0.94–1.22) | 3.3E‐01 | N/A | 174 | 0% | N/A | 6.4E‐01 | N | ns |
|
| |||||||||||
| Colorectal | Shen et al. 2021 | 15 | 1.38 (1.26–1.51) | 9.3E‐12 | 1.03–1.84 | 95,474 | 83% | 6.7E‐02 | 9.5E‐02 | Y | II |
| Liver | Chen et al. 2018 | 5 | 1.41 (1.03–1.92) | 3.4E‐02 | 0.51–3.89 | 614 | 68% | 6.5E‐03 | 1.3E‐01 | N | IV |
| Pancreatic | Esposito et al. 2012 | 4 | 1.26 (0.87–1.82) | 2.2E‐01 | 0.29–5.49 | 767 | 72% | 8.3E‐01 | 4.7E‐01 | N | ns |
| Thyroid | Esposito et al. 2012 | 2 | 1.17 (0.88–1.56) | 2.7E‐01 | N/A | 137 | 8% | N/A | N/A | N | ns |
|
| |||||||||||
| Colorectal | Shen et al. 2021 | 15 | 1.35 (1.19–1.53) | 2.2E‐06 | 0.89–2.05 | 84,230 | 74% | 5.5E‐03 | 2.5E‐05 | Y | II |
| Liver | Chen et al. 2018 | 4 | 1.29 (0.72–2.31) | 3.9E‐01 | 0.12–14.17 | 181 | 62% | 9.4E‐01 | 4.8E‐01 | N | ns |
| Pancreatic | Esposito et al. 2012 | 4 | 1.58 (1.36–1.83) | 2.6E‐09 | 1.14–2.19 | 527 | 0% | 8.7E‐01 | 8.3E‐01 | Y | IV |
| Thyroid | Esposito et al. 2012 | 2 | 1.00 (0.87–1.15) | 9.9E‐01 | N/A | 258 | 0% | N/A | N/A | N | ns |
|
| |||||||||||
| Breast | Esposito et al. 2013 | 1.81 (0.91–3.62) | 9.2E‐02 | 0.07–46.82 | 593 | 80% | 3.5E‐01 | 2.2E‐02 | Y | ns | |
| Colorectal | Esposito et al. 2013 | 6 | 1.43 (1.16–1.76) | 9.0E‐04 | 0.74–2.76 | 2164 | 76% | 6.4E‐01 | 5.2E‐01 | N | III |
| Liver | Chen et al. 2018 | 6 | 1.35 (1.12–1.64) | 2.0E‐03 | 0.83–2.19 | 1697 | 44% | 2.7E‐01 | 1.4E‐01 | Y | III |
| Endometrial | Wang et al. 2020 | 6 | 1.49 (1.23–1.80) | 5.4E‐05 | 0.81–2.74 | 17,768 | 79% | 2.6E‐02 | 2.7E‐05 | Y | III |
|
| |||||||||||
| Colorectal | Han et al. 2021 | 5 | 1.50 (1.18–1.90) | 9.7E‐04 | 0.68–3.31 | 152,603 | 71% | 9.3E‐02 | 4.7E‐05 | Y | III |
| Liver | Chen et al. 2018 | 2 | 1.57 (1.02–2.40) | 3.9E‐02 | N/A | 915 | 0% | N/A | N/A | N | IV |
| Endometrial | Wang et al. 2020 | 5 | 1.36 (1.13–1.64) | 1.4E‐03 | 0.73–2.54 | 17,601 | 66% | 2.7E‐01 | 3.4E‐01 | N | IV |
|
| |||||||||||
| Colorectal | Han et al. 2021 | 3 | 1.34 (0.94–1.90) | 1.0E‐01 | 0.02–86.60 | 919 | 79% | 6.5E‐01 | 7.2E‐01 | N | ns |
|
| |||||||||||
| Colorectal | Lu B et al. 2022 | 12 | 1.29 (1.07–1.57) | 9.1E‐03 | 0.69–2.42 | 22,792 | 79% | 2.3E‐02 | 2.0E‐03 | Y | IV |
| Liver | Li et al. 2018 | 3 | 0.71 (0.39–1.29) | 2.6E‐01 | 0.00–600.01 | N/A | 72% | 3.4E‐01 | N/A | N | ns |
|
| |||||||||||
| Colorectal | Esposito et al. 2013 | 5 | 1.29 (1.12–1.48) | 3.7E‐04 | 0.90–1.83 | 1000 | 24% | 2.5E‐03 | 1.8E‐01 | Y | IV |
|
| |||||||||||
| Colorectal | Esposito et al. 2013 | 5 | 1.33 (1.17–1.51) | 1.4E‐05 | 0.97–1.83 | 1650 | 26% | 7.5E‐03 | 4.7E‐05 | Y | III |
|
| |||||||||||
| Colorectal | Esposito et al. 2013 | 4 | 1.20 (1.05–1.36) | 7.4E‐03 | 0.79–1.81 | 957 | 0% | 1.1E‐01 | 8.4E‐02 | Y | IV |
- —National Cancer Institute
- —National Institute of Diabetes and Digestive and Kidney Diseases10.13039/100000062
Peer Reviews
No public reviews on file for this paper yet. If you reviewed it on a platform where reviews are public (OpenReview, ICLR, NeurIPS, ICML), you can paste yours below so the community can read it here.
Videos
No videos yet. Explain this paper in a talk, walkthrough, or lecture? Add one.
Taxonomy
TopicsCancer Risks and Factors · Metabolism, Diabetes, and Cancer · Cancer, Lipids, and Metabolism
INTRODUCTION
1
Metabolic syndrome (MetS), a group of risk factors, including hyperglycemia, dyslipidemia, hypertension, and central adiposity, is often used clinically to define metabolic health and cardiometabolic disease risk in adults [1]. MetS is driven by genetics and behavioral and environmental factors, including obesity, poor diet, physical inactivity, circadian cycle disruption, gastrointestinal dysbiosis, smoking, alcohol consumption, and stress [2, 3, 4, 5, 6, 7]. Up to one‐third of adults in developed countries have MetS, with rising rates due to aging populations [8]. MetS is also linked to cancer risk owing to shared risk factors and underlying etiological mechanisms [9, 10].
Obesity, a key component of MetS, increases the risk of at least thirteen cancer types called obesity‐related cancers (ORCs), including breast, colorectal, endometrial, ovarian, thyroid, renal‐cell, pancreatic, liver, gallbladder, multiple myeloma, meningioma, gastric cardia, and esophageal adenocarcinoma [11]. Despite prevention efforts, ORC incidence is rising, highlighting the public health impact of MetS on future cancer rates and survival [12]. Additionally, body mass index (BMI), the most common obesity metric, fails to identify up to a third of normal‐weight (BMI 18.5‐ < 25 kg/m^2^) individuals with metabolic dysfunction who may be at increased cancer risk [13, 14]. Thus, evaluating MetS as part of standard clinical care may aid in cancer risk stratification. Finally, although systematic reviews with meta‐analyses (SRMAs) have examined the link between MetS and ORC risk and survival, varying definitions of MetS and unequivocal evidence for specific cancers exist.
This umbrella review aimed to systematically identify relevant SRMAs of MetS and ORC risk and survival, synthesize their findings, and assess the strength and certainty of evidence to provide robust foundational evidence for the magnitude and credibility of the associations between MetS and ORC risk and survival.
Materials & Methods
2
This umbrella review was conducted using methods specified in the Cochrane Handbook for Systematic Reviews of Interventions version 6.0 and in Joanna Briggs Institute (JBI) Reviewer's Manual while adhering to PRISMA reporting guidelines [15, 16, 17, 18, 19, 20]. The protocol was registered in PROSPERO (CRD42021230899) [21]. Protocol changes with justifications are in Appendix A.
Eligibility Criteria
2.1
The research question was developed using the Population, phenomena of Interest, Context, and Outcomes (PICo) structure [(P) Adults (≥ 18 years), (I) MetS, (C) Any geographic location or setting, and (O) ORC incidence or survival (overall or ORC‐specific)] [15]. ORCs were defined per the International Agency for Research on Cancer determination (including colorectal, postmenopausal breast, endometrial, ovarian, kidney, esophageal adenocarcinoma, gastric cardia, liver, gallbladder, pancreatic, meningioma, multiple myeloma, and thyroid cancers) [11].
Information Sources and Search Strategy
2.2
A search using Medline (Ovid) 1946–2023, Embase (Elsevier) 1974–2023, Cumulated Index to Nursing and Allied Health Literature (CINAHL) Complete (Ebscohost) 1937–2023, Cochrane Library (Wiley) 1898–2023, and Scopus (Elsevier) 1970–2023 databases was conducted using a combination of database‐specific subject headings and Keywords for the concepts of MetS and ORCs with filters for SRMAs of observational studies (Appendix B). Searches were conducted by a University of Utah librarian (T.C.) and peer‐reviewed by an information specialist (M.M.M.) according to PRESS guidelines [22]. The database search Results were updated on January 3, 2023, from the original searches conducted in February 2021. No publication date limits were applied. EndNote x20 (Clarivate) was used for citation management and article duplication removal, with Covidence (Veritas Health Innovation) providing a secondary means for removing duplicates.
Selection Process
2.3
Using Covidence, two reviewers (M.W. and P.K.) independently screened titles and abstracts and reviewed full texts. Discrepancies were resolved by a third reviewer (S.H. or M.P.). The reference lists from included reviews were reviewed (M.W.) to identify additional SRMAs.
Data Collection Process
2.4
Two investigators (M.W. and R.B.) independently extracted data from SRMAs using the JBI data extraction form customized to fit the research question [15]. Extraction items included descriptive characteristics, study design, database search information, risk of bias assessments, appraisal instrument and ratings, measures of heterogeneity, analysis methods, and findings. Disagreements were resolved by a third reviewer (S.H. or M.P.). All extracted data were verified in original research studies by at least two reviewers (M.W., S.P., P.K., R.B.) and corrected as necessary.
If sample size data were missing, we attempted to contact the original study authors and added the information received. For the quantitative analysis, when more than one SRMA was available for the same research question, we selected the SRMA with the highest number of studies. If more than one SRMA included the same number of studies, the newest review was selected.
Study Risk of bias Assessment
2.5
The methodological quality of each SRMA was assessed using the 16‐item AMSTAR 2 (A MeaSurement Tool to Assess systematic Reviews Version 2; M.W.) [23]. Seven domains considered critical for high‐quality studies were used to rate the overall confidence (high, moderate, low, or critically low‐quality) in each meta‐analysis [23] (Table S1). As a sensitivity analysis, we repeated the AMSTAR2 assessment, excluding two critical domains including 1) protocol registration, and 2) justification for excluded studies, to evaluate the impact of these criteria on overall quality ratings.
Effect Measures and Synthesis Methods
2.6
Summary effects and 95% confidence intervals (CIs) were re‐estimated using random‐effects models for MetS and ORC risk and survival, including overall and stratified estimates by sex and MetS definition. In addition to analyses using a binary definition of MetS, we also extracted continuous MetS severity scores from SRMAs, where available. Results were then stratified by severity score to examine the relationship between increasing metabolic dysfunction markers and cancer risk or survival. Estimates reported as odds ratios (ORs) were converted to relative risks (RRs) to account for differences in study design [24]. A p‐value of less than 0.05 was considered statistically significant, and 95% prediction intervals were calculated for the summary random effects estimates to further account for between‐study effects [25].
The χ ^ 2 ^ based Cochran Q test (p‐value < 0.1 considered significant) and the I ^ 2 ^ metric of inconsistency (> 50% considered high heterogeneity) with 95% CI were used to assess between‐study heterogeneity [26, 27].
Reporting bias Assessment
2.7
The Egger's regression asymmetry test was used to examine small study effects (p‐value < 0.1 considered as significant) [28]. A SRMA was considered to have a reporting bias if nonsignificant results were not adequately reported [29]. Reporting bias was determined to be at high, low, or unclear risk based on criteria specified in the Cochrane handbook [29]. Excess significance was determined by comparing the expected against the observed number of studies with statistically significant results through a chi‐square (χ ^2^) test (p‐value < 0.1 considered excess significance) [30, 31, 32].
Certainty Assessment
2.8
The quantitative umbrella review criteria, a modified version of the Ioannidis criteria, were used to stratify the strength of evidence of each association as “convincing”, “highly suggestive”, “suggestive”, “weak”, or “nonsignificant” based on the number of cases, statistically significant effect estimates, prediction intervals, small‐study effects, excess significance bias, and heterogeneity (Table 1) [33, 34, 35, 36].
We performed sensitivity analyses by 1) excluding original studies within each meta‐analysis that had a high risk of bias as rated by the Newcastle‐Ottawa Scale (NOS), and 2) excluding original studies within each meta‐analysis with small sample sizes (< 25th percentile) [37], and 3) analyses restricted to cohort studies (prospective and retrospective) to assess the potential influence of temporality and reverse causation.
All statistical analyses were performed using the “meta” (Version 6.5.0) and “metaumbrella” (Version 1.0.6) packages in R (The R Foundation, Vienna, Austria) [38, 39].
Results
3
Study Selection
3.1
The database searches yielded 4009 Results (Figure 1). After duplicate removal, two reviewers (M.W. and P.K.) independently screened 2524 publication titles and abstracts and assessed 41 full‐text publications. After full‐text review, 21 SRMAs were included in the umbrella review (Appendix C). A bibliography of excluded full‐text articles with reasons (commonly incorrect exposure, outcomes or study design) is included in Appendix D.
PRISMA flow diagram of the selection process of systematic reviews with meta‐analysis of metabolic syndrome and obesity‐related cancer risk and survival.
Study Characteristics (Table 2)
3.2
Together, the 21 SRMAs comprised a total of 98 original studies on MetS and ORC risk or survival [40, 41, 42, 43, 44, 45, 46, 47, 48, 49, 50, 51, 52, 53, 54, 55, 56, 57, 58, 59, 60]. Of the included SRMAs, 18 evaluated MetS with ORC risk, including a range of two to 43 original research studies [including cancers of postmenopausal breast (5), colorectum (5), liver (5), endometrium (3), thyroid (2), pancreas (1), ovary (1), kidney (1), and adenocarcinoma of the esophagus (1)]. Seven SRMAs evaluated MetS with ORC survival, with included survival studies ranging from two to 12 [including cancers of colorectum (6) and liver (1)]. Of these reviews, five evaluated ORC‐specific survival, and five evaluated overall survival.
The individual SRMAs included studies that utilized varying definitions of MetS (Table 2), including traditional definitions from the National Cholesterol Education Program Adult Treatment Panel III (NCEP ATP III) [61], International Diabetes Foundation (IDF) [62], and American Heart Association (AHA) [63], as well as non‐traditional definitions including self‐report of three or more metabolic abnormalities and population z‐scores or quartiles for selected biomarkers. Thirty unique associations were re‐estimated and assessed for the certainty of evidence, including 25 associations with ORC risk and 5 with survival.
Risk of bias (Tables S1 and S2)
3.3
Using the AMSTAR2 tool, all SRMAs had “critically low” quality of evidence due to poor systematic review methodology and questionable reporting for transparency and reproducibility [no a priori protocol (n = 19), no justification for excluded studies (n = 20), inadequate database searches (n = 14), no assessment of publication bias (n = 4), no bias implication discussion (n = 2), and incomplete risk of bias assessment (n = 1)]. Only 2 (9.5%) SRMAs reported written and published protocols, and only one SRMA provided a justification for excluded studies [40, 52, 53]. As all articles received a ‘critically low” rating, a subgroup analysis by AMSTAR 2 rating was not performed. However, when the criteria of protocol registration and justification for excluded studies were excluded from the AMSTAR2 assessment, most SRMAs were rated as presenting moderate to high quality evidence, with only six studies remaining in the “critically low” category. Four studies were categorized as high quality, seven as moderate quality, and six as low quality (Table S2).
Strength and Certainty of Evidence (Table 3, Figures 2 and 3)
3.4
*Forest plots of the association between metabolic syndrome and obesity‐related cancer risk. ***Highly suggestive evidence (class II), **Suggestive evidence (class III), Weak evidence (class IV), no asterisk (nonsignificant). Determined using the modified Ioannidis criteria outlined in Table 2. Abbreviations: N, number (of studies); HR, hazard ratio; CI, confidence interval; PM, postmenopausal; CRC, colorectal cancer; EAC, esophageal adenocarcinoma cancer; NCEP, The National Cholesterol Education Program ATP III; IDF, The International Diabetes Federation; AHA, American Heart Association.
*Forest plots of the association between metabolic syndrome and obesity‐related cancer survival. ***Highly suggestive evidence (class II), **Suggestive evidence (class III), Weak evidence (class IV), no asterisk (nonsignificant). Determined using the modified Ioannidis criteria outlined in Table 2. Abbreviations: N, number (of studies); HR, hazard ratio; CI, confidence interval; CRC, colorectal cancer; ORC, obesity‐related cancer.
Metabolic Syndrome and Obesity‐related Cancer Risk
3.4.1
Overall, 25 unique associations (unique exposure such as MetS by a specific definition, unique study population such as by sex, or unique outcome such as cancer type) evaluated MetS and ORC risk. Of these 25 associations, 13(52%) had data on more than 1000 cases and 18(72%) showed high heterogeneity (I ^2^ > 50%).
Nine unique associations evaluated MetS and the overall risk of ORC, including those of postmenopausal breast, colorectal, esophageal adenocarcinoma, endometrial, liver, pancreatic, and renal cancers. Of these, eight indicated modest to moderately strong associations with ORC, with hazard ratios ranging from 1.21 to 1.74. Two SRMAs were classified as ‘highly suggestive’ (colorectal and renal), two as ‘suggestive’ (postmenopausal breast and endometrial), and the rest as ‘weak’ evidence, as determined by the modified Ioannidis criteria. Two associations, including MetS with thyroid and ovarian cancers, suggested a positive association (HR 1.07 and 1.27, respectively), but neither reached statistical significance (class “ns” evidence as determined by the modified Ioannidis criteria), though each only included two original studies. Overall, 17 (68%) of the 25 associations were statistically significant and suggested increased risk.
Four unique associations evaluating MetS and ORC risk were stratified by sex. In males, the associations reported between MetS and colorectal and liver cancer risk showed a moderately increased risk [HR (CI): 1.38(1.26–1.51) and 1.41(1.03–1.92), respectively]. The association with colorectal cancer risk was classified as ‘highly suggestive’, while the association with liver cancer was classified as ‘weak’ evidence due to the small number of liver cancer cases (n = 614) and p > 0.001. The associations with pancreatic and thyroid cancers also suggested a positive association. In females, the associations between MetS and colorectal and pancreatic cancer risk reported as moderately strong evidence (HR (CI): 1.35(1.19–1.53) and 1.58(1.36–1.83), respectively). The association between MetS and the risk of colorectal cancer was classified as ‘highly suggestive’, while the risk of pancreatic cancer was classified as ‘weak’ evidence due to the small number of pancreatic cancer cases (n = 527). The associations with liver and thyroid cancers also suggested a positive association.
Eight unique associations evaluating MetS and the risk of an ORC were stratified by MetS definition. Associations between MetS and colorectal, endometrial, and liver cancers reported moderate evidence for these associations with HR ranging from 1.35 to 1.81 using the NCEP MetS definition. Colorectal and endometrial associations were classified as ‘suggestive’ evidence, while the association between MetS and liver cancer risk was statistically significant but classified as ‘weak’ evidence due to p > 0.001. When using the IDF MetS definition, the association with colorectal cancer was moderately strong [HR (CI): 1.50(1.18–1.90)] and was classified as ‘suggestive’, while the associations with liver and endometrial cancer were classified as ‘weak’ despite moderate strength (HR 1.57 and 1.36, respectively) due to p > 0.001 for both associations and a small number of liver cancer cases (n = 915).
Overall Survival
3.4.2
Two SRMAs reported on the association between MetS and overall survival. Both associations had high heterogeneity (I ^ 2 ^ > 50%). There was a modest association between MetS and colorectal cancer overall survival [HR (CI): 1.29(1.07–1.57)], however, this association was classified as ‘weak’ evidence due to p > 0.001.
Cancer‐specific Survival
3.4.3
Only one SRMA evaluated ORC‐specific survival (specifically, colorectal cancer) and reported results for colorectal‐specific survival and stratified by sex [45]. The association between MetS and colorectal cancer‐specific survival was classified as ‘weak’ evidence due to the number of colorectal cancer cases not being > 1000 (n = 1000) as determined by the modified Ioannidis criteria. However, the reported HR showed modest evidence for this association [HR (CI): 1.29(1.12–1.48)]. The association between MetS and ORC‐specific survival ranged from 1.20–1.33 in both males and females, and had low heterogeneity. The evidence in males was classified as ‘suggestive’, while the evidence in females was classified as ‘weak’ due to the low number of cases (n = 957) and p > 0.001 [HR (CI): 1.33(1.17–1.51) and 1.20(1.05–1.36), respectively].
MetS Severity Score and ORC Risk and Survival
3.4.4
Only two SRMAs reported results stratified by MetS severity score (Shen et al., examining MetS and colorectal cancer risk, and Lu B et al., examining MetS in relation to colorectal cancer‐specific and overall survival). Both studies used a continuous score based on the number of MetS components present. In these analyses, relative risks increased with a greater number of abnormal metabolic components, indicating a dose–response‐like relationship and suggesting that higher metabolic dysfunction is associated with progressively higher risk (Figure 4). While most associations were classified as ‘weak’ evidence (p > 0.001), the association between having two or three or more MetS components and colorectal cancer–specific survival demonstrated a 2.6‐ and 4.5‐times poorer survival and was categorized as ‘suggestive’ evidence.
*Forest plots of the association between metabolic syndrome severity score and colorectal cancer (CRC) risk and survival. **Suggestive evidence (class III), Weak evidence (class IV), no asterisk (nonsignificant). Determined using the modified Ioannidis criteria outlined in Table 2. Abbreviations: N, number (of studies); HR, hazard ratio; CI, confidence interval; CRC, colorectal cancer.
In sensitivity analyses, excluding SRMAs with low quality via the NOS scale downgraded the strength of evidence of seven associations one class, one association was downgraded two classes, and one association was upgraded one class [most were downgraded from class III to IV, one was downgraded from class II to III, one was downgraded from class III to nonsignificant, and renal cancer risk was upgraded from class II to class I (convincing evidence)]. Excluding SRMAs with small sample sizes (< 25th percentile) downgraded the strength of evidence of seven associations by one class (most were downgraded from class III to IV; one was downgraded from class II to III). All associations were downgraded for increases in p‐value only. The remaining associations retained the same rank (data not shown). Finally, to address reverse causation, we conducted sensitivity analyses restricted to only cohort studies (including both prospective and retrospective designs). All SRMAs for survival already included only cohort studies, as did the SRMAs for liver and ovarian cancer risk, thus, these reported estimates are less susceptible to reverse causation. A sensitivity analysis was not performed for thyroid cancer risk as the SRMA only included one cohort study. For all other cancer types, analyses restricted to only cohort studies produced associations that were consistent in both direction and statistical significance with our overall results from the main analyses. The strength of evidence ratings were downgraded for breast and renal cancers due to weaker p‐values, and for endometrial cancer due to a reduced number of cases. However, all associations still retained the same strength of association as those not restricted to cohort studies, and the overall interpretation remained unchanged (Table S3).
Reporting bias (Table 3)
3.5
The Egger's and excess significance tests were significant for 8(32%) associations between MetS and ORC risk and 3(60%) associations between MetS and ORC survival, suggesting significant small study effects and selective outcome reporting and bias in the reported literature for these associations.
Discussion
4
In this umbrella review of observational studies, we identified 21 SRMAs reporting on 30 unique associations between MetS and ORC risk or survival. Multiple highly suggestive or suggestive associations indicated the increased risk of certain ORCs and poorer survival in individuals with MetS. However, there was significant heterogeneity among studies for most associations. This may be due to varying MetS definitions (traditional vs. non‐traditional) and study designs (case–control, cohort, cross‐sectional) of the original research studies. The stratified results by MetS definition showed large differences in ORC risk. Therefore, a uniform assessment of metabolic dysfunction may be needed to better understand its role in ORC risk and survival and allow for comparison between studies. Furthermore, despite the strength of these associations, all included SRMAs had more than one critical weakness, resulting in a “critically low” rating per the AMSTAR 2 criteria. Additionally, though these findings largely support a relationship between MetS and the development of most ORCs, there is still limited evidence on survival.
The connection between MetS and cancer continues to be widely studied with increases in prevalence of MetS worldwide, and there is growing evidence that MetS may play a role in the development and progression of tumors through several linked biological and lifestyle‐related factors. Biologically, MetS may lead to tumor development and progression through disruption or activation of one or multiple pathways, including gastrointestinal dysbiosis, altered adipokine and hormone release, insulin resistance, inflammation, dyslipidemia, oxidative stress, and shared behavioral risk factors [64]. Adipokines, cytokines released by adipocytes, have many functions in metabolism, cell signaling, and inflammatory pathways [65]. Specifically, decreased adiponectin has been associated with the development and progression of several cancers, as well as the development of insulin resistance, cardiovascular disease, and dyslipidemia. Because of these observations, some studies have suggested that adiponectin may be an important new marker of MetS [65]. Additionally, the excess release of leptin and resistin may lead to insulin resistance and subsequent aberrant cell proliferation and inflammation [66, 67]. TNF‐α also drives inflammation, autoimmunity, proliferation, angiogenesis, and other processes that may promote tumor development and progression [68]. Insulin resistance, a vital component of metabolic dysfunction, has been associated with the risk of several ORCs, including colorectal, gastric, pancreatic, liver, endometrial, and kidney cancer [69]. Newer evidence also suggests an association between insulin resistance and ORC survival. A recently published meta‐analysis comprised of 151 cohorts (including over 32 million individuals) observed a 1.25 times worse cancer survival in individuals with type‐2 diabetes [70].
In addition to these biological links, MetS and cancer also share common behavioral risk factors that may further influence disease development and survival, including physical activity, energy intake, and sedentary behavior [66, 71, 72, 73]. Additionally, both cancer development and cancer treatments may increase the risk of developing MetS, which may negatively impact survival [72]. MetS may further worsen survival by contributing to sarcopenia (the loss of skeletal muscle mass) and cardiovascular disease in patients with cancer [74].
A key limitation of this umbrella review is the generally low methodological quality of included SRMAs as assessed by AMSTAR 2, with the majority receiving “critically low” ratings. In most cases, these low ratings were primarily driven by the absence of pre‐registered protocols and the absence of justification for excluded studies. When these two criteria were removed from the AMSTAR2 assessment, half of the SRMAs received a high or moderate quality rating. It is important to recognize that AMSTAR 2 assigns a low quality rating if even a single critical domain is unmet, regardless of strengths in other areas (comprehensive search strategies and appropriate meta‐analytical methods). This may result in an underestimation of the potential validity and significance of findings in SRMAs that otherwise demonstrate robust methodology. Therefore, these evaluations of the methodological quality should be interpreted alongside other indicators of study quality.
In addition to this limitation, we may have missed relevant SRMAs that were not published in the English language or that were not indexed in our selected six databases. Furthermore, as this umbrella review was conducted using observational studies, there is a potential for unmeasured confounding, misclassification of MetS or ORC status, and/or reverse causality, biasing the included SRMA risk estimates. A few original studies did not report adequate sample size information, which may affect their overall weighting in the meta‐analyses. However, we expect this effect to be minimal due to the small number (n = 9) of original studies with missing sample sizes. Lastly, varying definitions of MetS were accepted as the exposure, which may have contributed to the high heterogeneity found in some analyses. However, this variability may reflect the broader lack of a universally accepted, standardized definition of MetS worldwide, rather than a limitation specific to this study. Consequently, differences in diagnostic criteria remain an inherent challenge in synthesizing evidence in this field. Heterogeneity in the pooled estimates may also reflect the variability in the covariates that were adjusted for in the individual studies included in the SRMAs. Despite these limitations, this review has many strengths and direct clinical relevance. To our knowledge, this is the first umbrella review conducted to systematically synthesize and assess the current evidence between MetS and ORC risk and survival. We designed and published a priori a detailed protocol that utilizes established standards (Cochrane and JBI) to reduce bias and enable transparency and reproducibility. Furthermore, we conducted this umbrella review while adhering to the PRISMA guidelines, and all protocol deviations were described and justified, further enhancing transparency. We employed a comprehensive search across different databases with robust selection methodologies. The study team for this umbrella review comprised content (MetS and ORC) and methods (epidemiologists, statisticians, librarians) experts. Additionally, including any geographic location or setting as part of our research question enhances the generalizability of these findings. The included SRMAs evaluated several ORCs and contained large numbers of both individuals with cancer and MetS. We also evaluated the quality and certainty of published evidence by using well‐established methods, including AMSTAR 2 and the modified Ioannidis criteria.
Overall, the consistent observation of increased ORC risk in individuals with MetS, supported by modest to moderate estimates and replicated across multiple SRMAs, underscores the real‐world clinical relevance of these findings. Although the strict methodological requirements of AMSTAR2 and the modified Ioannidis criteria may dampen the certainty of the evidence, the repeated observation of this association across diverse populations indicates a likely relationship between MetS and ORC and a clear need for targeted public health interventions to mitigate such an increased risk. Our results reinforce the importance of early detection and management of MetS, not only to prevent cardiovascular disease but also as a strategy for cancer prevention. Interventions that improve metabolic health, including lifestyle modification, pharmacological management of metabolic risk factors, and broader population‐level strategies to address obesity and physical inactivity, could play a crucial role in lowering the growing burden of obesity‐related cancers.
Conclusions
5
The results from this umbrella review indicate that metabolic syndrome (MetS) is associated with an increased risk of several obesity‐related cancers (ORCs), including breast, colorectal, esophageal, endometrial, liver, ovarian, pancreatic, and renal cancer, as well as poorer colorectal cancer survival. Although there is variability in study quality, the consistency and strength of these associations, particularly for colorectal cancer, highlight the importance of addressing MetS as a key modifiable risk factor in cancer development and progression. Public health strategies aimed at early identification, prevention, and management of MetS in the general population, as well as among individuals living with or at risk for cancer, are urgently needed.
Many of the limitations discussed in these SRMAs may be addressed by adhering to PRISMA guidelines [15, 29]. While the need for stronger, methodologically rigorous research remains, lifestyle interventions, medical management of metabolic risk factors, and policy‐level actions targeting obesity and physical inactivity should be prioritized to reduce the burden of ORCs. Randomized controlled trials aimed at improving the metabolic health of the general population and patients with cancer may be warranted to better understand the relationship between MetS and ORC risk and survival. Nonetheless, efforts to reduce metabolic dysfunction should not be delayed given the growing impact of both obesity and ORCs on global health.
Funding
This study was supported by the following grants from the National Institute of Health: NCI K07 CA222060 (S.Hardikar), NCI R00 CA218694 (M.Playdon), NCI F30CA278348 (M.Winn), T32DK091317 NIDDK (M.Winn), NCI K00CA2644000 (P.Karra), NCI F99CA264400 (P.Karra). (The content does not necessarily represent the official views of the NIH).
Conflicts of Interest
The authors declare no conflicts of interest.
Supporting information
Table S1: Quality assessment of studies included in the umbrella review using the A MeaSurement Tool to Assess systematic Reviews (AMSTAR) 2 criteria. Table S2: Quality assessment of studies included in the umbrella review using the A MeaSurement Tool to Assess systematic Reviews (AMSTAR) 2 criteria, removing two critical domains^a^. ^a^Removing two critical domains, including 1) Registered protocol prior to conducting the review, and 2) Provided justification for excluded studies. Table S3: Strength and certainty of evidence including only cohort studies evaluating metabolic syndrome with obesity‐related cancer risk. Abbreviations: ORC, obesity‐related cancer; HR, hazard ratio; CI, confidence interval; PI, prediction interval; ESB, excess significance. Appendix A: Deviations from the Protocol with Justifications. Appendix B: Search strategy from database inception to January 03, 2023, for systematic reviews with meta‐analysis of metabolic syndrome and obesity‐related cancer risk and survival. Appendix C: Bibliography of included systematic reviews with meta‐analysis. Appendix D: Bibliography of excluded publications at the full‐text review stage with reasons for exclusion.
The reference list from the paper itself. Each links out to its DOI / PubMed record.
- 1Third Report of the National Cholesterol Education Program (NCEP) Expert Panel on Detection, Evaluation, and Treatment of High Blood Cholesterol in Adults (Adult Treatment Panel III) Final Report,” Circulation 106, no. 25 (2002): 3143–3421.12485966 · pubmed ↗
- 2M. Junyent , D. K. Arnett , M. Y. Tsai , et al., “Genetic Variants at the PDZ‐INTERACTING Domain of the Scavenger Receptor Class B Type I Interact With Diet to Influence the Risk of Metabolic Syndrome in Obese Men and Women,” Journal of Nutrition 139, no. 5 (2009): 842–848, 10.3945/jn.108.101196.19321583 PMC 2714388 · doi ↗ · pubmed ↗
- 3M. Garaulet and J. A. Madrid , “Chronobiology, Genetics and Metabolic Syndrome,” Current Opinion in Lipidology 20, no. 2 (2009): 127–134, 10.1097/MOL.0b 013e 3283292399.19276891 · doi ↗ · pubmed ↗
- 4A. J. Lusis , A. D. Attie , and K. Reue , “Metabolic Syndrome: From Epidemiology to Systems Biology,” Nature Reviews. Genetics 9, no. 11 (2008): 819–830, 10.1038/nrg 2468.PMC 282931218852695 · doi ↗ · pubmed ↗
- 5T. Wilsgaard and B. K. Jacobsen , “Lifestyle Factors and Incident Metabolic Syndrome. The Tromso Study 1979‐2001,” Diabetes Research and Clinical Practice 78, no. 2 (2007): 217–224, 10.1016/j.diabres.2007.03.006.17448561 · doi ↗ · pubmed ↗
- 6E. A. Molenaar , J. M. Massaro , P. F. Jacques , et al., “Association of Lifestyle Factors With Abdominal Subcutaneous and Visceral Adiposity: The Framingham Heart Study,” Diabetes Care 32, no. 3 (2009): 505–510, 10.2337/dc 08-1382.19074991 PMC 2646037 · doi ↗ · pubmed ↗
- 7L. Djousse , J. A. Driver , J. M. Gaziano , J. E. Buring , and I. M. Lee , “Association Between Modifiable Lifestyle Factors and Residual Lifetime Risk of Diabetes,” Nutrition, Metabolism, and Cardiovascular Diseases 23, no. 1 (2013): 17–22, 10.1016/j.numecd.2011.08.002.PMC 327462421982361 · doi ↗ · pubmed ↗
- 8G. Hirode and R. J. Wong , “Trends in the Prevalence of Metabolic Syndrome in the United States, 2011‐2016,” Journal of the American Medical Association 323, no. 24 (2020): 2526–2528, 10.1001/jama.2020.4501.32573660 PMC 7312413 · doi ↗ · pubmed ↗