A Meta‐analysis of Functional Outcomes and Recovery Metrics Comparing Transoral Robotic Surgery and (Chemo)Radiotherapy
Simpson Shiu Chung Tam, Nihal Sogandji, Muzammil Arif Din Abdul Jabbar, Shazia Huma Absar, Mikesh Kalpesh Patel, Jeffrey Tooze, Eleanor Barker, Manaf Khatib, George Mochloulis, Anant Patel, Amit Gupta

TL;DR
This study compares outcomes of robotic surgery and (chemo)radiotherapy for treating head and neck cancers, focusing on swallowing and recovery.
Contribution
The paper provides the most extensive meta-analysis to date on functional outcomes comparing transoral robotic surgery and (chemo)radiotherapy.
Findings
Transoral robotic surgery reduced gastrostomy tube use at 6 and 12 months.
Pain levels were lower in the robotic surgery group in the long term.
Swallowing outcomes were poorer in the robotic surgery group at 12 months.
Abstract
To assess patient outcomes with regard to swallowing, feeding tube dependence, tracheostomy use, pain levels, and recovery metrics between transoral robotic surgery and (chemo)radiotherapy. Medline, EMBASE, Web of Science Core Collection, and the Cochrane Library. A meta‐analysis was conducted in accordance with the Preferred Reporting Items for Systematic Reviews and Meta‐analyses guidelines through a literature search of data sources (CRD42023464144). Sixteen studies comprising 2185 patients were included. There were no significant differences in sex and age distribution between the transoral robotic surgery and (chemo)radiotherapy groups. Most patient demographics and disease status at baseline were comparable between the two groups. Meta‐analysis of the studies found reduced gastrostomy tube usage in the transoral robotic surgery group at 6 and 12 months albeit poorer swallowing…
Genes, proteins, chemicals, diseases, species, mutations and cell lines named across the full text — each resolved to its canonical identifier and authoritative record.
Click any figure to enlarge with its caption.
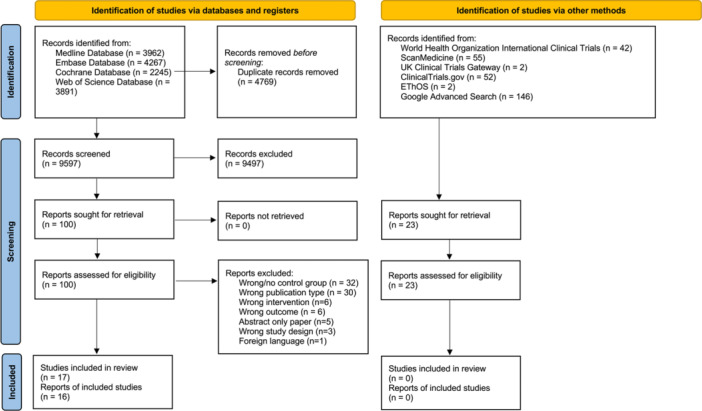 Figure 1
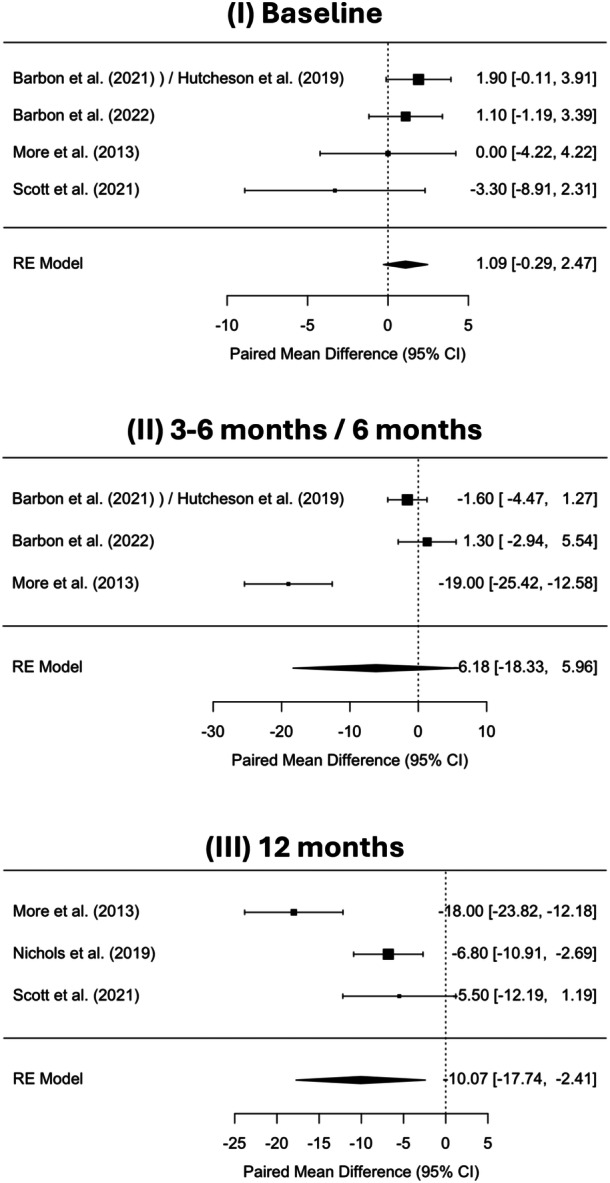 Figure 2
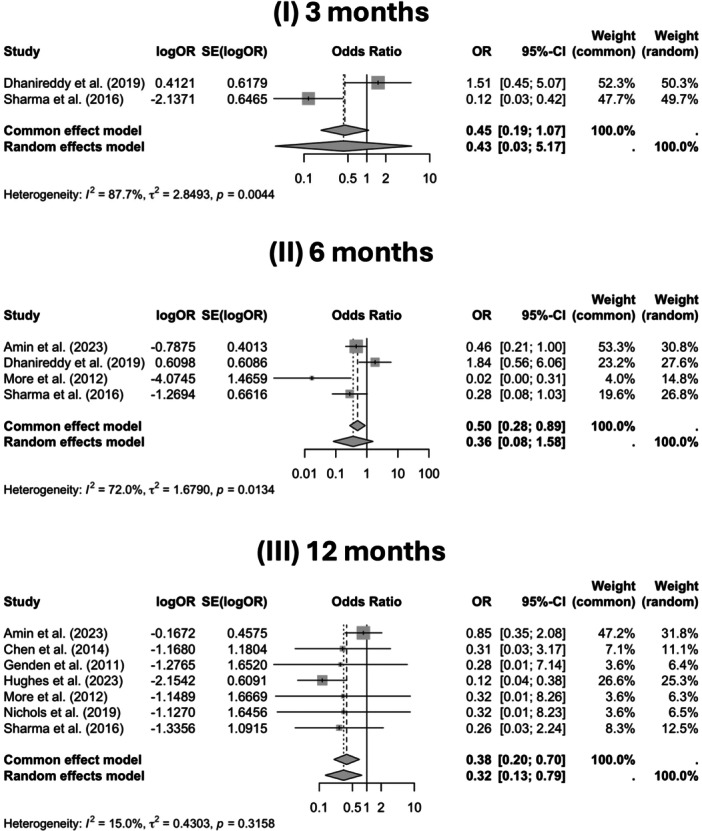 Figure 3
| Outcome | No. of studies | Study design | Relative effect (95% CI) | Absolute effect | Certainty (•) | Notes (downgrades/upgrades) |
|---|---|---|---|---|---|---|
| Swallowing function (MDADI) at 3 to 6/6 mo | 3 | Design type: 3 observational; orientation: 3 prospective |
TORS: SMD −0.61 (approx. −0.79 to −0.42) Control: SMD −0.86 (approx. −1.01 to −0.72) |
TORS: −7.05 points Control: −11.02 points |
| Lower MDADI scores reflect worse swallowing function. Control group showed a greater decline, suggesting TORS may better preserve function |
| Swallowing function (MDADI) at 12 mo | 3 | Design type: 2 observational, 1 randomized controlled trial; orientation: 3 prospective |
TORS: SMD –0.63 (95% CI: –1.21 to –0.06) Control: SMD –1.68 (95% CI: –2.79 to –0.57) |
TORS: –3.2 to –12.8 points Control: –5.8 to –18 points |
|
Downgraded for risk of bias and imprecision in some studies. Control group consistently showed greater decline. TORS may better preserve swallowing function |
| Gastrostomy tubes (at 3 mo) | 2 | Design type: 3 observational; orientation: 2 retrospective | 0.42 [0.03‐5.16] (random‐effects) | ↓ ~22 fewer events per 100 |
| Downgraded: inconsistency (substantial heterogeneity), imprecision (one study had wide CI and no significance; limited sample size) |
| Gastrostomy tubes (at 6 mo) | 4 | Design type: 4 observational; orientation: 1 prospective, 3 retrospective | 0.14 [0.017‐1.17] (random‐effects) | ↓ ~30 fewer events per 100 |
| Downgraded: inconsistency (substantial heterogeneity), imprecision (very wide CI) |
| Gastrostomy tubes (at 12 mo) | 7 | Design type: 5 observational, 1 case‐control, 1 randomized controlled trial; orientation: 3 prospective, 4 retrospective | 0.35 [0.17‐0.73] (random‐effects) | ↓ ~12‐20 fewer events per 100 |
| Downgraded: inconsistency (substantial heterogeneity), imprecision (very wide CI) |
| Pain level (EORTC H&N 35 at 12 mo) | 2 | Design type: 1 observational, 1 randomized controlled trial; orientation: 2 prospective | Inconsistent (−4.3 to +2.2) | Inconsistent differences |
| Downgraded: inconsistency and imprecision due to unknown sample sizes and opposing results |
| TORS | Adjuvant therapies | Control treatment | |||||||||||
|---|---|---|---|---|---|---|---|---|---|---|---|---|---|
| Author | Number of patients | % female | % male | Age (mean) | Age (median) | Type | Number of patients (%) | Control treatment | Number of patients | % female | % male | Age (mean) | Age (median) |
| Amin et al | 363 | 22.9 | 77.1 | 69.2 | n.r. | None | ‐ | Radiotherapy or chemoradiotherapy | 363 | 22.9 | 76.9 | 68.6 | n.r. |
| Barbon et al | 75 | 86.7 | 13.3 | 58 | n.r. | CRT | 15 (20%) | Radiotherapy | 182 | 13.7 | 86.3 | 59 | n.r. |
| Hutcheson et al | |||||||||||||
| Barbon et al | 38 | 15.8 | 84.2 | n.r. | 58 | CRT, RT | 8 (21%), 9 (24%) | Radiotherapy | 97 | 18.6 | 81.4 | n.r. | 57.5 |
| Chen et al | 31 | 16.1 | 83.9 | n.r. | 52 | CRT, RT | 5 (16%), 26 (84%) | Chemoradiotherapy | 31 | 16.1 | 83.9 | n.r. | 53 |
| Dhanireddy et al | 65 | 26.2 | 73.8 | n.r. | 61 | CRT, RT | 24 (37%), 24 (37%) | Chemoradiation | 54 | 53.7 | 46.3 | n.r. | 57.9 |
| Genden et al | 30 | 13.3 | 86.7 | n.r. | 52 | CRT, RT | 11 (37%), 14 (47%) | Chemoradiation | 26 | 23.1 | 76.9 | n.r. | 58 |
| Hughes et al | 116 | n.r. | n.r. | n.r. | 59 | CRT, RT | 33 (28%), 30 (26%) | Radiotherapy | 51 | n.r. | n.r. | n.r. | 58 |
| Kaffenberger et al | 29 | 13.8 | 86.2 | 56.7 | n.r. | CRT, RT | 20 (27%), 9 (12%) | Chemoradiation or radiation | 44 | 15.9 | 84.1 | 57.6 | n.r. |
| Ling et al | 92 | 16.3 | 83.7 | n.r. | 56 | CRT, RT | 37 (40%), 15 (16%) | Chemoradiotherapy | 46 | 17.4 | 82.6 | n.r. | 58 |
| Meccariello et al | 60 | 21.7 | 78.3 | 64.3 | n.r. | CRT, RT | 20 (33%), 19 (32%) | Chemoradiotherapy | 69 | 20.3 | 79.7 | 61.1 | n.r. |
| More et al | 20 | 40 | 60 | n.r. | 54 | CRT, RT | 12 (60%), 8 (40%) | Chemoradiotherapy | 20 | 30 | 70 | n.r. | 56 |
| Nichols et al | 34 | 17.6 | 82.4 | n.r. | 58.1 | CRT, RT | 8 (24%), 16 (47%) | Radiotherapy | 34 | 8.8 | 91.2 | n.r. | 60 |
| Scott et al | 31 | 29 | 71 | n.r. | 59 | CRT | 4 (13%) | Radiotherapy ± chemotherapy | 13 | 15.4 | 84.6 | n.r. | 58 |
| Scott et al | 31 | 29 | 71 | n.r. | 59 | CRT | 6 (19%) | Radiotherapy | 13 | 15.4 | 84.6 | n.r. | 58 |
| Sharma et al | 39 | 5.1 | 94.8 | n.r. | 58 | CRT, RT | 11 (28%), 24 (62%) | Radiotherapy/chemoradiotherapy | 88 | 14 | 86 | n.r. | 57 |
| Average | 70 | 25.3 | 74.7 | 62.1 | 56.9 | 75 | 20.4 | 79.6 | 61.6 | 57.3 | |||
| TORS with or without adjuvant therapy | Control treatment | ||||||||||||||||||||||||||||||
|---|---|---|---|---|---|---|---|---|---|---|---|---|---|---|---|---|---|---|---|---|---|---|---|---|---|---|---|---|---|---|---|
| Author | Subsite | Cohort matching for T stage | Cohort matching for N stage | Cancer staging standards | T0 | T1 | T2 | T3 | T4 | Tx | N0 | N1 | N2 | N3 | N4 | Not reported | T0 | T1 | T2 | T3 | T4 | Tx | N0 | N1 | N2 | N3 | N4 | Not reported |
|
| Unilateral or bilateral node status |
| Chen et al | Oropharynx | Matched | Matched | AJCC | 0 | 14 | 12 | 5 | 0 | 0 | 0 | 5 | 26 | 0 | 0 | 0 | 0 | 14 | 12 | 5 | 0 | 0 | 0 | 5 | 26 | 0 | 0 | 0 | n.r. | n.r. |
|
| Amin et al | Oropharynx | Not matched | Not matched | n.r. | 0 | 0 | 0 | 0 | 0 | 363 | 0 | 0 | 0 | 0 | 0 | 363 | 0 | 0 | 0 | 0 | 0 | 363 | 0 | 0 | 0 | 0 | 0 | 363 | n.r. | n.r. | n.r. |
| Scott et al | Oropharynx | Not matched | Not matched | AJCC 7th edition | 0 | 15 | 16 | 0 | 0 | 0 | 16 | 15 | 0 | 0 | 0 | 0 | 0 | 6 | 4 | 1 | 2 | 0 | 0 | 12 | 1 | 0 | 0 | 0 | n.r. | n.r. |
|
| Barbon et al | Oropharynx | Not matched | Not matched | AJCC 7th edition | 0 | 40 | 34 | 1 | 0 | 0 | 31 | 15 | 29 | 0 | 0 | 0 | 0 | 84 | 92 | 6 | 0 | 0 | 19 | 20 | 143 | 0 | 0 | 0 | .5 | <.001 |
|
| More et al | Tonsil, base of tongue, oropharynx, epiglottis, tonsil | Matched | Not matched | AJCC | 0 | 6 | 8 | 6 | 0 | 0 | 1 | 8 | 11 | 0 | 0 | 0 | 0 | 6 | 6 | 8 | 0 | 0 | 0 | 8 | 12 | 0 | 0 | 0 | .92 | >.99 | n.r. |
| Scott et al | Oropharynx | Not matched | Not matched | Union for International Cancer Control TNM Atlas 7th edition | 0 | 15 | 16 | 0 | 0 | 0 | 16 | 15 | 0 | 0 | 0 | 0 | 0 | 6 | 4 | 1 | 2 | 0 | 0 | 12 | 1 | 0 | 0 | 0 | n.r. | n.r. | n.r. |
| Ling et al | Oropharynx | Not matched | Not matched | n.r. | 4 | 53 | 35 | 0 | 0 | 0 | 19 | 27 | 46 | 0 | 0 | 0 | 1 | 17 | 28 | 0 | 0 | 0 | 1 | 10 | 35 | 0 | 0 | 0 | .08 | <.001 | n.r. |
| Dhanireddy et al | Oropharynx | Matched | Not matched | AJCC 7th edition | 0 | 20 | 45 | 0 | 0 | 0 | 14 | 13 | 37 | 1 | 0 | 0 | 0 | 22 | 32 | 0 | 0 | 0 | 6 | 2 | 43 | 3 | 0 | 0 | .257 | <.001 |
|
| Kaffenberger et al | Oropharynx | Not matched | Not matched | AJCC 7th edition | 0 | 16 | 10 | 3 | 0 | 0 | 1 | 3 | 22 | 0 | 0 | 0 | 0 | 17 | 15 | 4 | 8 | 0 | 0 | 6 | 36 | 2 | 0 | 0 | .074 | .442 |
|
| Nichols et al | Oropharynx | Matched | Matched | AJCC 7th edition | 0 | 17 | 17 | 0 | 0 | 0 | 9 | 7 | 18 | 0 | 0 | 0 | 0 | 13 | 21 | 0 | 0 | 0 | 12 | 5 | 17 | 0 | 0 | 0 | n.r. | n.r. | n.r. |
| Sharma et al | Oropharynx | Matched | Not matched | n.r. | 0 | 16 | 18 | 6 | 0 | 0 | 5 | 7 | 24 | 3 | 0 | 0 | 0 | 22 | 51 | 15 | 0 | 0 | 7 | 8 | 64 | 9 | 0 | 0 | n.r. | n.r. |
|
| Hughes et al | Oropharynx | Not matched | Not matched | AJCC 8th edition | 3 | 60 | 53 | 0 | 0 | 0 | 25 | 84 | 7 | 0 | 0 | 0 | 0 | 10 | 41 | 0 | 0 | 0 | 1 | 33 | 17 | 0 | 0 | 0 | <.001 | <.001 |
|
| Barbon et al | Tonsil | Not matched | Not matched | AJCC 7th edition | 0 | 19 | 18 | 1 | 0 | 0 | 16 | 22 | 0 | 0 | 0 | 0 | 0 | 56 | 77 | 3 | 0 | 0 | 10 | 87 | 0 | 0 | 0 | 0 | <.001 | <.001 | No bilateral node status patients included |
| Meccariello et al | Oropharynx | Matched | Matched | AJCC 8th edition | 3 | 27 | 22 | 8 | 0 | 0 | 8 | 15 | 30 | 7 | 0 | 0 | 2 | 10 | 21 | 17 | 18 | 0 | 3 | 41 | 21 | 3 | 0 | 0 | n.r. | n.r. |
|
| Genden et al | Base of tongue, tonsil, oropharyngeal wall, soft palate, retromolar trigone, larynx, hypopharynx, nasopharynx, unknown primary | Not matched | Matched | AJCC | 0 | 14 | 16 | 0 | 0 | 0 | 6 | 10 | 14 | 0 | 0 | 0 | 1 | 4 | 14 | 3 | 4 | 0 | 4 | 7 | 15 | 0 | 0 | 0 | .003 | .18 |
|
| Sum | 10 | 372 | 354 | 31 | 0 | 363 | 198 | 261 | 293 | 11 | 0 | 363 | 4 | 371 | 510 | 69 | 34 | 363 | 82 | 276 | 574 | 17 | 0 | 363 | |||||||
| TORS with or without adjuvant therapy | Control treatment | ||||||
|---|---|---|---|---|---|---|---|
| Adjuvant | Adjuvant | Adjuvant | |||||
| Author | Indication | Type | Number of patients (%) | Control treatment | Indication | Adjuvant type | Number of patients (%) |
| Amin et al | ‐ | None | ‐ | RT/CRT | ‐ | None | ‐ |
| Barbon et al | n.r. | CRT | 15 (20%) | RT | n.r. | CRT | 152 (84%) |
| Hutcheson et al | RT | 22 (29.3%) | |||||
| Barbon et al | n.r. | CRT | 8 (21%) | Unilateral RT | Chemotherapy: | Chemotherapy | 28 (76%), |
| RT | 9 (24%) | Bilateral RT | Stage T3/T4 | Chemotherapy | 46 (77%) | ||
| Chen et al | n.r. | CRT | 5 (16%) | CRT | ‐ | None | ‐ |
| RT | 26 (84%) | ||||||
| Dhanireddy et al | CRT: | CRT | 24 (37%) | CRT | ‐ | None | ‐ |
| Extracapsular extension, the presence of extensive (>5) nodal disease | |||||||
| RT: | RT | 24 (37%) | |||||
| Close margins (<2 mm) perineural or lymphovascular invasion, N2 (a or b) disease | |||||||
| Genden et al | CRT: | CRT | 11 (37%) | CRT | ‐ | None | ‐ |
| Pathologic ENE, positive margins | RT | 14 (47%) | |||||
| RT: N2b/N2c/N3 disease, close final margins, T3 tumors | |||||||
| Hughes et al | CRT: | CRT | 33 (28%) | RT | Chemotherapy: | CRT | 50 (98.0%) |
| Positive margin or ENE | Positive margin or ENE | ||||||
| RT: | RT | 30 (26%) | |||||
| pT3 or higher tumor, pN2 or greater, perineural invasion, lymphovascular invasion, close margin (<2 mm) | |||||||
| Kaffenberger et al | n.r | CRT | 20 (27%) | CRT | ‐ | None | ‐ |
| RT | 9 (12%) | ||||||
| Ling et al | CRT: extracapsular extension or positive margins | CRT, | 37 (40%) | CRT | ‐ | None | ‐ |
| RT: ⩾N2 disease, angiolymphatic or perineural invasion, and close (<3 mm) margins | RT | 15 (16%) | |||||
| Meccariello et al | CRT: | CRT | 20 (33%) | CRT | ‐ | None | ‐ |
| Pathologic ENE or positive margins | |||||||
| RT: | RT | 19 (32%) | |||||
| N2b/N2c/N3 disease, close final margins, and all patients with T3 tumors | |||||||
| More et al | CRT: | CRT | 12 (60%) | ||||
| Extracapsular spread in cervical nodes, with surgical margins <10 mm | CRT | ‐ | None | ‐ | |||
| RT: | RT | 8 (40%) | |||||
| T3 primary tumor or N2 disease | |||||||
| Nichols et al | CRT: | CRT | 8 (24%) | RT | N1/2 | Chemotherapy | 23 (68%) |
| Positive margins or ENE | |||||||
| RT: | RT | 16 (47%) | |||||
| pT3 or pT4 disease, close resection margins [<2 mm], nodal disease, or lymphovascular invasion | |||||||
| Scott et al | CRT: | CRT | 5 (16%) | RT | Chemotherapy: | ||
| Positive margins, ENE, or more than one involved lymph node | Positive margins, ENE, or more than one involved lymph node | Chemotherapy | 9 (69%) | ||||
| Scott et al | CRT: | Chemotherapy: | |||||
| Positive margins (≥2 mm), ENE, or spread to more than one lymph node | CRT | 6 (19%) | RT | Positive margins (≥2 mm), ENE | Chemotherapy | 9 (69%) | |
| Sharma et al | n.r. | CRT | 11 (28%) | CRT | ‐ | None | ‐ |
| RT | 24 (62%) | RT | |||||
| TORS with or without adjuvant therapy | Control treatment | |||||
|---|---|---|---|---|---|---|
| Author | Positive | Negative | Not determined/unknown | Positive | Negative | Not determined/unknown |
| Amin et al | n.r. | |||||
| Barbon et al | All had HPV‐associated disease but p16 n.r. | |||||
| Barbon et al | All had HPV‐associated disease but p16 n.r. | |||||
| Chen et al | 20 (65%) | 11 (35%) | 0 (0%) | 20 (65%) | 11 (35%) | 0 (0%) |
| Dhanireddy et al | 52 (80%) | 10 (15%) | 3 (5%) | 25 (46%) | 3 (6%) | 26 (48%) |
| Genden et al | n.r. | |||||
| Hughes et al | All had either p16+ or HPV PCR | |||||
| Kaffenberger et al | 29 (100%) | 0 (0%) | 0 (0%) | 37 (84%) | 3 (7%) | 4 (9%) |
| Ling et al | TORS alone: 31 (77.5%) | TORS alone: 8 (20%) | TORS alone: 1 (2.5%) | Definitive CRT: 19 (41.3%) | Definitive CRT: 4 (8.7%) | Definitive CRT: 23 (50.0%) |
| TORS + adjuvant RT or CRT: 42 (80.8%) | TORS + adjuvant RT or CRT: 6 (1.9%) | TORS + adjuvant RT or CRT: 4 (7.7%) | ||||
| Meccariello et al | 35 (58.3%) | 19 (31.7%) | 6 (10%) | 42 (60.9%) | 6 (8.7%) | 21 (30.4%) |
| More et al | n.r. | |||||
| Nichols et al | 30 (88%) | 4 (12%) | 0 (0%) | 30 (88%) | 4 (12%) | 0 (0%) |
| Scott et al | n.r. | |||||
| Scott et al | 24 (77%) | n.r. | n.r. | 12 (92.3%) | n.r. | |
| Sharma et al | 30 (76.9%) | 1 (2.6%) | 8 (20.5%) | 30 (34.1%) | 7 (8.0%) | 51 (58.0%) |
| Author | Time points, mo | Scoring metric | TORS group score | Control group score |
|
|---|---|---|---|---|---|
| Barbon et al | 0; 3‐6; 24 | MDADI | 92; 83; 85.5 | 92.9/93.2; 88.0/82.0; 86.4/n.r. (unilateral RT/bilateral RT) | .9; .38; .99 |
| Nichols et al | 12 | MDADI | 80.1 | 86.9 | .04 |
| Scott et al | 0; 12 | MDADI | 93.3; 90.5 | 90; 85 | n.r.; n.r. |
| More et al | 3; 6; 12 | MDADI | 62; 76; 78 | 56; 57; 60 | Insignificant; .004 |
| Barbon et al | 0; 3‐6 | DIGEST grade ≥1 (%) | 25%; 45% | 16%; 42% | .06; .93 |
| Barbon et al | 3‐6 | MBSImP ‐ laryngeal vestibule closure (%) | 27% | 41% | .02 |
| Barbon et al | 3‐6 | MBSImP ‐ pharyngeal contraction (%) | 62% | 53% | .001 |
| Scott et al | 3; 12 | DIGEST grade 1 or 2 (%) | 54.8%; 29.0% | 23.1%; 45.5% | n.r.; n.r. |
| Scott et al | 12; 36 | DIGEST grade 1 or 2 (%) | 29%; 11.5% | 45.5%; 9.09% | n.r.; n.r. |
| Genden et al | 0.5 | FOIS | 5.5 ± 0.2 | 3.3 ± 0.6 | <.001 |
| Hughes et al | 12 mo | FOIS change distribution | −6: 1.0; −5: 1.0; −4: 1.0; −3: 1.0; −2: 2.9; −1: 29.4; 0: 58.8; +1: 4.9; +2: 0 | −6: 1.0; −5: 1.0; −4: 2.0; −3: 2.0; −2: 10.0; −1: 24.0; 0: 34.8; +1: 19.2; +2: 2.2 | .008 |
| Author | Metric | Timescale | TORS ± adjuvant therapy | Control treatment |
|
|---|---|---|---|---|---|
| Ling et al | UW‐QOL version 4 | 1 mo | 52 (27) | 64 (24) | n.r. |
| 6 mo | 81 (22) | 83 (21) | n.r. | ||
| 12 mo | 89 (23) | 78 (27) | n.r. | ||
| 24 mo | 86 (21) | 82 (25) | n.r. | ||
| Nichols et al | EORTC QLQ‐C30 | 1 y | 21.8 (25.2) | 8.0 (16.3) | .018 |
| EORTC H&N 35 | 1 y | 13.3 (14.9) | 9.0 (12.4) | .23 | |
| Scott et al | EORTC H&N 35 | Baseline | 9.1 (11.7) | 29.9 (19.9) | n.r. |
| 12 mo | 8.9 (13.8) | 11.1 (14.8) | n.r. | ||
| Overall change | Mean change −0.3 | Mean change −16.8 | n.r. | ||
| ( | ( |
| TORS ± adjuvant therapy | Control treatment | ||||||
|---|---|---|---|---|---|---|---|
| Author | Time scale | Number | Percentage (%) | Number | Percentage (%) | Odd ratio | Significance |
| Sharma et al | At 3 mo | 3 | 9 | 37 | 45 | 0.115 | <.001 |
| Amin et al | At 6 mo | n.r. | n.r. | n.r. | n.r. | 0.455 | .23 |
| Dhanireddy et al | At 6 mo | n.r. | n.r. | n.r. | n.r. | 1.84 | .31 |
| More et al | At 6 mo | 0 | 0 | 12 | 60 | 0 | <.001 |
| Sharma et al | At 6 mo | 1 | 0 | 18 | 72 | 0 | .04 |
| Amin et al | At 12 mo | n.r. | n.r. | n.r. | n.r. | 0.846 | .71 |
| Chen et al | At 12 mo | 1 | 3.23 | 3 | 9.68 | 1.30 | .01 |
| Genden et al | At 12 mo | 0 | 0 | 1 | 3.85 | 0.00 | .49 |
| Hughes et al | At 12 mo | 4 | 3.5 | 12 | 23.5 | 1.34 | <.001 |
| More et al | At 12 mo | 0 | 0 | 1 | 5 | 0.00 | 1.00 |
| Nichols et al | At 12 mo | 0 | 0 | 1 | 2.94 | 0.00 | 1.00 |
| Sharma et al | At 12 mo | 1 | 3 | 7 | 11 | 1.36 | .15 |
| Author | Metric | Timescale | TORS ± adjuvant therapy | Control treatment |
|
|---|---|---|---|---|---|
| Ling et al | UW‐QOL version 4 | 1 mo | 52 (27) | 64 (24) | n.r. |
| 6 mo | 81 (22) | 83 (21) | n.r. | ||
| 12 mo | 89 (23) | 78 (27) | n.r. | ||
| 24 mo | 86 (21) | 82 (25) | n.r. | ||
| Nichols et al | EORTC QLQ‐C30 | 1 y | 21.8 (25.2) | 8.0 (16.3) | .018 |
| EORTC H&N 35 | 1 y | 13.3 (14.9) | 9.0 (12.4) | .23 | |
| Scott et al | EORTC H&N 35 | Baseline | 9.1 (11.7) | 29.9 (19.9) | n.r. |
| 12 mo | 8.9 (13.8) | 11.1 (14.8) | n.r. | ||
| Overall change | Mean change −0.3 | Mean change −16.8 | n.r. | ||
| ( | ( |
Peer Reviews
No public reviews on file for this paper yet. If you reviewed it on a platform where reviews are public (OpenReview, ICLR, NeurIPS, ICML), you can paste yours below so the community can read it here.
Videos
No videos yet. Explain this paper in a talk, walkthrough, or lecture? Add one.
Taxonomy
TopicsHead and Neck Cancer Studies · Dysphagia Assessment and Management · Oral health in cancer treatment
The incidence of oropharyngeal squamous cell carcinoma (OPSCC) in North America and European countries has increased dramatically over the past decade.1, 2 OPSCC associated with infection with the high‐risk human papillomavirus (HPV)2 particularly HPV strain 16, accounts for 51.8% of all OPSCC cases in the United Kingdom.3 HPV‐associated OPSCC typically has a better prognosis than HPV‐negative OPSCC, the latter being more associated with risk factors such as smoking and alcohol consumption.2
The survival rates of OPSCC have also improved across decades, and whilst management may involve a combination of surgery, radiotherapy (RT), and chemotherapy, new treatments have now become available, including the use of transoral robotic surgery (TORS) for tumor removal. TORS offers increased precision and range of motion, with seven degrees of freedom compared to endoscopic instruments that have just four.4 Patients are thought to benefit from reduced pain, quicker recovery, shorter hospital stay, improved speech and swallowing, and minimal visible scars from small incisions.5 However, reported complications include postoperative hemorrhage, infection, dental trauma, and notably dysphagia.6, 7 Another consideration is the financial cost associated with this treatment. The Da Vinci system, including software upgrades, must be balanced against the potentially shorter hospital lengths of stay and reduced hospital costs.8
Few previous studies have evaluated the functional or quality of life outcomes following TORS for OPSCC compared to other treatments, including RT with or without concurrent chemotherapy. The findings of these studies have been ambivalent. Lee et al found improved MD Anderson Dysphagia Inventory (MDADI) scores with TORS at 12 months relative to open mandibulotomy.9 Previous reviews have also suggested TORS could be superior to RT in preserving swallowing10, 11 although these reviews have mostly included retrospective, non‐randomized studies with relatively short follow‐up times. A review by Campo et al reported no statistically significant difference in the mean MDADI scores following TORS or RT for OPSCC at 12 months.12 On the other hand, the first randomized study on the subject, the ORATOR trial, found superior swallowing‐related quality of life outcomes among patients receiving RT treatment, measured by MDADI scores after 1 year of follow‐up.13
As such, this systematic review aims to compare a wide variety of outcomes amongst patients diagnosed with OPSCC who were treated with TORS against those who were treated with (chemo)radiotherapy (CRT). Several key outcomes are evaluated, including pain scores and the impact on swallowing and speaking function.
Methodology
The systematic review was reported in accordance with the Preferred Reporting Items for Systematic reviews and Meta‐analyses (PRISMA) guidelines.14 The review protocol was registered with the International Prospective Register of Systematic Reviews (PROSPERO) on September 20, 2023, and is publicly available (registration number CRD42023464144).15 The full protocol is included in Supplemental Section S1, available online.
Search
We searched the following databases from 1997 to September 25, 2023: Medline (1997‐present), EMBASE (1997‐present), Web of Science Core Collection (1997‐present), and the Cochrane Library (1997‐present). The search strategy involves first identifying terms related to cancer, tumors, or oncology, using keywords such as “(cancer* or carcinoma* or neoplasm* or malignan* or tumor* or tumour* or oncolog* or sarcoma* or metasta* or lesion*)” or terms related to abnormal or pathological growths: “(abnormal or pathological adj (growth* or mass*)).” This is then filtered by terms specific to head and neck regions, including “(craniofacial or facial or head or neck or larynx or pharynx or nasal or skull or jaw or salivary glands or tongue or esophag*).” Finally, the search includes terms related to robotic or computer‐assisted surgery, such as “((robot* or mechan* or automat* or technology assist* or computer guided) adj3 (surg* or procedure*)).”
The authors chose to include studies published after 1997, as the United States Food & Drug Administration cleared Intuitive Surgical's da Vinci surgical system for assisting in surgeries in that year. The search methodology used is attached in Supporting Information, available online.16
Gray literature was searched on the World Health Organization International Clinical Trials Registry Platform, ScanMedicine, UK Clinical Trials Gateway, ClinicalTrials.gov, EThOS, and Google Advanced Search.
The whole search record was saved in EndNote17 and screened by at least two authors on Rayyan.18
Eligibility Criteria
Studies were considered eligible if they met the following inclusion criteria:
Inclusion criteria:
- 1.Studies must be one of randomized control studies, prospective studies, case‐controlled and cohort studies.
- 2.Patients enrolled in the study must be aged 18 or above.
- 3.The study involves TORS with or without adjuvant therapy and compares outcomes against CRT or RT alone.
- 4.The study assesses the swallowing and speaking functions, the incidence of tracheostomies, the use of nasogastric tube, the use of gastrostomy tube, recovery metrics or pain levels.
- 5.The setting of the study is in a hospital.
- 6.The study must be written in English, Spanish, or Chinese.
Exclusion criteria:
- 1.Studies cannot be presented as abstract‐only papers, preceding papers, conference papers, editorials, theses, reviews, and books.
Study Selection
Titles and abstracts were reviewed by two independent reviewers against the inclusion criteria, and discrepancies were resolved through discussion with a third independent reviewer. All papers were double‐screened. Any discrepancies that arose were identified, addressed, and subjected to group discussions.
Following title and abstract screening, full texts were assessed against pre‐defined inclusion criteria. Cross‐referencing of included papers was performed to identify any previously overlooked articles.
Following this, a “snowballing” technique was applied, wherein all articles citing the included papers underwent screening of their title and abstract. Any newly discovered articles were then subjected to another round of title, abstract, and full‐text screening, if deemed relevant and appropriate.
Data Extraction and Risk‐of‐Bias Assessment
Relevant data were extracted from each included study, including study characteristics, baseline demographic and clinical information (such as tumor stages and nodal stages), and outcomes for individuals in both the TORS and CRT groups. Data extraction was carried out by two independent reviewers.
Three independent reviewers conducted critical appraisals using the Cochrane Risk of Bias 2 (RoB 2) tool19 for the randomized controlled trial, and the Risk of Bias in Non‐randomized Studies of Interventions (ROBINS‐I) tool for the non‐randomized study.20 Studies exhibiting a critical risk of bias would be excluded from the analysis.
Statistical Analysis
Following data extraction, Student's t test assuming equal variance was used to determine if there are any significant differences in patient selection based on tumor and nodal staging. Analyses were performed using Microsoft Excel v16.78.21
A meta‐analysis was conducted to evaluate pooled effects at 3, 6, and 12 months. We extracted or calculated log‐transformed odds ratios (ORs) and standard errors. Where data were missing, confidence intervals (CIs) were inferred or imputed. Pooled estimates were computed using fixed and random‐effects models. Heterogeneity was assessed using I², τ², and Cochran's Q test. Study weights were assigned via inverse‐variance. A significance level of P < .05 was used for statistical tests. Analyses were performed using R version 4.4.022 with the meta package version 8.0‐1.23 Forest and funnel plots, if applicable, are generated to visualize individual study estimates and pooled ORs at each time point. GRADE methodology was used to evaluate evidence certainty.24
Deviations From the Protocol
HPV status and the presence of the p16 intracellular protein, involved in cell cycle checkpoint and retinoblastoma control, were used in the final data extraction and analysis. In addition, TORS was compared with chemotherapy and RT, the current conventional treatments, to more effectively address the review question. Consequently, factors such as the length of hospital stay and recovery time were excluded given the inherent differences between surgical and medical interventions making it inappropriate to compare such parameters in this context.
Results
Paper Inclusion
Following full‐text screenings, 17 papers met the inclusion criteria. Two papers presented findings derived from an identical cohort of patients,13, 25 thus only the primary analysis was included.13 As a result, 16 studies are included in the final analysis (Figure 1). While Hutcheson et al (2019)26 and Barbon et al (2021)27 studied the same group of patients, they were both included as they presented a distinct set of patient‐reported outcomes.
Preferred Reporting Items for Systematic reviews and Meta‐analyses (PRISMA) flow diagram of study selection. In total, 10,204 records were identified, 100 assessed for eligibility, and 17 studies included. Exclusions due to no control group, wrong design/outcome, publication type, abstract‐only, or language.
Risk‐of‐Bias Assessment
Cochrane's RoB‐2 tool19 was used to assess the only randomized‐control study included13 revealing some concerns for bias.
The ROBINS‐I tool was applied to non‐randomized studies included in the analysis.20 Among the identified studies, three were classified as having a low risk of bias,27, 28, 29 eight as moderate,13, 26, 30, 31, 32, 33, 34, 35 five as serious,36, 37, 38, 39, 40 and none as critical. This is illustrated by the Robvis risk‐of‐bias plots,41 with detailed breakdowns in Supplemental Figures S1 and S3, available online, for the ROBINS‐I and RoB‐2 tools, respectively, in Supplemental Section S2, available online.
Table 1 summarizes key outcomes, including MDADI scores and gastrostomy tube dependence rates over time, along with relative and absolute effects and GRADE certainty ratings. Full details on study characteristics, statistical methods, and GRADE assessments are provided in Supplemental Section S3, available online.
Demographics
Demographic data from each study are presented in Table 2. The included studies comprised 2185 patients. A total of 1054 patients underwent TORS as part of the treatment, whereas 1131 patients received primary CRT, regardless of the HPV status. None of the included studies found a significant difference in the male sex distribution (P = .43) or mean age (P = .90) between the TORS and CRT cohorts.
Cancer Stage
Statistical testing using t test revealed no significant differences in the distribution of tumor stage (P = .85) and nodal stage (P = .89) between the TORS and CRT groups. Six studies matched the TORS and CRT cohorts by T stage,13, 29, 30, 32, 35, 38 while four were matched by N stage.13, 30, 38, 39 Three studies identified a significant difference in tumor staging between the TORS and CRT groups,33, 34, 39 and five studies observed a significant difference in node staging between the two groups.27, 28, 29, 33, 34 Amin et al (2023) studied the differences in functional outcomes between patients receiving surgery and those receiving CRT for the treatment of T1‐T2 OPSCC. However, the study did not specify the population by tumor or nodal grading.31 In all instances, the TORS group had a lower tumor and nodal staging. Table 3 presents patient demographics, cancer stages, and outcomes by treatment type, specifically TORS and CRT. Table 4 compares the usage of adjuvant treatments in TORS and control groups, detailing indications, treatment types, and patient distribution.
Based on the reported statistics, patients with positive HPV‐associated status are more likely to be observed than those with negative status, despite a high number of unknown or undetermined HPV‐associated statuses in four studies.28, 29, 35, 38 Two studies performed stage‐matching with respect to HPV‐associated status.13, 30 Two studies included patients based on HPV status without specifying specific strains.27, 34 Four studies did not report any data on HPV‐associated status.31, 32, 36, 39 No study performed a stratified analysis based on HPV‐associated status in relation to functional outcomes. Table 5 summarizes the status of HPV and its associated strains among patients in the included studies. It provides an overview of HPV prevalence and strain distribution across the patient cohort.
Swallowing Functions
For patient‐reported swallowing assessments, five studies used the MDADI scoring tool.13, 27, 32, 34, 36 Scott et al (2021) reported no significant changes in overall MDADI scores with both TORS and RT treatment group at 12 months, despite some significant changes in individual question scores in post hoc analysis.36 However, Nichols et al (2019) found that TORS was worse than the RT group (80.1 vs 86.9, P = .042) over the same period.13 More et al (2013) identified statistically significant improvements in MDADI scores in the TORS group at 6‐ and 12‐month post‐procedure, compared to CRT but no significant difference at 3‐month.32 Barbon et al (2021) overall found no statistically significant differences in MDADI scores between TORS and the RT group at 3 or 6 months.27 Pooled analysis showed no significant difference in MDADI swallowing scores between TORS and CRT at baseline (95% CI = –0.29 to 2.47) and at 3 to 6 months (95% CI = −18.33 to 5.96) (Figure 2). The wide CI suggests substantial variability between studies, without favoring either arm of treatment. However, the pooled estimate at 12 months was below zero (95% CI –17.74 to –2.41), indicating a statistically significant difference in favor of CRT (Figure 2).
Forest plots of MD Anderson Dysphagia Inventory (MDADI) swallowing scores comparing transoral robotic surgery (TORS) and (chemo)radiotherapy (CRT) at baseline, 3 to 6 months, and 12 months. Squares show study estimates/weights; diamonds pooled random‐effects results (95% CI).
Various swallowing assessments were used, as outlined in Table 6, with detailed findings in Supplemental Section S4, available online. Dynamic Imaging Grade of Swallowing Toxicity (DIGEST) was performed in four studies.27, 34, 36, 40 DIGEST scores were assessed at multiple time points, but none of the studies described a significant difference in score between the TORS and CRT groups.27, 34, 36, 40
A study described swallowing function using the Modified Barium Swallow Impairment Profile (MBSImP), they found significantly more pharyngeal contraction impairment for TORS but reduced laryngeal vestibular closure impairment compared with their control group who had been treated with RT.27 Of the two studies that used the Functional Oral Intake Scale (FOIS), one reported less deterioration in TORS patients compared to those receiving CRT after 1 year,33 while the other found no significant difference between the groups.39
Quality of life measures is summarized in Table 7. A study employed the University of Washington Quality of Life questionnaire (UW‐QOL) to assess patient outcomes.28 The study revealed that patients undergoing TORS consistently and significantly scored higher in the saliva domain of quality‐of‐life assessments at 1‐, 6‐, 12‐, and 24‐month posttreatment compared to those receiving CRT (P < .001, P = .025, P = .017, and P = .011).28
Scott et al (2023) used European Organisation for Research and Treatment of Cancer Core Quality of Life questionnaire (EORTC QLQ‐C30) and Head & Neck 35 (H&N 35); however, no statistically meaningful difference was elicited.40 The EORTC QLQ‐C30 was further used in Scott et al (2021), which exhibited favorable outcomes for global quality of life for TORS (P = .004) and RT (P = .032).36 There were more favorable outcomes for emotion in TORS (P > .001) than RT (P = .009); and for appetite for TORS (P = .032) than RT (P = .674).36 Kaffenberger et al (2021) in their study utilized the Eating Assessment Tool‐10 (EAT‐10) and reported no statistically significant differences over a median follow‐up duration of 29.7 months between the TORS and control groups (P = .18), for which the control group received CRT or RT.37
Gastrostomy Tubes and Tracheostomies
Eight studies described gastrostomy tube insertion13, 29, 30, 31, 32, 33, 35, 39 at various timepoints. Usage rates and comparative data are summarized in Table 8. One study reported significantly lower gastrostomy tube rates in the TORS group at 3 months, three out of four studies at 6 months, and two out of five at 12 months.
The meta‐analysis showed high heterogeneity at 3 and 6 months, which substantially decreased by 12 months (Figure 3). At 3 months, I² was 87.7%, indicating most variation was due to true differences between studies. At 6 months, I² was 72.0% with a high τ² and a significant P‐value (<.05), confirming substantial heterogeneity. By 12 months, heterogeneity was low. The random‐effects model demonstrated no significant differences in gastrostomy tube dependence between groups at 3 and 6 months; however, a statistically significant reduction was observed in the TORS group at 12 months.
Forest plots of gastrostomy tube dependence at 3, 6, and 12 months, comparing transoral robotic surgery (TORS) versus controls. Includes study estimates, pooled random‐effects results, and heterogeneity statistics. OR, odds ratio.
One of the studies included reported the requirement for tracheostomy as one of the outcomes measured following either TORS therapy or CRT treatments. Amin et al (2023),31 examining tracheostomy requirements at 1 week, 6 weeks, and 6 months posttreatment, found no significant differences between the TORS group and the control cohort who underwent RT. This was most likely due to differences in local guidelines and was performed prophylactically to reduce the risk of hemorrhage and edema. A pooled analysis showed significantly lower gastrostomy tube usage at 6 and 12 months based on a common effects model, but not 3 months.
With regards to the length of usage, Hughes et al (2023) did not mention how long the tube was inserted, but instead stated no significant difference between gastrostomy tube prevalence and dependence between TORS alone, TORS with RT, and TORS with CRT treatment regimens. Those studies by Chen et al (2015), Sharma et al (2016), and Nichols et al (2019) did not specify the duration of tube usage in all cases.
Pain Level
Three of the included studies reported on pain outcomes following TORS and control treatments, using a variety of pain scales.13, 28, 36 The specific metrics, time points, pain scores, and comparative statistics are described in Table 9. In a study conducted by Nichols et al,13 the TORS group was observed to have significantly lower pain levels than the RT group in the early postoperative period through both the EORTC QLQ‐C30 and EORTC QLQ‐H&N35 scale (P = .001). Ling et al28 was the only study reporting higher pain levels in the TORS group early postoperatively (at 1 month and 6 months) and lower levels later on (at 12 and 24 months) compared to CRT treatment, without disclosing significance levels. Scott et al36 found the TORS group to experience lower pain levels than their counterparts in both the initial and later stages postoperation compared to RT (with or without chemotherapy) albeit without significance levels, as measured by the EORTC H&N 35 scale.
Discussion
This systematic review aimed to assess the functional outcomes of TORS in comparison with the standard treatments of CRT for oropharyngeal cancers. The primary focus of the analysis was on OPSCC, which was the predominant cancer subtype among the studies reviewed. We included 16 studies in the analysis, and none of them contains a critical risk of bias.
Baseline Characteristics and Cohort Matching
There were no significant differences in sex, age, tumor grade, or nodal grade between the TORS and CRT groups. Six studies matched the TORS and CRT cohorts by T stage,13, 29, 30, 32, 35, 38 while four studies matched them by N stage,13, 30, 38, 39 which adds some validity to their conclusion. Although different staging systems were used across studies, those focused on oropharyngeal cancer should show minimal variance between the American Joint Committee on Cancer (AJCC) 7th and 8th editions. However, p16 status remains a crucial factor due to its impact on nodal stage classification.
Three studies showed significant differences in tumor staging and five in nodal staging between TORS and CRT groups. Those discrepancies are expected, as the British Association of Head & Neck Oncologists (BAHNO) guidelines recommend transoral surgery for early‐stage T1/T2 N0‐1 cases only.42 Advanced tumors (T3/T4) and N2 diseases are generally managed by CRT due to the difficulty of achieving surgical margins. Moreover, N2 disease or extranodal extension often requires postoperative CRT, negating the benefits of TORS by resulting in triple modality treatment and increased morbidity.
Variability in TORS Inclusion Criteria and the Role of Nodal Staging
The criteria for including and excluding patients from TORS varied considerably across studies, complicating comparisons and highlighting the lack of consensus on the appropriate nodal stage threshold for its use.
Ling et al (2016) offered TORS to patients with histology‐confirmed OPSCC and T0‐T2, N0‐N2 disease, considering adjuvant RT only for those with greater than or equal to N2 disease, angiolymphatic or perineural invasion, and <3 mm margins. Dhanireddy et al (2019) included patients up to N2b, recommending RT for N2a/N2b, perineural or lymphovascular invasion, and margins <2 mm.28 Nichols et al (2019) included patients with tumors up to T2 and N2 stages, restricting nodal inclusion to lymph nodes ≤4 cm without radiographic evidence of extranodal extension.13, 36 In contrast, Kaffenberger et al (2021) excluded patients early‐stage tumors (T1 and T2) treated with surgery alone and did not specify nodal stage selection.37
More recently, Hughes et al (2023) restricted inclusion to stage I‐II HPV‐associated OPSCC, excluding T3‐4 or N3 disease.33 Barbon et al (2022) excluded stage II (N2) disease when bilateral adenopathy (N2c) was present.34 Conversely, Meccariello et al (2020) included more advanced nodal disease (N2b, N2c, and N3).38 Genden et al (2011) reported that 38% of patients who would have otherwise required CRT for cT3‐4 or clinically node‐positive disease were able to avoid chemotherapy following TORS procedure, thereby reducing exposure to the adverse effects associated with chemotherapy agents.39 In contrast, Sharma et al (2016) conducted a retrospective cohort study without explicitly stating inclusion criteria based on tumor and nodal stages.35
In addition, More et al (2012) included patients with stage III or IVA oropharyngeal and supraglottic squamous cell carcinoma who had not received prior definitive treatment. Notably, 40% of patients (n = 8) with surgical margins <10 mm and no extracapsular spread avoided chemotherapy, thereby sparing them the associated toxicities.32 However, the inclusion of supraglottic tumors—generally considered suboptimal for TORS—illustrates further variability.
The broad variability underscores ongoing uncertainty about the optimal nodal stage cut‐off for TORS. While the United Kingdom Head and Neck Cancer National Multi‐disciplinary Guidelines advises RT with concurrent chemotherapy or consideration of tri‐modality treatment for most N2 cases,42 this is not a universally adopted standard. Instead, practices diverge internationally, influenced by resource availability, hospital protocols, and clinical judgment. Ultimately, the decision to proceed with TORS should consider not only nodal staging but also tumor characteristics, patient comorbidities, and preferences. The variability in study inclusion criteria reflects this complexity and highlights the need for more standardized, evidence‐based guidelines.
HPV/p16 Status and Its Reporting
There was a mixed patient demographic regarding p16/HPV status. Although 11 studies reported patient demographics, none presented stratified results, hindering further meta‐analysis. Additionally, no study performed a stratified analysis based on p16/HPV status in relation to functional outcomes.
HPV p16 immunochemistry is a simple yet highly informative prognostic biomarker. The 2024 BAHNO Guidelines highlighted its importance in staging and counseling, though not in amending the treatment protocol.42 Despite that, the AJCC 8th edition integrates p16 status into staging, adding an extra layer of patient stratification and evaluation of treatment outcomes.
The HPV‐driven OPSCC typically occurs in younger and healthier individuals with fewer comorbidities and lower exposure to high‐risk social factors. These tumors exhibit high radiosensitivity and are associated with significantly improved clinical outcomes. As a result, treatment protocols are increasingly being de‐escalated, creating opportunities to consider single‐modality surgical approaches, including minimally invasive techniques such as TORS.
Swallowing Function
Swallowing outcomes varied across studies. Some studies reported improvements in appetite30, 36 and increased saliva production28 following TORS, while others observed no significant differences between both groups across these metrics.27, 32, 34, 37, 40 The authors faced significant challenges in conducting a comprehensive comparative analysis of swallowing outcomes due to the wide variability in assessment tools employed across studies. Instruments used included the MDADI, UW‐QOL, EORTC QLQ‐C30, and EAT‐10.
Furthermore, the timing of outcome evaluations varied considerably, with follow‐up durations ranging from as early as 1 week to as long as 2 years, further complicating cross‐study comparisons. The meta‐analysis revealed no significant differences in MDADI swallowing scores between TORS and CRT at baseline or at 3 to 6 months posttreatment, suggesting that patients may have similar baseline function and early recovery trajectories in both treatment arms. The substantial heterogeneity observed across studies may be attributable to patient demographics and treatment protocols. Notably, the pooled estimate at 12 months demonstrated a statistically significant difference in favor of CRT at 12 months, indicating that CRT may offer a more favorable trajectory for swallowing function.
However, outcomes measured at 3, 6, and 12 months may not adequately reflect the long‐term impact of pharyngeal RT, which can progressively impair swallowing function over several years. The delayed side effects, including fibrosis, xerstomia, and pharyngeal strictures,43 indicate the importance of extended follow‐up on evaluating swallowing outcomes.
Gastrostomy Tube Use
Gastrostomy tube use also varied significantly in timing and reporting. The meta‐analysis revealed substantial heterogeneity at 3 and 6 months, which markedly decreased by 12 months, at which point TORS was associated with a statistically significant reduction in gastrostomy tube dependence.
Given that the TORS procedure typically lasts a few hours, while RT is administered over 6 to 7 weeks, the more relevant clinical endpoint is ongoing tube use at defined follow‐up intervals (eg, 3 or 6 months), rather than initial insertion. The delayed effect of RT on swallowing function44 further complicates the interpretation of tube dependence over time. The heterogeneity of institution protocol on gastrostomy tube placement and clinical judgment poses challenges for impactful cross‐study comparisons. The relative novelty of TORS contributes to the limited number of high‐quality comparative studies. As robotic technologies become more widely adopted and clinical experience grows, future analyses may yield more robust and generalizable conclusions.
Limitations and Future Directions
The scope of this meta‐analysis was limited in terms of the number of included studies, with only three reporting swallowing function (MDADI) and two reporting pain at the 12‐month endpoint. Also, evidence comparing the functional outcomes of TORS, transoral laser microsurgery, and other endoscopic resections is currently limited. Larger studies with more comprehensive patient data are needed to better define these differences.
The TORS group typically has lower‐stage disease due to selection bias, as patients with T1, T2, and select T3 tumors are primarily chosen for surgery. In contrast, advanced OPSCC (T3‐4 or N2+) is typically managed with RT or CRT, unless tri‐modality treatment is selected following patient counseling. Notably, only the study by Amin et al (2023) used stage‐matched CRT groups.31
As TORS continues to evolve, ongoing research is essential to better define its benefits over conventional treatments. Evaluating the impact of different techniques and instruments within TORS will be key to establishing standardized protocols that ensure optimal patient outcomes. Moreover, comparative studies evaluating the efficacy of TORS versus RT or CRT across different tumor stages are needed, especially given the current emphasis on early‐stage disease (T0‐T2, N0‐N2), which likely reflects TORS's limited suitability for more advanced cases.45
Conclusion
This review provides the most comprehensive analysis to date of functional outcomes in trials comparing TORS and CRT. TORS shows promise for selected tumors, but methodological inconsistencies, particularly in eligibility criteria and HPV p16 status, limit comparability. Standardized guidelines and further trials are needed to inform treatment choice.
Author Contributions
Simpson Shiu Chung Tam, design conception, methodology development, data curation and analysis, investigation, and manuscript development; Nihal Sogandji, methodology development, data curation and analysis, investigation, and manuscript development; Muzammil Arif Din Abdul Jabbar, design conception, methodology development, data curation and analysis, investigation, manuscript development, and research supervision; Shazia Huma Absar, data curation and analysis, investigation, and manuscript development; Mikesh Kalpesh Patel, data curation and analysis, investigation, and manuscript development; Jeffrey Tooze, data curation and analysis, investigation, and manuscript development; Eleanor Barker, methodology development, data curation and analysis, and manuscript development; Manaf Khatib, methodology development, manuscript development, and research supervision; Anant Patel, manuscript development and research supervision; George Mochloulis, manuscript development and research supervision; Amit Gupta, manuscript development and research supervision.
Disclosures
Competing interests
The authors have no competing interests to declare that are relevant to the content of this article.
Funding source
The open‐access publication is made available by the open‐access agreements under the Joint Information Systems Committee – University of Cambridge. The funder has no role in study design; data collection, analysis, and interpretation; the writing of the manuscript; and the decision to submit the manuscript for publication.
Supporting information
Supporting Information.
Supporting Information.
The reference list from the paper itself. Each links out to its DOI / PubMed record.
- 1Schache AG , Powell NG , Cuschieri KS , et al. HPV‐related oropharynx cancer in the United Kingdom: an evolution in the understanding of disease etiology. Cancer Res. 2016;76(22):6598‐6606. 10.1158/0008-5472.CAN-16-0633 27569214 PMC 9158514 · doi ↗ · pubmed ↗
- 2Chaturvedi AK , Engels EA , Pfeiffer RM , et al. Human papillomavirus and rising oropharyngeal cancer incidence in the United States. J Clin Oncol. 2011;29(32):4294‐4301. 10.1200/JCO.2011.36.4596 21969503 PMC 3221528 · doi ↗ · pubmed ↗
- 3Lechner M , Liu J , Masterson L , Fenton TR . HPV‐associated oropharyngeal cancer: epidemiology, molecular biology and clinical management. Nat Rev Clin Oncol. 2022;19(5):306‐327. 10.1038/s 41571-022-00603-7 35105976 PMC 8805140 · doi ↗ · pubmed ↗
- 4Oliveira CM , Nguyen HT , Ferraz AR , Watters K , Rosman B , Rahbar R . Robotic surgery in otolaryngology and head and neck surgery: a review. Minim Invasive Surg. 2012;2012:1‐11. 10.1155/2012/286563 PMC 333748822567225 · doi ↗ · pubmed ↗
- 5Lee YH , Kim YS , Chung MJ , et al. Soft tissue necrosis in head and neck cancer patients after transoral robotic surgery or wide excision with primary closure followed by radiation therapy. Medicine. 2016;95(9):e 2852. 10.1097/MD.0000000000002852 26945367 PMC 4782851 · doi ↗ · pubmed ↗
- 6Hay A , Migliacci J , Karassawa Zanoni D , et al. Complications following transoral robotic surgery (TORS): a detailed institutional review of complications. Oral Oncol. 2017;67:160‐166. 10.1016/j.oraloncology.2017.02.022 28351571 PMC 5407467 · doi ↗ · pubmed ↗
- 7Sethi RKV , Chen MM , Malloy KM . Complications of transoral robotic surgery. Otolaryngol Clin North Am. 2020;53(6):1109‐1115. 10.1016/j.otc.2020.07.017 32917420 · doi ↗ · pubmed ↗
- 8Richmon JD , Quon H , Gourin CG . The effect of transoral robotic surgery on short‐term outcomes and cost of care after oropharyngeal cancer surgery. Laryngoscope. 2014;124(1):165‐171. 10.1002/lary.24358 23945993 · doi ↗ · pubmed ↗