Prevalence of Digital Eye Strain During the COVID-19 Pandemic Among Adolescent Schoolchildren in Chengalpattu District
Kavya Palanisamy, Raja D, Rajeswari N, Sri Varsha, Rajan Edward Daniel Thomas

TL;DR
This study found that over half of adolescents in Chengalpattu had digital eye strain due to increased screen time during the pandemic.
Contribution
The study provides new prevalence data on digital eye strain among adolescents in Chengalpattu during the pandemic.
Findings
51.5% of adolescents experienced digital eye strain during the pandemic.
93% of children spent more than 5 hours daily on digital devices during lockdown.
Increased screen time is linked to higher risk of digital eye strain and myopia.
Abstract
Introduction Children were exposed to excessive screen time during the COVID-19 pandemic due to online classes, which led to increased use of digital devices for social connections and recreation. Children who continue to use digital devices for longer periods at younger ages are at higher risk of developing myopia and digital eye strain (DES), which remains a public health concern even after schools have reopened. Aims To determine the prevalence of DES and its associated factors among adolescent schoolchildren (11-17 years) in the Chengalpattu District. Settings and design A cross-sectional study was carried out in schools in Chengalpattu District. Materials and methods To assess the prevalence of DES and its contributing factors, a semi-structured questionnaire was used. The study included all students in schools selected using simple random sampling. Statistical analysis…
Genes, proteins, chemicals, diseases, species, mutations and cell lines named across the full text — each resolved to its canonical identifier and authoritative record.
Click any figure to enlarge with its caption.
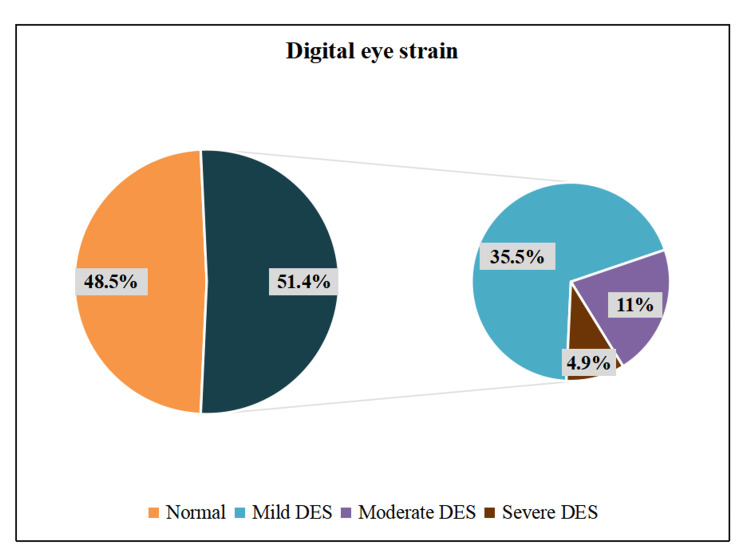 Figure 1
| Characteristics | N | % |
| Mean age ± SD | 12.77 ± 1.7 years | |
| Age group | ||
| 11-14 years | 456 | 83.5 |
| 15-17 years | 90 | 16.5 |
| Gender | ||
| Male | 292 | 53.5 |
| Female | 254 | 46.5 |
| Class | ||
| 6th-8th | 358 | 65.5 |
| 9th-10th | 120 | 22 |
| 11th-12th | 68 | 12.5 |
| Socioeconomic status (Modified BG Prasad classification) | ||
| Upper class | 445 | 81.5 |
| Upper middle class | 91 | 16.7 |
| Lower middle class | 9 | 1.6 |
| Upper lower class | 1 | 0.2 |
| Details of online classes | ||
| Children who attended online classes | 546 | 100 |
| Children currently attending online classes | 32 | 5.8 |
| Breaks between classes | ||
| Present | 518 | 94.9 |
| Absent | 28 | 5.1 |
| Number of breaks between classes | ||
| No breaks | 28 | 5.1 |
| 1-2 breaks | 386 | 70.7 |
| >2 breaks | 132 | 24.2 |
| Variables | N | % |
| Duration of digital device usage (mean ± SD) | ||
| Before lockdown | 1.37 ± 0.6 hours | |
| During lockdown | 6.78 ± 2.5 hours | |
| After lockdown | 3.01 ± 1.8 hours | |
| Distance of digital device from eyes during online classes | ||
| <1.5 feet | 245 | 44.9 |
| ≥1.5 feet | 301 | 55.1 |
| Screen time per day | ||
| Before lockdown (mean ± SD) | 4.5 ± 1.9 hours | |
| <5 hours | 303 | 55.5 |
| ≥5 hours | 243 | 44.5 |
| During lockdown (mean ± SD) | 8.9 ± 0.9 hours | |
| <5 hours | 38 | 7 |
| ≥5 hours | 508 | 93 |
| After lockdown (mean ± SD) | 4.8 ± 2.3 hours | |
| <5 hours | 271 | 49.6 |
| ≥5 hours | 275 | 50.4 |
| Digital devices used for online classes | ||
| Smartphone | 405 | 74.2 |
| Desktop | 16 | 2.9 |
| Laptop | 70 | 12.8 |
| Tablet/iPad | 55 | 10.2 |
| Symptoms of digital eye strain | Frequency of DES symptoms (%) | Intensity of DES symptoms (%) | |||
| Never | Occasional - moderate | Occasional - severe | Always - moderate | Always - severe | |
| Burning | 50 | 39.2 | 8.4 | 1.8 | 0.5 |
| Itching | 44 | 45.6 | 5.9 | 3.5 | 1.1 |
| Foreign body sensation | 67 | 23.3 | 5.5 | 3.8 | 0.4 |
| Watering/tearing | 47.3 | 39.2 | 11 | 1.3 | 1.3 |
| Excessive blinking | 71.8 | 21.1 | 5.9 | 0.9 | 0.4 |
| Redness | 52.7 | 38.3 | 6.8 | 1.8 | 0.4 |
| Eye pain | 51.5 | 38.1 | 6.4 | 1.8 | 2.2 |
| Heaviness in eyelids | 76 | 19.8 | 2.9 | 0.9 | 0.4 |
| Dryness | 80 | 14.5 | 2.7 | 0.7 | 2 |
| Blurring of vision | 74.9 | 17.9 | 3.5 | 2.4 | 1.3 |
| Double vision | 78.6 | 18.3 | 1.8 | 1.3 | 0 |
| Increased sensitivity to light | 58.4 | 28.6 | 9.2 | 2 | 1.8 |
| Headache | 40.3 | 42.3 | 8.1 | 7.7 | 1.6 |
| Worsening of eyesight | 83 | 11.2 | 3.8 | 1.8 | 0.2 |
| Variables | Normal n (%) | DES n (%) | Chi-square value | p-value |
| School classes | ||||
| 6th-8th | 182 (50.8) | 176 (49.2) | 32.715 | 0.018* |
| 9th-10th | 58 (48.3) | 62 (51.7) | ||
| 11th-12th | 25 (36.7) | 43 (63.3) | ||
| Children attending online classes now | ||||
| Yes | 5 (15.6) | 27 (84.4) | 23.863 | 0.0001* |
| No | 260 (50.5) | 254 (49.5) | ||
| Digital devices | ||||
| Smartphone | 180 (44.4) | 225 (55.6) | 18.338 | 0.031* |
| Desktop | 11 (68.8) | 5 (31.2) | ||
| Laptop | 43 (61.4) | 27 (38.6) | ||
| Tablet/iPad | 32 (58.2) | 23 (41.8) | ||
| Distance of digital device use | ||||
| < 1.5 feet | 101 (41.2) | 144 (58.8) | 21.309 | 0.002* |
| ≥ 1.5 feet | 164 (54.4) | 137 (45.6) | ||
| Screen time per day - before lockdown | ||||
| Watching TV < 2 hours | 134 (50.5) | 101 (35.9) | 11.896 | 0.001* |
| ≥ 2 hours | 131 (49.5) | 180 (64.1) | ||
| During lockdown | ||||
| Online class < 2 hours | 22 (8.3) | 22 (7.8) | 21.984 | 0.0001* |
| ≥ 2 hours | 243 (91.7) | 259 (92.2) | ||
| Video games (during lockdown) | ||||
| < 2 hours | 135 (50.9) | 110 (39.1) | 7.673 | 0.006* |
| ≥ 2 hours | 130 (49.1) | 171 (60.9) | ||
| After lockdown | ||||
| Online class < 2 hours | 264 (49.4) | 270 (50.6) | 13.550ᵃ | 0.0001* |
| ≥ 2 hours | 1 (7.1) | 13 (92.9) | ||
Peer Reviews
No public reviews on file for this paper yet. If you reviewed it on a platform where reviews are public (OpenReview, ICLR, NeurIPS, ICML), you can paste yours below so the community can read it here.
Videos
No videos yet. Explain this paper in a talk, walkthrough, or lecture? Add one.
Taxonomy
TopicsErgonomics and Musculoskeletal Disorders · Ophthalmology and Visual Impairment Studies · Child Development and Digital Technology
Introduction
Extended school closures brought on by COVID-19 forced educational institutions to implement virtual learning for students, which increased the time children spent using screens for social and recreational purposes [1,2]. Excessive screen time has been implicated in many negative health outcomes [3,4]. The blue light emitted by digital devices can lead to digital eye strain (DES) [5,6]. It is evident that DES among children is a crucial yet neglected public health concern. Therefore, the purpose of this study was to ascertain the prevalence of DES and its associated factors among schoolchildren in Chengalpattu.
Materials and methods
Study setting and participants
A cross-sectional study was carried out in the schools of Chengalpattu District from July to October 2023. All adolescents aged 11-17 years who provided their assent and whose parents provided consent comprised the study population. Children with infectious eye diseases, inflammatory eye diseases, or anatomical ocular malformations were excluded.
Sampling technique
As per Mohan A et al. [7], using a prevalence of DES among adolescent schoolchildren of 50%, with an absolute precision of 5% and a 95% CI, the required sample size was 384. Accounting for a 10% non-response rate, the minimum sample size was 422. From the list of higher secondary schools (6th to 12th standard), two schools were selected by simple random sampling. After obtaining administrative approval from the selected schools, all eligible students present at the time of the study who fulfilled the inclusion criteria were included. The outcome of this study was to determine the prevalence of DES during the COVID-19 era and the risk factors linked to it among adolescent schoolchildren in Chengalpattu District.
Data collection methods and tools
Before commencing the study, Institutional Human Ethics Committee approval was obtained (Ref. no: IHEC-I/1115/22). Informed consent was collected from parents, and assent was obtained from participants after they were informed about the research in the local language. Basic information and sociodemographic details were gathered using a pretested semi-structured questionnaire. The Computer Vision Syndrome Questionnaire (CVS-Q), a validated tool, was used to evaluate DES.
Data entry and statistical analyses
Data were gathered using a semi-structured questionnaire and entered into a Microsoft Excel spreadsheet, then analyzed using IBM SPSS v21. Mean and SD were used to describe quantitative variables, while frequency and percentage described qualitative variables. Statistical significance was assessed using the chi-square test and Fisher’s exact test. A p-value < 0.05 was considered statistically significant.
Operational definitions
Adolescents
Adolescence is the phase of life between childhood and adulthood, from ages 10 to 19 [8]. They are categorized into:
Younger adolescents: The lives of younger adolescents, defined here to encompass girls and boys from 10 to 14 years of age, are characterized by profound biological, cognitive, emotional, and social changes associated with the passage through puberty [9].
Older adolescents: They encompass girls and boys from 15 to 19 years of age [10].
Computer Vision Syndrome Questionnaire
The CVS-Q is a validated tool developed by Seguí M et al. [11] to estimate ocular symptoms related to digital device exposure. The total score is obtained using the formula:
\begin{document}"Score\sum_{i=1}^{16}\text{}(frequency\text{ of symptom occurrence})i\times \text{(intensity of symptom)}i"\end{document}
The results for each symptom were recorded using frequency × intensity as 0 = 0, 1-2 = 1, and 4 = 2. The sum of the symptom scores provides the DES score; a score ≥ 6 indicates that the child has DES. DES severity was classified as mild (DES score: 6-12), moderate (13-18), and severe (19-32) [11].
Results
During the lockdown, all research participants took online classes for academic credit. In addition, approximately 5.8% of participants were enrolled in other online courses, with 4.9% taking them for academic purposes (e.g., math and English lessons) and 0.9% for non-academic purposes (e.g., yoga and music classes) (Table 1).
During lockdown, about 93% (N = 508) of children spent more than five hours in front of a screen. Screen time of ≥5 hours per day was highest during the lockdown (93%) and was still reported by half of the participants after the lockdown (50.4%). Most participants used smartphones (74.2%) for online classes (Table 2).
Playing video games (55.1%), watching television (67.4%), and other activities on smartphones (58.6%) increased during lockdown compared with before and after lockdown. Outdoor playtime was drastically reduced to less than 1 hour among 95.1% of children during lockdown. Recreational activities such as drawing and writing (86.3%) increased during and after lockdown. Reading time of more than 4 hours (88.6%) among children also increased during lockdown. The most common symptoms were headache (59.7%, N = 326) and itching (56.1%, N = 306). Worsening of eyesight (16.8%, N = 93) was the least common presenting symptom. Symptoms most often reported as “always” with severe intensity were eye pain (2.2%) and dryness (2.0%) (Table 3).
Figure 1 shows that more than half of the participants had DES (51.5%), of whom 35.5% had mild DES, 11% had moderate DES, and 4.9% had severe DES. Older adolescents (59%) and females (56.6%) had more DES.
Frequency distribution of DES severity among adolescent schoolchildren (N = 546).DES: Digital eye strain.
Factors significantly associated with DES included: students of parents who had school education; a positive family history of wearing glasses (p = 0.001); being in 11th and 12th standards (p = 0.018); currently attending online classes (p = 0.001); having no breaks between online classes (p = 0.041); difficulty reading books (p = 0.001) and reading the board (p = 0.001); smartphone use (p = 0.031); and using a device at <1.5 feet distance (51.2%, p = 0.002). About 55.6% (N = 205) of participants who used smartphones had DES. Participants who used screens for five or more hours a day were significantly more likely to develop DES both before and during lockdown (p = 0.010 and p = 0.030, respectively).
More than half of the participants who watched television for ≥2 hours before lockdown had DES (N = 180, 64.1%). During lockdown, the highest numbers with DES were among those who played video games for ≥2 hours (N = 171, 60.9%) and those who had online classes for ≥2 hours (N = 259, 92.2%). After the lockdown, attending online classes for ≥2 hours was associated with DES (N = 13, 92.9%). Analyzing screen-time types showed significant associations with DES for watching television before lockdown (p = 0.001); online classes (p = 0.0001) and video games (p = 0.006) during lockdown; and attending online classes after lockdown (p = 0.0001) (Table 4).
*Table 4: Factors associated with digital eye strain among study participants (N = 546).p < 0.05 considered statistically significant; a Fisher’s exact test applied.DES: Digital eye strain.
Discussion
About 59% of participants in this study had a positive family history of wearing spectacles, higher than the 27% reported by Vishnuprasad R et al. [12]. The difference may be because that study included only parents and siblings, whereas ours also included grandparents along with parents and siblings. According to Mohan A et al. [7], the mean age at which children started wearing glasses was 9.39 ± 3.3 years, which was similar to our study, where the mean age at which children started wearing glasses was 10.28 ± 1.45 years [7]. Our study found that 100% of participants had taken online classes during lockdown, which accords with Mohan A et al., who reported 96.3% [7]. In this study, after lockdown, 5.8% of participants were still attending online classes, of which 4.9% were for academic and 0.9% for non-academic reasons. To our knowledge, no other studies report the proportion of children currently attending online classes; the present study assessed this determinant.
In line with Moitra P et al. (64.9%) and Moon JH et al. (61.3%), 74.2% of participants in this study reported using a smartphone [13,14]. The average duration of digital device use in our study was 1.37 ± 0.6 hours before the lockdown and 6.78 ± 2.5 hours during the lockdown, which is broadly consistent with Mohan A et al., who reported 1.9 ± 1.1 hours before and 3.9 ± 1.9 hours during lockdown [7]. Mohan A et al. and Ichhpujani P et al. found that 31.6% and 44% of participants, respectively, used devices at a distance of less than 18 inches (1.5 feet) from the eyes; in our study, 44.9% reported a distance of < 1.5 feet [7,15]. Screen time of >5 hours per day before lockdown and during lockdown was 1.8% and 36.9%, respectively, in previous studies, which is higher in our study at 44.5% (before) and 93% (during). This difference may be because previous studies assessed screen time based on a single device, whereas our study accounted for multiple device use.
Among the digital devices used for online classes in this study, 74.2% of the children used smartphones. This was higher than in the Moitra P et al. study, where 68.5% of children used smartphones, and the Mohan A et al. study, where 61.7% used smartphones [7,14]. The difference may be because the previous studies included multiple device use during online classes, whereas this study captured single (primary) device use.
In this study, 51.5% of participants had DES, which is consistent with the findings of Mohan A et al. (50.2%) and Courtin R et al. (54%), while other studies reported 17.9% and 19.7% [7,16]. The higher prevalence might be due to prolonged digital device use during the COVID-19 pandemic with the introduction of virtual learning. The most prevalent DES symptoms reported by more than half of participants were headache and itching, in line with Shantakumari N et al. (53.3%), Babu JV et al. (53%), and Mohan A et al. (53.9%) [7,17,18]. Older adolescents in our study had more DES than younger adolescents, similar to the findings of Moon JH et al. and Mohan A et al. [7,13]. An upsurge in visual demand due to increased near work in older adolescents may explain this. Consistent with Babu JV et al. and Shima M et al., girls experienced more DES symptoms than boys [17,19].
A strength of this study is that it assessed DES among children and compared various factors before, during, and after lockdown. Children identified with DES were referred to a nearby higher eye center for further ophthalmic examination. Limitations include potential recall bias due to self-reporting; to mitigate this, data collection and ocular examinations were conducted within one year of school reopening after lockdown. Additionally, the lack of further regression analysis limits our ability to rule out confounding factors.
Conclusions
More than half of the participants had DES, associated with online classes, increased use of digital devices, and close viewing distances during the pandemic. These findings underscore the need to reduce visual demands among children through eye-health education and to promote periodic eye check-ups, which aid early diagnosis and treatment, given the limited eye-health knowledge among children, parents, and teachers. Further research on strategies to reduce DES should be encouraged.
The reference list from the paper itself. Each links out to its DOI / PubMed record.
- 1Youth screen media habits and sleep: sleep-friendly screen behavior recommendations for clinicians, educators, and parents Child Adolesc Psychiatr Clin N Am Hale L Kirschen GW Le Bourgeois MK 2292452720182950274910.1016/j.chc.2017.11.014PMC 5839336 · doi ↗ · pubmed ↗
- 2Effects of screentime on the health and well-being of children and adolescents: a systematic review of reviews BMJ Open Stiglic N Viner RM 09201910.1136/bmjopen-2018-023191 PMC 632634630606703 · doi ↗ · pubmed ↗
- 3Media and technology use predicts ill-being among children, preteens and teenagers independent of the negative health impacts of exercise and eating habits Comput Human Behav Rosen LD Lim AF Felt J 3643753520142571721610.1016/j.chb.2014.01.036PMC 4338000 · doi ↗ · pubmed ↗
- 4Sedentary behaviors in today’s youth: approaches to the prevention and management of childhood obesity: a scientific statement from the American Heart Association Circulation Barnett TA Kelly AS Young DR 0138201810.1161/CIR.000000000000059130354382 · doi ↗ · pubmed ↗
- 5Television viewing and unhealthy diet: implications for children and media interventions Health Commun Harris JL Bargh JA 6606732420092018337310.1080/10410230903242267 PMC 2829711 · doi ↗ · pubmed ↗
- 6Digital eye strain in the era of COVID-19 pandemic: an emerging public health threat Indian J Ophthalmol Bhattacharya S Saleem SM Singh A 170917106820203270983310.4103/ijo.IJO_1782_20PMC 7640814 · doi ↗ · pubmed ↗
- 7Prevalence and risk factor assessment of digital eye strain among children using online e-learning during the COVID-19 pandemic: digital eye strain among kids (DESK study-1)Indian J Ophthalmol Mohan A Sen P Shah C Jain E Jain S 1401446920213332359910.4103/ijo.IJO_2535_20PMC 7926141 · doi ↗ · pubmed ↗
- 8Adolescent health 4 2024 2024 https://www.who.int/health-topics/adolescent-health