Association of Systemic Inflammation Indices With Mortality in Coronary Atherosclerosis Patients With and Without Standard Modifiable Risk Factors
Weiren Yan, Bingqian Zhang, Xiaoyan Zhang, Xinsheng Li, Yao Yu, Yuguo Liu, Lei Guo, Haichen Lv

TL;DR
This study finds that inflammation markers SII and SIRI are linked to higher mortality in coronary heart disease patients, even when traditional risk factors are absent.
Contribution
The study introduces novel inflammatory markers SII and SIRI as predictors of mortality in coronary heart disease patients with and without standard risk factors.
Findings
SII and SIRI are strongly associated with increased all-cause and cardiovascular mortality in patients with ≥1 standard modifiable risk factors.
In patients without standard risk factors, SII and SIRI are still linked to higher all-cause mortality, though cardiovascular mortality is less consistent.
The relationship between SII/SIRI and mortality is linear in patients with ≥1 standard risk factors but not consistently so in those without.
Abstract
Standard modifiable risk factors (SMuRFs) are important causative factors leading to coronary atherosclerosis. However, a significant number of individuals develop coronary atherosclerosis despite the absence of SMuRFs. Inflammation is another major cause of atherosclerosis, and this study aims to investigate the association of the novel inflammatory markers systemic immune inflammatory index (SII) and systemic inflammatory response index (SIRI) with mortality in patients with coronary heart disease (CHD) with and without SMuRFs. In this study, we included 1708 CHD participants from the 1999–2018 National Health and Nutrition Examination Survey (NHANES). Patients were categorized into ≥ 1SMuRF and SMuRF‐less groups by questionnaire and serologic testing. SII and SIRI were categorized into four groups according to quartiles. Multivariate weighted Cox regression was used to explore the…
Genes, proteins, chemicals, diseases, species, mutations and cell lines named across the full text — each resolved to its canonical identifier and authoritative record.
Click any figure to enlarge with its caption.
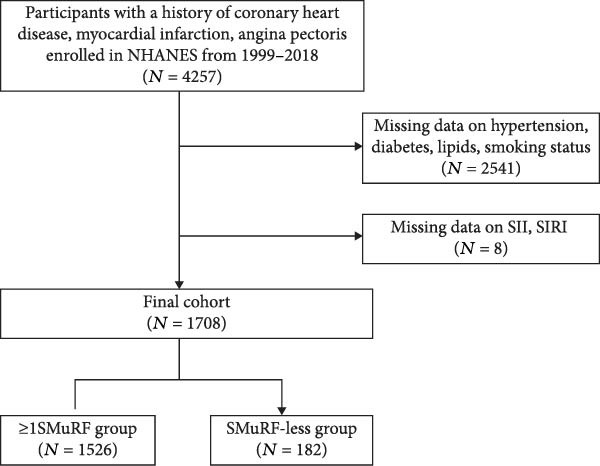 Figure 1
| Variable | ≥ 1SMuRF |
| SMuRF‐less |
| ||||||
|---|---|---|---|---|---|---|---|---|---|---|
| Q1 ( | Q2 ( | Q3 ( | Q4 ( | Q1 ( | Q2 ( | Q3 ( | Q4 ( | |||
| SII | 515.40 ± 98.96 | 742.29 ± 60.67 | 970.99 ± 85.93 | 1644.88 ± 737.18 | < 0.001 | 486.93 ± 90.10 | 692.72 ± 52.48 | 884.76 ± 65.48 | 1441.92 ± 474.21 | < 0.001 |
| Age (years) | 65.02 ± 12.30 | 64.49 ± 11.68 | 64.86 ± 12.21 | 66.12 ± 13.36 | 0.661 | 65.58 ± 10.65 | 63.17 ± 15.77 | 63.41± 14.88 | 64.26 ± 14.40 | 0.884 |
| Gender ( | 0.005 | 0.092 | ||||||||
| Male | 247 (67.4) | 242 (62.8) | 217 (58.1) | 207 (50.4) | 38 (77.7) | 36 (84.5) | 31 (56.7) | 31 (69.8) | ||
| Female | 135 (32.6) | 139 (37.2) | 164 (41.9) | 175 (49.6) | 8 (22.3) | 9 (15.5) | 14 (43.3) | 15 (30.2) | ||
| Race ( | 0.033 | 0.2 | ||||||||
| Mexican American | 39 (4.6) | 41 (3.0) | 57 (4.9) | 34 (3.4) | 4 (2.1) | 4 (6.0) | 5 (4.5) | 6 (6.5) | ||
| Non‐Hispanic Black | 92 (13.2) | 74 (9.8) | 60 (8.5) | 40 (5.3) | 3 (2.8) | 2 (2.0) | 0 (0.0) | 3 (5.4) | ||
| Non‐Hispanic White | 190 (71.0) | 220 (77.8) | 207 (75.1) | 268 (84.0) | 28 (78.9) | 33 (84.2) | 35 (88.9) | 31 (79.1) | ||
| Other Hispanic | 27 (4.7) | 23 (3.0) | 31 (4.1) | 24 (2.8) | 3 (1.9) | 4 (4.4) | 4 (4.8) | 3 (4.9) | ||
| Other race | 24 (6.5) | 23 (6.2) | 26 (7.5) | 16 (4.5) | 8 (14.3) | 2 (3.5) | 1 (1.8) | 3 (4.1) | ||
| Education ( | 0.372 | 0.746 | ||||||||
| Below high school | 138 (27.6) | 129 (24.2) | 156 (30.9) | 142 (29.5) | 14 (18.8) | 11 (14.5) | 12 (11.4) | 12 (17.2) | ||
| High school or above | 224 (72.4) | 252(75.8) | 225 (69.1) | 240 (70.5) | 32 (81.2) | 34 (85.5) | 33 (88.6) | 34 (82.8) | ||
| Married ( | 0.026 | 0.748 | ||||||||
| No | 143 (29.4) | 155 (37.2) | 169 (37.8) | 185 (43.1) | 15 (29.1) | 10 (18.0) | 12 (23.9) | 14 (22.8) | ||
| Yes | 239 (70.6) | 226 (62.8) | 212 (62.2) | 197 (56.9) | 31 (70.9) | 35 (82.0) | 33 (76.1) | 32 (77.2) | ||
| Diabetes ( | 0.618 | |||||||||
| No | 245 (68.4) | 234 (65.3) | 248 (67.4) | 251 (71.5) | 46 (100.0) | 45 (100.0) | 45 (100.0) | 46 (100.0) | ||
| Yes | 137 (31.6) | 147 (34.7) | 133 (32.6) | 131 (28.5) | ||||||
| Hypertension ( | 0.124 | |||||||||
| No | 337 (87.4) | 324 (80.1) | 316 (82.0) | 332 (86.8) | 46 (100.0) | 45 (100.0) | 45 (100.0) | 46 (100.0) | ||
| Yes | 45 (12.6) | 57 (19.9) | 65 (18.0) | 50 (13.2) | ||||||
| Smoking ( | 0.44 | |||||||||
| No | 308 (75.6) | 298 (77.4) | 290 (74.2) | 282 (70.4) | 46 (100.0) | 45 (100.0) | 45 (100.0) | 46 (100.0) | ||
| Yes | 74 (24.4) | 83 (22.6) | 91 (25.8) | 100 (29.6) | ||||||
| Drinking ( | 0.011 | 0.083 | ||||||||
| No | 154 (36.8) | 152 (31.2) | 184 (45.1) | 145 (36.3) | 16 (20.8) | 12 (21.4) | 21 (46.9) | 17 (31.6) | ||
| Yes | 228 (63.2) | 229(68.8) | 197 (54.9) | 237 (63.7) | 30 (79.2) | 33 (78.6) | 24 (53.1) | 29 (68.4) | ||
| CKD ( | 0.499 | 0.562 | ||||||||
| No | 279 (76.9) | 274 (71.4) | 269 (75.3) | 284 (72.2) | 39 (82.8) | 38 (79.3) | 35 (73.3) | 33 (66.0) | ||
| Yes | 103 (23.1) | 107 (28.6) | 112 (24.7) | 98 (27.8) | 7 (17.2) | 7 (20.7) | 10 (26.7) | 13 (34.0) | ||
| Hyperlipidemia ( | 0.259 | |||||||||
| No | 246 (67.7) | 225 (60.6) | 234 (59.4) | 235 (58.9) | 46 (100.0) | 45 (100.0) | 45 (100.0) | 46 (100.0) | ||
| Yes | 136 (32.3) | 156 (39.4) | 147 (40.6) | 247 (41.1) | ||||||
| PIR | 2.70 ± 1.60 | 2.53 ± 1.59 | 2.64 ± 1.58 | 2.48 ± 1.54 | 0.461 | 3.46 ± 1.57 | 3.31 ± 1.53 | 3.30 ± 1.51 | 2.89 ± 1.61 | 0.532 |
| BMI (kg/m2) | 29.93 ± 5.95 | 30.57 ± 6.10 | 30.15 ± 7.11 | 29.83 ± 7.62 | 0.625 | 26.59 ± 4.01 | 26.71 ± 3.28 | 28.01 ± 6.76 | 29.95 ± 6.30 | 0.102 |
| LDL‐C (mmol/L) | 2.57 ± 0.88 | 2.72 ± 1.04 | 2.72 ± 1.10 | 2.67 ± 1.03 | 0.243 | 2.27 ± 0.63 | 2.20 ± 0.59 | 2.23 ± 0.51 | 2.40 ± 0.57 | 0.565 |
| HDL‐C (mmol/L) | 1.30 ± 0.42 | 1.29 ± 0.42 | 1.29 ± 0.39 | 1.34 ± 0.48 | 0.608 | 1.40 ± 0.42 | 1.29 ± 0.29 | 1.38 ± 0.48 | 1.25 ± 0.32 | 0.482 |
| TC (mmol/L) | 4.57 ± 1.04 | 4.79 ± 1.20 | 4.74 ± 1.30 | 4.76 ± 1.17 | 0.088 | 4.23 ± 0.81 | 4.05 ± 0.69 | 4.25 ± 0.58 | 4.25 ± 0.66 | 0.531 |
| TG (mmol/L) | 1.52 ± 0.79 | 1.71 ± 0.90 | 1.59 ± 0.83 | 1.65 ± 0.83 | 0.251 | 1.22 ± 0.60 | 1.21 ± 0.63 | 1.39 ± 0.56 | 1.31 ± 0.67 | 0.606 |
| ALT (U/L) | 26.85±22.78 | 24.96±13.27 | 23.50 ± 15.49 | 22.86 ± 13.65 | 0.131 | 27.00 ± 11.85 | 25.82 ± 12.38 | 20.98 ± 6.51 | 21.31 ± 9.19 | 0.022 |
| AST (U/L) | 27.87 ± 21.58 | 25.41 ± 10.84 | 24.37 ± 9.85 | 24.45 ± 9.45 | 0.091 | 27.58 ± 8.15 | 26.16 ± 7.35 | 23.25 ± 4.71 | 23.31 ± 6.27 | 0.048 |
| eGFR (mL/min/1.73m²) | 101.60 ± 115.75 | 99.06 ± 103.53 | 101.65 ± 120.32 | 97.86 ± 97.94 | 0.96 | 77.83 ± 31.77 | 85.92 ± 34.92 | 87.51 ± 46.33 | 87.01 ± 44.71 | 0.608 |
| SIRI | 1.73 ± 0.92 | 2.07 ± 0.71 | 2.70 ± 1.12 | 3.85 ± 1.97 | < 0.001 | 1.58 ± 0.59 | 2.14 ± 0.75 | 2.19 ± 0.85 | 3.49 ± 1.64 | < 0.001 |
| NLR | 2.96 ± 0.49 | 3.55 ± 0.96 | 4.22 ± 1.34 | 6.06 ± 1.07 | < 0.001 | 3.11 ± 0.57 | 3.47 ± 0.81 | 4.07± 1.55 | 5.51 ± 1.68 | < 0.001 |
| PLR | 86.20 ± 102.97 | 116.47 ± 120.33 | 138.65 ± 115.17 | 204.21 ± 168.76 | < 0.001 | 89.61 ± 98.11 | 112.99 ± 101.48 | 148.30 ± 121.00 | 206.19 ± 169.23 | < 0.001 |
| Variable | ≥1 SMuRF |
| SMuRF‐less |
| ||||||
|---|---|---|---|---|---|---|---|---|---|---|
| Q1 ( | Q2 ( | Q3 ( | Q4 ( | Q1 ( | Q2 ( | Q3 ( | Q4 ( | |||
| SIRI | 1.23 ± 0.27 | 1.88 ± 0.17 | 2.58 ± 0.25 | 4.50 ± 1.69 | < 0.001 | 1.19 ± 0.29 | 1.81 ± 0.15 | 2.40 ± 0.24 | 3.96 ± 1.24 | < 0.001 |
| Age (years) | 61.23 ± 13.04 | 64.74 ± 12.28 | 65.22 ± 12.07 | 68.68±11.30 | < 0.001 | 58.11± 15.02 | 63.37 ± 13.22 | 66.66 ± 13.39 | 68.97 ± 11.75 | 0.051 |
| Gender ( | 0.001 | 0.05 | ||||||||
| Male | 183 (47.9) | 223 (60.5) | 241 (61.2) | 266 (66.5) | 26 (50.8) | 36 (76.0) | 37 (81.7) | 37 (81.0) | ||
| Female | 135 (32.6) | 158 (39.5) | 140 (38.8) | 116 (33.5) | 20 (49.2) | 9 (24.0) | 8 (18.3) | 9 (19.0) | ||
| Race ( | < 0.001 | 0.125 | ||||||||
| Mexican American | 46 (5.4) | 48 (4.0) | 49 (3.5) | 28 (3.3) | 5 (4.7) | 4 (2.4) | 5 (5.7) | 5 (5.9) | ||
| Non‐Hispanic Black | 116 (18.8) | 66 (8.7) | 50 (7.0) | 34 (3.5) | 5 (5.4) | 1 (0.9) | 2 (2.4) | 0 (0.0) | ||
| Non‐Hispanic White | 161 (63.7) | 207 (76.9) | 237 (80.9) | 280 (84.8) | 25 (74.0) | 35 (91.2) | 32 (83.7) | 35 (85.1) | ||
| Other Hispanic | 36 (5.5) | 36 (4.3) | 23 (3.0) | 20 (2.0) | 4 (3.8) | 2 (1.1) | 5 (7.6) | 3 (3.0) | ||
| Other race | 23 (6.6) | 24 (6.1) | 22 (5.6) | 20 (6.4) | 7 (12.0) | 3 (4.3) | 1 (0.6) | 3 (6.0) | ||
| Education ( | 0.467 | 0.177 | ||||||||
| Below high school | 136 (27.3) | 147 (28.8) | 145 (24.9) | 137 (31.1) | 12 (11.2) | 14 (22.8) | 11 (16.1) | 12 (11.7) | ||
| High school or above | 246 (72.7) | 234 (71.2) | 236 (75.1) | 245 (68.9) | 34 (88.8) | 30 (77.2) | 34 (83.9) | 34 (88.3) | ||
| Married ( | 0.109 | 0.228 | ||||||||
| No | 171 (40.0) | 153 (32.3) | 162 (41.4) | 166 (34.9) | 8 (15.3) | 15 (30.0) | 14 (30.6) | 14 (18.8) | ||
| Yes | 211 (60.0) | 228 (67.7) | 219 (58.6) | 216 (65.1) | 38 (84.7) | 30 (70.0) | 31 (69.4) | 32 (81.2) | ||
| Diabetes ( | 0.398 | |||||||||
| No | 251 (70.2) | 239 (68.4) | 242 (63.8) | 246 (70.5) | 46 (100.0) | 45 (100.0) | 45 (100.0) | 46 (100.0) | ||
| Yes | 131 (29.8) | 142 (31.6) | 139 (36.2) | 136 (29.5) | ||||||
| Hypertension ( | 0.382 | |||||||||
| No | 320 (83.4) | 322 (80.7) | 329 (84.9) | 338 (86.9) | 46 (100.0) | 45 (100.0) | 45 (100.0) | 46 (100.0) | ||
| Yes | 62 (16.6) | 59 (19.3) | 52 (15.1) | 44 (13.1) | ||||||
| Smoking ( | 0.386 | |||||||||
| No | 299 (75.6) | 298 (74.9) | 299 (77.0) | 282 (70.2) | 46 (100.0) | 45 (100.0) | 45 (100.0) | 46 (100.0) | ||
| Yes | 83 (24.4) | 83 (25.1) | 82 (23.0) | 100 (29.8) | ||||||
| Drinking ( | 0.802 | 0.586 | ||||||||
| No | 170 (37.9) | 158 (38.5) | 149 (34.7) | 158 (38.5) | 18 (34.5) | 13 (23.8) | 15 (25.6) | 20 (38.9) | ||
| Yes | 212 (62.1) | 223 (61.5) | 232 (65.3) | 224 (61.5) | 28 (65.5) | 32 (76.2) | 30 (74.4) | 26 (61.1) | ||
| CKD ( | 0.117 | 0.755 | ||||||||
| No | 255 (67.6) | 273 (74.5) | 281 (78.1) | 297 (74.4) | 36 (71.6) | 36 (76.5) | 38 (83.0) | 35 (71.5) | ||
| Yes | 127 (32.4) | 108 (25.5) | 100 (21.9) | 85 (25.6) | 10 (28.4) | 9 (23.5) | 7 (17.0) | 11 (28.5) | ||
| Hyperlipidemia ( | 0.166 | |||||||||
| No | 239 (65.6) | 232 (61.6) | 222 (55.4) | 247 (64.0) | 46 (100.0) | 45 (100.0) | 45 (100.0) | 46 (100.0) | ||
| Yes | 143 (34.4) | 149 (38.4) | 159 (44.6) | 135 (36.0) | ||||||
| PIR | 2.57 ± 1.68 | 2.54 ± 1.53 | 2.61 ± 1.67 | 2.61 ± 1.44 | 0.959 | 3.35 ± 1.59 | 3.28 ± 1.45 | 3.15 ± 1.61 | 3.26 ± 1.59 | 0.966 |
| BMI (kg/m2) | 29.99±6.57 | 30.57±6.10 | 30.53±7.22 | 29.37±6.89 | 0.153 | 26.07±3.93 | 29.20 ± 6.37 | 27.21 ± 4.81 | 28.80 ± 6.05 | 0.107 |
| LDL‐C (mmol/L) | 2.93 ± 1.07 | 2.71 ± 1.00 | 2.63 ± 1.00 | 2.45 ± 0.97 | < 0.001 | 2.29 ± 0.55 | 2.25 ± 0.58 | 2.30 ± 0.56 | 2.24 ± 0.64 | 0.976 |
| HDL‐C (mmol/L) | 1.33±0.39 | 1.32±0.43 | 1.27±0.43 | 1.31±0.46 | 0.527 | 1.57±0.51 | 1.24±0.29 | 1.25 ± 0.29 | 1.25±0.32 | 0.059 |
| TC (mmol/L) | 4.98 ± 1.21 | 4.79 ± 1.20 | 4.68 ± 1.15 | 4.47± 1.12 | < 0.001 | 4.34 ± 0.70 | 4.19 ± 0.78 | 4.12 ± 0.56 | 4.11±0.70 | 0.503 |
| TG (mmol/L) | 1.58 ± 0.87 | 1.65 ± 0.82 | 1.71 ± 0.87 | 1.53 ± 0.80 | 0.114 | 1.05 ± 0.52 | 1.53 ± 0.70 | 1.24 ± 0.50 | 1.37± 0.64 | 0.606 |
| ALT (U/L) | 24.79 ± 14.94 | 24.54 ± 12.71 | 23.50 ± 15.49 | 22.56 ± 19.53 | 0.172 | 24.67 ± 13.62 | 25.40 ± 8.75 | 22.08 ± 8.40 | 23.01 ± 9.80 | 0.036 |
| AST (U/L) | 25.16 ± 12.08 | 25.61 ± 10.76 | 26.12 ± 12.01 | 24.87 ± 18.35 | 0.759 | 25.27 ± 8.67 | 27.16 ± 6.13 | 23.61 ± 5.08 | 24.44 ± 6.79 | 0.433 |
| eGFR (mL/min/1.73 m²) | 87.12 ± 96.59 | 95.00 ± 87.46 | 105.36 ± 129.63 | 110.42 ± 116.47 | 0.008 | 79.02 ± 36.29 | 77.62 ± 35.76 | 91.76 ± 42.00 | 90.07 ± 44.16 | 0.083 |
| SII | 686.83 ± 249.67 | 778.03 ± 263.98 | 972.03 ± 316.68 | 1428.62 ± 832.58 | < 0.001 | 643.2 ± 248.08 | 766.97 ± 219.92 | 822.40 ± 282.73 | 1222.45 ± 554.85 | < 0.001 |
| NLR | 2.94 ± 0.91 | 3.57 ± 1.45 | 4.14 ± 3.04 | 6.13 ± 4.55 | < 0.001 | 3.06 ± 0.48 | 3.56 ± 0.97 | 3.92 ± 1.22 | 5.63 ± 6.09 | < 0.001 |
| PLR | 119.39 ± 105.33 | 123.46 ± 120.17 | 133.47 ± 119.96 | 169.21 ± 132.47 | < 0.001 | 127.23 ± 82.05 | 127.91 ± 101.56 | 124.06 ± 96.00 | 177.70 ± 134.21 | < 0.001 |
| Character | HR (95% CI) |
|
| HR (95% CI) |
|
| HR (95%CI) |
|
|
|---|---|---|---|---|---|---|---|---|---|
| ≥ 1SMuRF | |||||||||
| SII (tertile) | < 0.001 | < 0.001 | < 0.001 | ||||||
| Q1 | ref. | ref. | ref. | ref. | ref. | ref. | |||
| Q2 | 1.04 (0.82,1.31) | 0.713 | 1.01(0.79,1.26) | 0.956 | 1.07 (0.84,1.34) | 0.586 | |||
| Q3 | 1.12 (0.89,1.40) | 0.320 | 1.17(0.93,1.47) | 0.160 | 1.21 (0.96,1.52) | 0.094 | |||
| Q4 | 1.45 (1.17,1.80) | < 0.001 | 1.39(1.12,1.74) | 0.002 | 1.47 (1.18,1.84) | < 0.001 | |||
| SIRI (tertile) | < 0.001 | < 0.001 | < 0.001 | ||||||
| Q1 | ref. | ref. | ref. | ref. | ref. | ref. | |||
| Q2 | 1.35 (1.07,1.71) | 0.011 | 1.14 (0.90,1.45) | 0.267 | 1.12 (0.88,1.43) | 0.338 | |||
| Q3 | 1.54 (1.22,1.94) | < 0.001 | 1.14 (0.91,1.44) | 0.252 | 1.11 (0.87,1.40) | 0.396 | |||
| Q4 | 2.61 (2.09,3.25) | < 0.001 | 1.75 (1.39,2.22) | < 0.001 | 1.66 (1.31,2.10) | < 0.001 | |||
| SMuRF‐less | |||||||||
| SII (tertile) | < 0.001 | < 0.001 | < 0.001 | ||||||
| Q1 | ref. | ref. | ref. | ref. | ref. | ref. | |||
| Q2 | 1.34 (0.61,2.91) | 0.461 | 1.51 (0.66,3.43) | 0.327 | 1.50 (0.65,3.49) | 0.343 | |||
| Q3 | 1.15 (0.54,2.47) | 0.714 | 1.74 (0.77,3.96) | 0.185 | 1.70 (0.73,3.93) | 0.219 | |||
| Q4 | 2.05 (1.02,4.10) | 0.043 | 3.33 (1.52,7.26) | 0.002 | 3.32 (1.45,7.59) | 0.004 | |||
| SIRI (tertile) | < 0.001 | < 0.001 | 0.016 | ||||||
| Q1 | ref. | ref. | ref. | ref. | ref. | ref. | |||
| Q2 | 1.70 (0.70,4.09) | 0.239 | 1.33 (0.52,3.38) | 0.550 | 1.62 (0.61,4.28) | 0.326 | |||
| Q3 | 2.03 (0.88,4.71) | 0.098 | 1.64 (0.67,4.03) | 0.281 | 2.13 (0.81,5.60) | 0.123 | |||
| Q4 | 4.39 (1.99,9.68) | < 0.001 | 4.16 (1.76,9.81) | 0.001 | 4.25 (1.67,10.80) | 0.002 |
- —National Natural Science Foundation of China10.13039/501100001809
- —Liaoning Revitalization Talents Program10.13039/501100018617
- —Innovation Team Project of Higher Education Institutions in Liaoning Province
- —Outstanding Youth Scientific Talent Project of Dalian
- —Dalian Science and Technology Innovation Fund10.13039/501100017683
Peer Reviews
No public reviews on file for this paper yet. If you reviewed it on a platform where reviews are public (OpenReview, ICLR, NeurIPS, ICML), you can paste yours below so the community can read it here.
Videos
No videos yet. Explain this paper in a talk, walkthrough, or lecture? Add one.
Taxonomy
TopicsInflammatory Biomarkers in Disease Prognosis · Adipokines, Inflammation, and Metabolic Diseases · Biomarkers in Disease Mechanisms
1. Introduction
Coronary heart disease (CHD) is one of the leading causes of death globally, and the high prevalence of CHD is becoming an important public health issue with the accelerating aging process [1, 2]. Diabetes mellitus, hypercholesterolemia, hypertension and, smoking are recognized as modifiable risk factors for CHD, and the prevention and treatment of CHD has improved dramatically with the control and intervention of modifiable risk factors [3, 4]. However, even after controlling these risk factors, global CHD morbidity and mortality remain high [5], suggesting that there are still potentially unknown risk factors that influence the pathogenesis and prognosis of the disease.
In recent years, a series of studies have shown that an increasing number of CHD patients have been found to be free of standard modifiable risk factors (SMuRFs) and are rising at a steady and significant rate [6, 7]. A multicenter study from Australia found that the incidence of myocardial infarction (MI) in patients with SMuRF‐less increased from 14% to 23% between 1999–2017, with a large and increasing proportion of MI cases occurring independently of SMuRFs [6]. This is consistent with findings from a large global meta‐analysis of over 1.2 million acute coronary syndrome (ACS) patients, which reported that approximately 12% of patients were SMuRF‐less [7]. In contrast, patients with SMuRF‐less did not show a better prognosis compared with patients with at least 1 SMuRF (≥ 1 SMuRF), especially in patients with ST–segment elevation MI (STEMI) [8], and although this may be related to the lack of evidence‐based pharmacotherapy in this population, it may also be attributable to currently unidentified risk factors. This paradox highlights a significant clinical management gap: The absence of tailored risk stratification tools designed specifically for SMuRF‐less patients, who may be undertreated because they are perceived as "low risk." Therefore, there is an urgent need to find a new biomarker to effectively identify the prognosis of SMuRF‐less patients.
Chronic inflammation plays an important role in the pathogenesis of coronary atherosclerosis. Even in the absence of traditional risk factors, inflammation itself can drive arterial proliferation and modulate aspects of plaque biology, thereby triggering thrombotic complications of atherosclerosis [9, 10]. Systemic immune inflammatory index (SII) and Systemic inflammatory response index (SIRI), two novel inflammatory markers consisting of platelets and three subtypes of leukocytes, have shown better prediction in tumors such as colorectal and esophageal cancers, compared to the traditional inflammatory markers neutrophil‐to‐lymphocyte ratio (NLR) and platelet‐to‐lymphocyte ratio (PLR) value [2, 11]. In addition, many studies have shown that SII and SIRI are also strongly associated with cardiovascular and all‐cause mortality [12, 13]. While traditional inflammatory markers such as C‐reactive protein (CRP) and the NLR have shown prognostic value, composite indices like SII and SIRI, which integrate counts of multiple immune cell types (neutrophils, platelets, lymphocytes, and monocytes), may offer a more comprehensive reflection of the underlying systemic inflammatory and immune status. However, the correlation between SII and SIRI and mortality in patients with coronary atherosclerosis with and without SMuRFs is unknown. To date, there is a notable lack of research focusing on the prognostic value of inflammatory biomarkers specifically within the SMuRF‐less population. Given the clinical management gap for these patients, who often face a paradoxical high risk of adverse outcomes, there is an urgent need for novel risk stratification tools. Therefore, this study aimed to examine the relationship between SII and SIRI and mortality in coronary atherosclerosis patients with and without SMuRFs, investigating the potential utility of these inflammatory markers to refine prognosis in this special population. Simultaneously, a brief correlation analysis was conducted incorporating the relatively well‐established inflammatory indices NLR and PLR for comparison. By evaluating these systemic inflammation indices in SMuRF‐less and SMuRF ≥1 patients, this study may help refine risk stratification beyond conventional risk factors and identify high‐risk individuals who might otherwise be overlooked.
2. Methods
2.1. Study Population
The National Health and Nutrition Examination Survey (NHANES) database is a population‐based cross‐sectional survey program conducted by the Centers for Disease Control and Prevention (CDC) and the National Center for Health Statistics (NCHS). Detailed demographic information was collected through interview surveys, physical examination and laboratory tests, and followed up over time. All data were made freely available and unrestricted reuse was allowed through an open license (http://www.cdc.gov/nchs/nhanes.htm). All NHANES protocols were approved by the NCHS Ethics Committee (NCHS, 2012) and written informed consent was obtained from all participants. This study included data from 10 continuous cycles of the NHANES database (1999–2018). CHD patients were defined as an individual who answered “yes” to the following question on the NHANES questionnaire: “Has a doctor or other health professional ever told you that you had a heart attack also called myocardial infarction?” “Has a doctor or other health professional ever told you that you had coronary heart disease?” and “Has a doctor or other health professional ever told you that you had angina also called angina pectoris?”. This method of identifying patients with CHD has been used in previous studies [14, 15]. A total of 4257 participants were enrolled in the study, after which 2541 participants with incomplete histories and eight participants lacking calculated SII and SIRI data were excluded, resulting in the inclusion of 1708 CHD patients with complete data. Figure 1 displays the participants selection procedure.
The flow chart.
2.2. Definition of ≥1 SMuRF and SMuRF‐Less
SMuRF was defined as the presence of at least one of the following: current smoking status, hypercholesterolemia, diabetes, or hypertension [16]. Current smoking status was defined as an individual who answered “every day” or “some days” to the following question: Do you now smoke cigarettes? Hypercholesterolemia was defined as previous or ongoing oral low‐density lipoprotein cholesterol (LDL‐C) lowering therapy with an LDL‐C concentration ≥3.5 mmol/L or a total cholesterol (TC) concentration ≥ 5.5 mmol/L. Diabetes was defined as a self‐reported diagnosis or ongoing use of hypoglycemic medication including insulin or other oral hypoglycemic agents, or a fasting blood glucose (FBG) level ≥ 7 mmol/L or HbA1c ≥ 6.5%. Hypertension was specifically defined as a systolic blood pressure (SBP) of ≥140 mmHg, a diastolic blood pressure (DBP) of ≥90 mmHg, or the current use of antihypertensive medication. SMuRF‐less is defined as the absence of these SMuRFs above.
2.3. Definition of SII and SIRI
SII is defined as (platelet counts × neutrophil counts)/lymphocyte counts and SIRI is defined as (neutrophil counts × monocyte counts)/lymphocyte counts [17]. These indices were calculated using laboratory data obtained at the baseline examination only. SII and SIRI were categorized into four groups according to quartiles, and the relationship between these two indices and mortality in patients with CHD with or without SMuRFs was assessed.
2.4. Determination of Mortality Outcomes
The NCHS has linked data collected from several NCHS population surveys with death certificate records from the National Death Index (NDI). Publicly available death data through December 31, 2019 (https://www.cdc.gov/nchs/data-linkage/mortality-public.htm) were used for this study. Follow‐up duration for each participant was calculated from the date of the baseline interview to the date of death or the end of the follow‐up period (December 31, 2019), whichever came first. Participants who were still alive at the end of the follow‐up period were censored. Statistics were determined according to the International Statistical Classification of Diseases, 10th edition (ICD‐10): all‐cause deaths, cardiovascular disease deaths (ICD‐10:054‐068), and cancer deaths (ICD‐10:019‐043) [18].
2.5. Covariates
This study accounted for a range of covariates, including demographic characteristics (age, education, race, marital status, poverty‐to‐income ratio [PIR], body mass index [BMI], alcohol consumption, and smoking habits), medical history (diabetes and hypertension), laboratory test results (TC, triglycerides [TG], high‐density lipoprotein cholesterol [HDL‐C], alanine aminotransferase [ALT], aspartate aminotransferase [AST], and estimated glomerular filtration rate [eGFR]). Chronic kidney disease (CKD) was defined as an eGFR< 60 mL/min/1.73 m^2^. Hyperlipidemia was defined as any one or more of the following: TC ≥ 6.2 mmol/L, LDL‐C ≥ 4.1 mmol/L, TG ≥ 2.3 mmol/L, and HDL‐C ≤ 1.0 mmol/L.
2.6. Statistical Analysis
To account for the complex, multistage probability sampling design of the NHANES survey, all analyses incorporated the appropriate sampling weights, strata, and primary sampling units (PSUs) to generate nationally representative estimates. Continuous variables were presented as mean ± standard deviation (SD), and categorical variables were expressed as counts and percentages, and were compared using the ANOVA and Pearson chi‐square test. Event‐free survival was estimated using Kaplan–Meier survival curves and compared with the log‐rank test. Multivariate Cox regression models were performed to evaluate the relationship between SII, SIRI and mortality. Schoenfeld residual test was used to verify the assumption of proportional hazards in the Cox analysis. Three models were used to assess the relationship: Crude model was unadjusted; Model 1 adjusted for age, race, education, and marital status; Model 2 further adjusted for smoking, alcohol consumption, BMI, hypertension, diabetes, CKD, HDL‐C, TG, TC, LDL‐C, ALT, and AST. Restricted cubic splines (RCSs) analysis was performed to examine potential nonlinearity in the associations and to depict overall trends. RCS analyses with three knots placed at the 10th, 50th, and 90th percentiles of the SII or SIRI distributions were performed to examine potential nonlinearity in the associations and to depict overall trends. Statistical analysis was conducted using R Version 4.1.3, with a p‐value < 0.05 (two‐sided) considered statistically significant.
3. Results
3.1. Baseline Characteristics of Population Stratified by SII/SIRI
A total of 1708 CHD patients were included in this study, including 1526 patients with≥ 1 SMuRF and 182 patients with SMuRF‐less. The mean age of these patients was 67.29 ± 12.1 years, and the majority were male (61.4%) and non‐Hispanic White (59.2%). During a median follow‐up of 6.58 years, 737 patients (43.1%) died, and a total of 259 (15.1%) died of cardiovascular diseases (CVDs). All patients were divided equally into four groups according to quartiles of SII, SIRI, and as shown in Table 1, the number of women, non‐Hispanic Whites, and people with drinking habits increased with increasing SII in patients with ≥1 SMuRFs, however, there was no such pattern in the population with SMuRF‐less. And when grouped in SIRI quartiles, patients with ≥1 SMuRFs in the SIRI Q4 group were older, more likely to be male, had lower levels of LDL‐C and HDL‐C, and higher eGFR compared to the SIRI Q1 group. However, the difference was not found in patients with SMuRF‐less (Table 2). Additionally, we found that SII and SIRI levels increased in conjunction with each other.
3.2. Associations Between SII/SIRI and Mortality in Patients With ≥1 SMuRF and SMuRF‐Less Groups
Schoenfeld’s residual test indicated global p‐values of 0.128 and 0.234 for all‐cause mortality and cardiovascular mortality endpoints, respectively, suggesting that the proportional hazards assumption was met. Multivariate Cox regression showed that after adjusting for potential covariates, in patients with ≥1 SMuRF, the SII Q4 and SIRI Q4 group were strongly associated with an increase in both all‐cause mortality (SII: hazard ratio [HR] 1.47, 95% confidence interval [CI] 1.18–1.84, p < 0.001; SIRI:HR 1.66, 95%CI 1.31–2.10, p < 0.001, Table 3) and cardiovascular mortality (SII:HR 1.52, 95%CI 1.07–2.17, p = 0.020; SIRI:HR 1.63, 95%CI 1.11–2.38, p = 0.011, Table S1) compared with the SII Q1 and SIRI Q1 group, respectively. p‐Value trend suggested a linear association between SII, SIRI and both all‐cause and cardiovascular mortality (all p trend < 0.05, Table 3, Table S1). Additionally, we observed that in patients with ≥1 SMuRF, NLR and PLR were linearly associated with all‐cause mortality and cardiovascular mortality (all trend p‐values < 0.05, Table S2, Table S3).
In patients with SMuRF‐less, the risk of all‐cause mortality was also significantly higher in the SII Q4 and SIRI Q4 group compared with the SII Q1 and SIRI Q1 group, respectively (SII:HR 3.32, 95%CI 1.45–7.59, p = 0.004; SIRI:HR 4.25, 95%CI 1.67–10.80, p = 0.002, Table 3). Besides, there was also a linear positive correlation between SII, SIRI and all‐cause mortality (SII:p trend < 0.001; SIRI:p trend = 0.016, Table 3). In terms of cardiovascular mortality, there was a positive correlation between SIRI and cardiovascular mortality (SIRI:HR 11.69, 95%CI 1.43–95.21, p = 0.028, Table S1), whereas there was no significant association with SII (SII:HR 2.21, 95%CI 0.54–8.97, p = 0.272, Table S1). p‐Value trend revealed that neither SII, nor SIRI is linearly related to cardiovascular mortality (SII:p trend = 0.060, SIRI:p trend = 0.060, Table S1). After adjusting for potential covariates, no significant association was observed between NLR, PLR, and all‐cause mortality or cardiovascular mortality (Table S2, Table S3).
Similarly, Kaplan–Meier survival curves revealed that in terms of all‐cause mortality, in both groups of patients, the group with lower levels of SII and SIRI had a higher long‐term survival rate than the group with higher levels (p < 0.001, Figure 2), although the difference in survival in patients with SMuRF‐less was not statistically significant for SII (p = 0.14, Figure 2). As for cardiovascular mortality, among patients with ≥1 SMuRFs, patients with lower levels of SII and SIRI still had higher long‐term survival than those in the other groups (SII: p = 0.002, SIRI:p < 0.001, Figure S1), but there was no statistically significant difference in survival between the SII and SIRI groups in patients with SMuRF‐less (SII:p = 0.12, SIRI:p = 0.052, Figure S1).
Figure 2. Kaplan–Meier curves for all‐cause death during follow‐up for patients in each subgroup. (A) Kaplan–Meier curves of patients with SMuRFs grouped according to SII; (B) Kaplan–Meier curves of patients with SMuRFs grouped according to SIRI; (C) Kaplan–Meier curves of patients with SMuRF‐less grouped according to SII; (D) Kaplan–Meier curves of patients with SMuRF‐less grouped according to SIRI.(A)(B)(C)(D)
RCS analysis was performed to assess the potential dose–response relationship between SII, SIRI and mortality. In Figure 3, a positive correlation between SII, SIRI and all‐cause mortality was found in both groups (p‐overall < 0.05). Of note, SIRI showed a nonlinear relationship with all‐cause mortality in patients with SMuRF‐less (p‐nonlinear = 0.013), while the rest showed a linear relationship (p‐nonlinear > 0.05). As for cardiovascular mortality, SII and SIRI still showed linear trend in patients with ≥1 SMuRF (p‐overall < 0.05, p‐nonlinear > 0.05), but no significant trend in patients with SMuRF‐less (p‐overall > 0.05) (Figure S2).
Figure 3. Relationship between SII/SIRI and all‐cause mortality as assessed by the RCS after correction for covariates. (A) RCS analysis of patients with SMuRFs grouped according to SII; (B) RCS analysis of patients with SMuRFs grouped according to SIRI; (C) RCS analysis of patients with SMuRF‐less grouped according to SII; (D) RCS analysis of patients with SMuRF‐less grouped according to SIRI. The solid blue line corresponds to the central estimates and the light blue shading indicates the 95% confidence intervals. RCS, restricted cubic spline; SII, systemic inflammation index; SIRI, systemic inflammatory response index; SMuRF, standard modifiable risk factors.(A)(B)(C)(D)
4. Discussion
Inflammation is recognized as a potential factor in the development of many diseases, including CHD. Inflammation in the human body promotes an abnormal elevation of platelets, while the abnormally aggregated platelets adhere to the surface of vascular endothelial cells, inducing local ischemia, hypoxia, and microthrombosis, which results in vascular occlusion, causing malignant events such as MI, stroke, and peripheral vascular disease [19]. Previous studies have shown that a variety of inflammatory markers in the body, such as CRP and interleukin‐6, have been shown to have prognostic significance in patients with coronary artery disease [20–22]. Recently, SII and SIRI have been proposed as emerging inflammatory markers that are able to respond to the degree of inflammatory response in a much simpler and quicker way. SII and SIRI have been demonstrated to have a strong correlation with the occurrence of ACS in patients with coronary artery disease [12, 23].
However, it should be noted that chronic inflammation is often a common pathway for multiple cardiovascular risk factors to mediate coronary atherosclerosis. Specifically, high levels of lipoprotein(a) promote arterial wall inflammation and increased migration of monocytes into atherosclerotic plaques, with long‐term effects on coronary inflammatory plaque formation [24], in addition to insulin resistance, which can mediate coronary artery disease through inflammatory responses [25]. Previous studies have tended to focus more on the prognostic impact of inflammation in populations of patients with coronary artery disease in the presence of traditional risk factors [26], however, the role of inflammation in patients without specific risk factors is not clear.
First and foremost, it is important to emphasize that, given the observational design of the NHANES survey, our findings demonstrate a strong association but cannot establish a causal relationship between elevated SII/SIRI and mortality. Our results should be interpreted as hypothesis‐generating in this context. In our study, we divided patients with CHD into two groups according to the presence of traditional risk factors, and after adjusting for relevant confounders, we found that both SII and SIRI were linearly and significantly associated with all‐cause mortality and cardiovascular mortality in the SMuRF ≥1 population, which is consistent with the findings of a previous study [27]. In contrast, in patients with SMuRF‐less, we found significant associations between both inflammatory indices and all‐cause mortality, and RCS analysis suggested that SII was linearly associated with all‐cause mortality, whereas SIRI was nonlinearly associated. Notably, compared to established inflammatory markers NLR and PLR, SII and SIRI demonstrated stronger associations with all‐cause mortality and cardiovascular mortality in patients with SMuRF‐less. This suggests potential clinical value for SII and SIRI in this population, warranting further validation through prospective studies. To our knowledge, this is the first study to specifically examine the association of SII and SIRI with long‐term clinical outcomes in patients with SMuRF ≥ 1 and SMuRF‐less. Our results suggest that high levels of SII and SIRI are strongly associated with all‐cause mortality regardless of the presence of traditional risk factors. This suggests that we need to pay more attention to the role of inflammation in atherosclerosis, controlling the development of inflammation is particularly important in patients who are not diabetic, hypertensive, or nonsmokers and has the potential to improve their prognosis and survival.
The question of why SMuRF‐less patients exhibit elevated systemic inflammation is a critical area for future research. Several plausible mechanisms, not captured by standard risk factor assessment, could be involved. A genetic predisposition to a heightened inflammatory response or dysregulated immune function may play a significant role. Furthermore, a range of nontraditional or residual risk factors could contribute, including chronic psychosocial stress, exposure to environmental pollutants like air pollution, pro‐inflammatory dietary patterns, gut dysbiosis, or subclinical chronic infections such as periodontal disease. These factors could collectively promote a state of chronic low‐grade inflammation, thereby driving atherogenesis and increasing mortality risk independently of conventional risk factors.
In patients with cirrhosis and stroke, the hyperinflammatory response is also an important factor in disease progression [28, 29]. Similarly, in CHD patients, the severity of MI can be reduced, and cardiac function can be improved by decreasing the myocardial inflammatory response [30]. Our study demonstrated that patients with a high inflammatory response had lower long‐term survival than patients with lower levels of inflammation, irrespective of whether they had risk factors or not. Therefore, in CHD patients, control of the inflammatory response becomes more important than just control of blood pressure, blood glucose, and lipids. Several recent studies have exacerbated the inflammatory response by modulating macrophage polarization in a mouse model of MI, all of which ultimately affected cardiac function and survival after MI in mice [31, 32]. In contrast, attenuating the inflammatory response improves cardiac function and remodeling after MI [33]. In recent years, many clinical studies have found that several treatments targeting the risk of residual inflammation can significantly reduce the rate of vascular events [34, 35]. There is evidence that low‐dose colchicine in combination with statins safely reduces major adverse cardiovascular events in patients with stable atherosclerosis, with a greater magnitude of benefit than continuous lipid‐lowering agents alone [36]. However, most of the current studies have been conducted only in patients with ≥1 SMuRF, and it is unclear whether the residual risk of inflammation can be reduced by anti‐inflammatory agents to improve patient prognosis in patients with SMuRF‐less. Our study reveals that inflammation is an important factor influencing the prognosis of patients with CHD and is independent of traditional cardiovascular risk factors; therefore, anti‐inflammatory therapy may remain a potential therapeutic target for such patients.
Our study has several limitations. First, diagnosis of cardiovascular disease is confirmed by self‐report, which may have some false positives or missed patients with unreported cardiovascular disease. Second, the number of patients in the SMuRF‐less subgroup (n = 182) was relatively small, and an a priori power calculation was not performed as this was a post hoc analysis of a public database. This limited statistical power may have reduced our ability to detect significant associations, particularly for outcomes with fewer events like cardiovascular mortality. For instance, the lack of a significant association between SII and cardiovascular mortality in this group (p = 0.272) should be interpreted with caution, as it may represent a Type II error. Therefore, our findings in the SMuRF‐less population should be considered exploratory, and validation in larger, dedicated cohorts is essential. Third, more research is needed to determine if these findings can be widely used in other areas.
5. Conclusions
Taken together, findings in this study showed that in CHD patients with ≥1 SMuRF, SII and SIRI were positively correlated with all‐cause mortality and cardiovascular mortality. While in CHD patients with SMuRF‐less, higher levels of SII and SIRI also significantly increase the prevalence of all‐cause mortality, but not with cardiovascular mortality. This suggests that inflammation may be an important factor contributing to poor prognosis independently of atherosclerosis‐specific risk factors, and further studies are needed to better explore their association and underlying causal mechanisms.
NomenclatureSMuRFs:Standard modifiable risk factorsSII:Systemic immune inflammatory indexSIRI:Systemic inflammatory response indexNHANES:National Health and Nutrition Examination SurveyCHD:Coronary heart diseaseRCS:Restricted cubic splineACS:Acute coronary syndromeSTEMI:ST‐segment elevation myocardial infarctionNLR:Neutrophil to lymphocyte ratioPLR:Platelet‐to‐lymphocyte ratioCDC:Centers for Disease Control and PreventionNCHS:National Center for Health StatisticsLdl‐c:Low‐density lipoprotein cholesterolFBG:Fasting blood glucoseSBP:Systolic blood pressureDBP:Diastolic blood pressurePIR:Poverty‐to‐income ratioBMI:Body mass indexTC:Total cholesterolTG:TriglyceridesHDL‐C:High‐density lipoprotein cholesterolALT:Alanine aminotransferaseAST:Aspartate aminotransferaseeGFR:Estimated glomerular filtration rateCKD:Chronic kidney diseasePSUs:Primary sampling unitsCVDs:Cardiovascular diseasesMI:Myocardial infarction.
Ethics Statement
The data are publicly available (in the NHANES database); hence, ethical approval statement and informed consent are not required for the study.
Conflicts of Interest
The authors declare no conflicts of interest.
Author Contributions
Weiren Yan, Bingqian Zhang, and Xiaoyan Zhang contributed equally to this work.
Funding
This work is supported by the National Natural Science Foundation of China (Grant 82170252), the Liaoning Revitalization Talents Program (Grant XLYC2203054), the Innovation Team Project of Higher Education Institutions in Liaoning Province (Grant LJ222410161084), the Outstanding Youth Scientific Talent Project of Dalian (Grant 2024RJ013), and the Dalian Science and Technology Innovation Fundation (Grant 2023JJ13SN039).
Supporting Information
Additional supporting information can be found online in the Supporting Information section.
Supporting information
Supporting Information Table S1. Association between SII/SIRI and Cardiovascular Mortality in Patients with Coronary Atherosclerosis, Stratified by SMuRF Status. Table S2. Association between NLR/PLR and All‐cause Mortality in Patients with Coronary Atherosclerosis, Stratified by SMuRF Status. Table S3. Association between NLR/PLR and Cardiovascular Mortality in Patients with Coronary Atherosclerosis, Stratified by SMuRF Status. Figure S1. Kaplan‐Meier curves for cardiovascular death during follow‐up for patients in each subgroup. Figure S2. Relationship between SII/SIRI and cardiovascular mortality as assessed by the RCS after correction for covariates.
The reference list from the paper itself. Each links out to its DOI / PubMed record.
- 1Feigin L. V. , Stark B. A. , and Johnson C. O. , et al.Global, Regional, and National Burden of Stroke and its Risk Factors, 1990–2019: A Systematic Analysis for the Global Burden of Disease Study 2019, The Lancet Neurology. (2021) 20, no. 10, 795–820, 10.1016/S 1474-4422(21)00252-0.34487721 PMC 8443449 · doi ↗ · pubmed ↗
- 2Chen J. H. , Zhai E. T. , and Yuan Y. J. , et al.Systemic Immune-Inflammation Index for Predicting Prognosis of Colorectal Cancer, World Journal of Gastroenterology. (2017) 23, no. 34, 6261–6272, 10.3748/wjg.v 23.i 34.6261, 2-s 2.0-85029591266.28974892 PMC 5603492 · doi ↗ · pubmed ↗
- 3Wilson P. W. F. , D’Agostino R. B. , Levy D. , Belanger A. M. , Silbershatz H. , and Kannel W. B. , Prediction of Coronary Heart Disease Using Risk Factor Categories, Circulation. (1998) 97, no. 18, 1837–1847, 10.1161/01.CIR.97.18.1837, 2-s 2.0-0032510639.9603539 · doi ↗ · pubmed ↗
- 4Piironen M. , Ukkola O. , and Huikuri H. , et al.Trends in Long-Term Prognosis After Acute Coronary Syndrome, European Journal of Preventive Cardiology. (2016) 24, no. 3, 274–280, 10.1177/2047487316679522, 2-s 2.0-85011565178.27856805 · doi ↗ · pubmed ↗
- 5Roth G. A. , Mensah G. A. , and Johnson C. O. , et al.Global Burden of Cardiovascular Diseases and Risk Factors, 1990–2019, Journal of the American College of Cardiology. (2020) 76, no. 25, 2980–2981, 10.1016/j.jacc.2020.11.010.33309174 · doi ↗ · pubmed ↗
- 6Vernon S. T. , Coffey S. , and D’Souza M. , et al.ST-Segment-Elevation Myocardial Infarction (STEMI) Patients Without Standard Modifiable Cardiovascular Risk Factors-How Common Are They, and What Are Their Outcomes?, Journal of the American Heart Association. (2019) 8, no. 21, 10.1161/JAHA.119.013296.PMC 689881331672080 · doi ↗ · pubmed ↗
- 7Kong G. , Chin Y. H. , and Chong B. , et al.Higher Mortality in Acute Coronary Syndrome Patients Without Standard Modifiable Risk Factors: Results From a Global Meta-Analysis of 1,285,722 Patients, International Journal of Cardiology. (2023) 371, 432–440, 10.1016/j.ijcard.2022.09.062.36179904 · doi ↗ · pubmed ↗
- 8Figtree G. A. , Vernon S. T. , and Hadziosmanovic N. , et al.Mortality in STEMI Patients Without Standard Modifiable Risk Factors: A Sex-Disaggregated Analysis of SWEDEHEART Registry Data, The Lancet. (2021) 397, no. 10279, 1085–1094, 10.1016/S 0140-6736(21)00272-5.33711294 · doi ↗ · pubmed ↗