Monitoring diaphragmatic effort during diaphragm neurostimulation-assisted ventilation
Andrea Castellvi-Font, Idunn S. Morris, Francisco José Parrilla-Gómez, Matías Madormo, Catherine A. Bellissimo, Viral Thakkar, Nawzer Mehta, Thiago Bassi, Laurent J. Brochard, Niall D. Ferguson, Ewan C. Goligher

TL;DR
This study shows that measuring changes in airway pressure during diaphragm stimulation can reliably track diaphragm effort in ventilated patients.
Contribution
The study introduces ΔPTPaw as a non-invasive, reliable method to monitor diaphragm loading during neurostimulation-assisted ventilation.
Findings
ΔPTPaw correlated strongly with transdiaphragmatic and respiratory muscle pressure-time products (R² = 0.82 and 0.92).
ΔPTPaw showed excellent discrimination for inadequate and excessive diaphragmatic effort (AUROC ≥ 0.94 and ≥ 0.86).
Increasing neurostimulation levels led to higher PTPdi and PTPmus with corresponding reductions in PTPaw.
Abstract
Diaphragm neurostimulation-assisted ventilation (DNAV) can improve cardiopulmonary function during passive mechanical ventilation. However, this technique requires a reliable method to monitor and titrate diaphragmatic loading to avoid both insufficient and excessive diaphragmatic stimulation. To establish whether the reduction in airway pressure-time product (ΔPTPaw) obtained during diaphragm neurostimulation in assist control volume-controlled mode accurately quantifies the magnitude of respiratory muscle effort elicited by neurostimulation. This was a secondary analysis of the STIMULUS trial. Diaphragm neurostimulation was titrated across four levels targeting progressive occlusion pressures of 0, − 5, − 10, and − 15 cm H₂O at two PEEP levels. At each level, airway, esophageal, and gastric pressures were recorded to compute transdiaphragmatic pressure-time product (PTPdi),…
Genes, proteins, chemicals, diseases, species, mutations and cell lines named across the full text — each resolved to its canonical identifier and authoritative record.
Click any figure to enlarge with its caption.
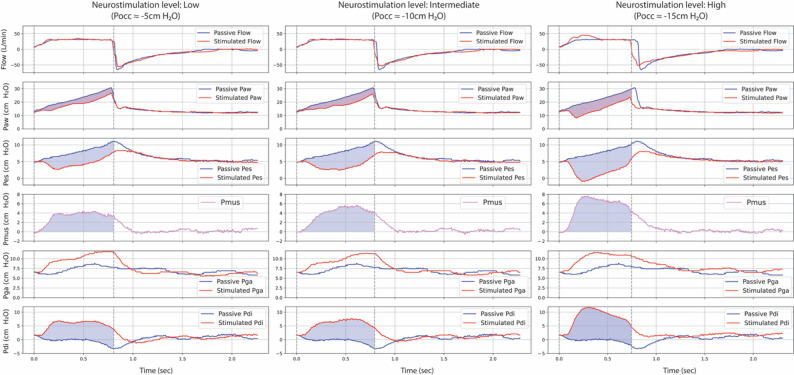 Figure 1
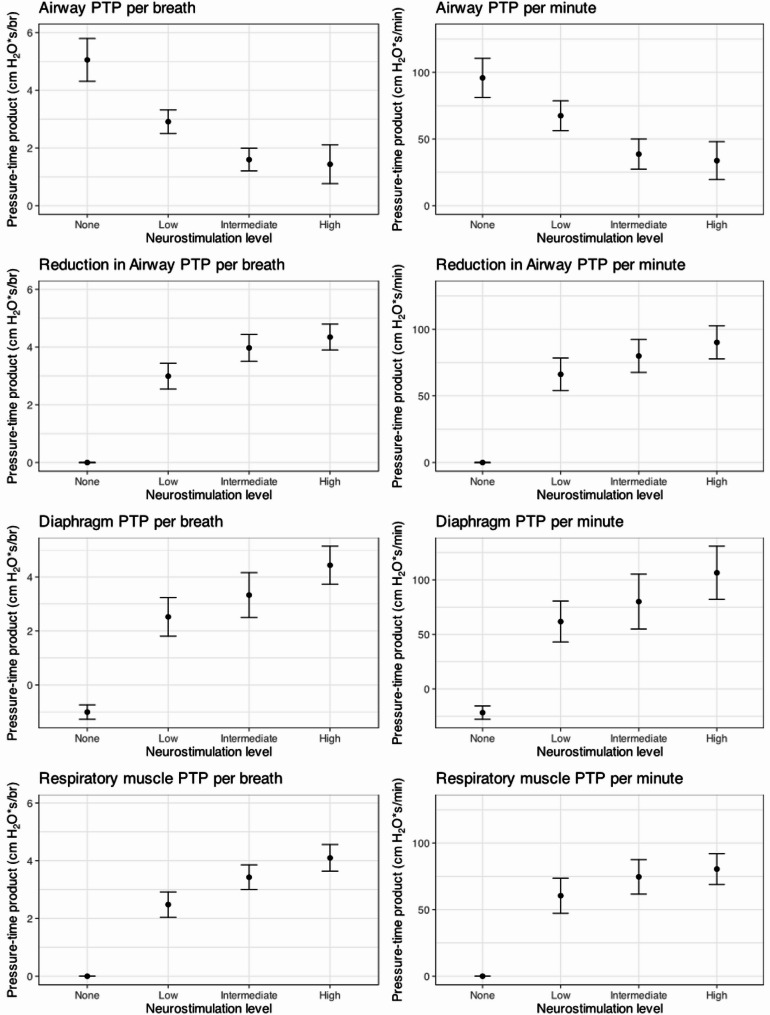 Figure 2
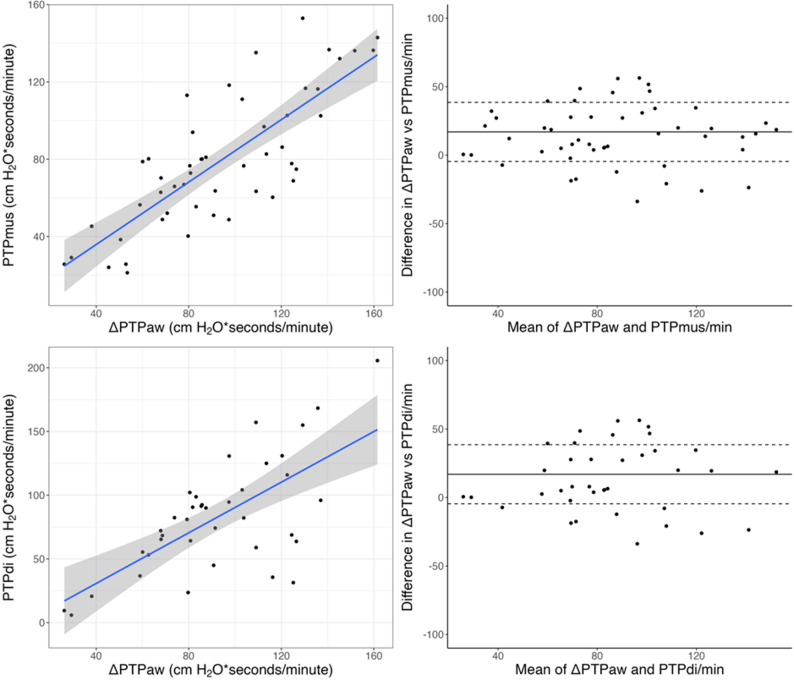 Figure 3
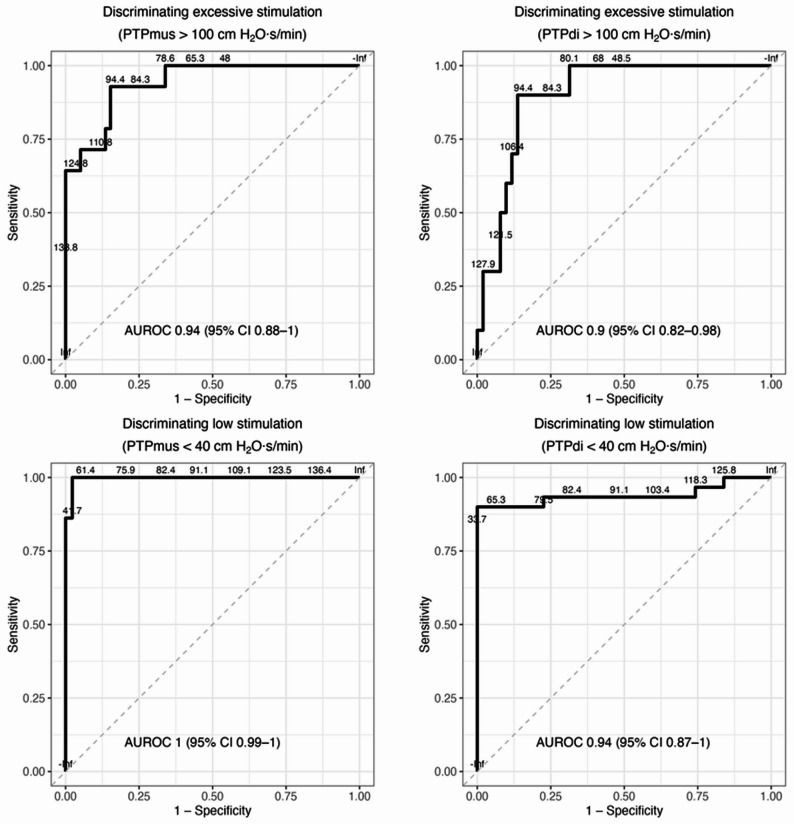 Figure 4
- —https://doi.org/10.13039/100013329National Sanitarium Association
Peer Reviews
No public reviews on file for this paper yet. If you reviewed it on a platform where reviews are public (OpenReview, ICLR, NeurIPS, ICML), you can paste yours below so the community can read it here.
Videos
No videos yet. Explain this paper in a talk, walkthrough, or lecture? Add one.
Taxonomy
TopicsRespiratory Support and Mechanisms · Neuroscience of respiration and sleep · Chronic Obstructive Pulmonary Disease (COPD) Research
Introduction
Mechanical ventilation (MV) is an essential life-sustaining therapy for patients with acute respiratory failure. However, it is not without harm. In addition to ventilator-induced lung injury due to excessive stress and strain [1], prolonged diaphragmatic inactivity during MV contributes to ventilator-induced diaphragmatic dysfunction [2, 3], which has been associated with delayed weaning, prolonged ventilation, and worse clinical outcomes [4, 5]. On the other hand, maintaining appropriate levels of diaphragm activity during MV is challenging, particularly in patients with severely impaired respiratory mechanics [6–9]. In this context, transvenous diaphragm neurostimulation (DNS) has emerged as a novel strategy to prevent diaphragm disuse by activating the diaphragm in synchrony with ventilator-delivered breaths [10–19].
The STIMULUS trial [20] recently demonstrated the feasibility, safety, and tolerability of delivering diaphragm neurostimulation-assisted ventilation (DNAV)—MV synchronized with continuous, on-demand diaphragm stimulation—in critically ill patients expected to require prolonged passive ventilation. While larger clinical trials are needed to evaluate the impact of DNAV on clinical outcomes, optimizing DNS dosing to achieve safe and effective diaphragmatic loading is essential for its clinical implementation [21]. Both insufficient and excessive diaphragmatic effort have been associated with diaphragm dysfunction and poor outcomes [4, 5, 22], underscoring the need for accurate methods to monitor and titrate diaphragmatic loading during DNAV.
The concept of using reductions in airway pressure to estimate inspiratory muscle effort has been well established in classical respiratory physiology. Early work by Marini and colleagues quantified the inspiratory workload by comparing airway and esophageal pressure changes during passive and assisted breaths in mechanically ventilated patients [23, 24], while Macklem et al. demonstrated optimization of respiratory muscle relaxation using similar pressure-based measurements [25]. Building upon this classical measurement approach, we reasoned that its application could be particularly appropriate in the context of DNAV, as diaphragm neurostimulation elicits a diaphragmatic contraction that produces pleural and airway pressure swings similar to those observed during spontaneous inspiration.
We hypothesized that the reduction in airway pressure during stimulated breaths, expressed as the difference in airway pressure-time product between passive non-stimulated and stimulated breaths during assist control volume-controlled mode (ΔPTPaw), could serve as a reliable, non-invasive surrogate for estimating diaphragmatic muscular loading. We tested this hypothesis in a secondary analysis of data collected in the STIMULUS trial. Portions of these results have been previously presented in abstract form [26].
Methods
Study design and setting
This study is a secondary analysis of data collected during the STIMULUS trial (NCT05465083), a phase I single-arm clinical trial conducted at a quaternary academic intensive care unit (Toronto General Hospital, Toronto, Canada) [20]. The trial evaluated the safety and feasibility of delivering continuous, on-demand DNAV in patients with acute respiratory failure. Regulatory approval was obtained from Health Canada, and ethical approval was granted by the University Health Network Research Ethics Board (22-5815) prior to study initiation. A total of 19 patients were enrolled and received DNAV. Neurostimulation was delivered using a specialized central venous catheter with embedded electrodes (Lungpacer^®^ AeroPace™ Protect System; Lungpacer Medical Inc., Vancouver, Canada), positioned in the superior vena cava. Details on the study population and methods have previously been reported in detail [20].
Experimental procedures
After initiation of DNAV, a nested, randomized cross-over physiological study was performed to assess the effects of varying levels of diaphragm neurostimulation. This assessment was conducted shortly after patients met criteria to initiate stimulation and successful electrode mapping had been confirmed.
DNS was delivered at four stimulation intensities: baseline (no stimulation; airway occlusion pressure, Pocc = 0 cm H₂O), and 3 levels of stimulation targeting Pocc values of − 5, − 10, and − 15 cm H₂O, respectively referred to as “low”, “intermediate”, and “high”. Each stimulation level was tested at two positive end-expiratory pressure (PEEP) levels (high and low), and each step was maintained for 10 min before data acquisition.
At each stimulation step, airway pressure (Paw), flow, esophageal pressure (Pes), and gastric pressure (Pga) were recorded using a signal acquisition system (FluxMed, MBMed, Buenos Aires, Argentina). Esophageal and gastric pressures were measured with a nasogastric catheter equipped with balloon sensors (NutriVent™, Mirandola, Italy). Transdiaphragmatic pressure (Pdi) was computed by subtraction of Pes from Pga (Pdi = Pga – Pes). The pressure generated by respiratory muscles (Pmus) was estimated by calculating the passive chest wall elastic recoil pressure using measured chest wall elastance and subtracting Pes from this value [27].
Pressure-time product (PTP) was calculated for Paw, Pdi, and Pmus at each stimulation step. For each variable, PTP per breath was defined as the area under the pressure-time curve during inspiration, reflecting the muscular effort generated for a single breath. PTP per minute was computed by multiplying PTP per breath by the respiratory rate (RR) at the corresponding stimulation step, thus estimating the cumulative diaphragmatic or respiratory muscle workload over time [28]. The change in airway pressure-time product (∆PTPaw) was defined as the difference between Paw-PTP measured during passive versus stimulated breaths (Fig. 1). Recordings were analyzed offline using custom software (Program for Advanced Analysis of Respiratory Mechanics [PADMER], Intellectual Property [IP]-protected; Barcelona, Spain). Additional methodological details are provided in the Online Supplement.
Fig. 1. Representative respiratory waveforms across increasing neurostimulation levels during DNAV. Representative examples from a single patient showing flow, airway pressure (Paw), esophageal pressure (Pes), gastric pressure (Pga), transdiaphragmatic pressure (Pdi), and estimated muscular pressure (Pmus) tracings at three levels of diaphragm neurostimulation—low (Pocc ≈ − 5 cm H₂O), intermediate (Pocc ≈ − 10 cm H₂O), and high (Pocc ≈ − 15 cm H₂O)— each compared against a preceding passive (non-stimulated) breath. Blue shaded areas represent the pressure-time products (PTP) for each variable. The pink shared area represents the reduction in airway PTP (∆PTPaw), defined as the area between Paw curves during passive and stimulated breaths. As stimulation intensity increases, larger reductions in Paw are observed, along with corresponding increases in Pmus and Pdi, indicating progressively greater diaphragmatic effort
Statistical analysis
Descriptive statistics are reported as means with standard deviations, medians with interquartile ranges, or counts with proportions, as appropriate. The association between ∆PTPaw and both PTPdi and PTPmus was evaluated using linear mixed-effects models. Agreement between ∆PTPaw and PTPdi or PTPmus was assessed using the Bland–Altman method, accounting for repeated measures. Linear mixed-effects models were computed to assess whether physiological factors—including lung resistance (Rlung, calculated as Δ(Paw–Pes)/inspiratory flow), lung elastance (EL, ΔPL/VT), abdominal elastance (Eab, ΔPga/VT), and insufflation time (Ti, duration of inspiratory flow)—as well as stimulation level modified the difference between ∆PTPaw and PTPdi, with patient included as a random intercept to account for within-subject correlation. To assess the discriminative performance of ∆PTPaw in detecting excessive or low diaphragmatic effort, receiver operating characteristic (ROC) curves were constructed, and the corresponding area under the curve (AUC) was calculated. Excessive effort was defined as PTPmus or PTPdi > 100 cm H₂O·s·min⁻¹, and low effort as < 40 cm H₂O·s·min⁻¹ [29].
All statistical analyses were performed using R (version 4.3.0; R Foundation for Statistical Computing, Vienna, Austria) and Python (version 3.12.1, Python Software Foundation, Wilmington, USA), with the following packages: pandas, NumPy, SciPy, and matplotlib.
Results
Study population
In the STIMULUS trial, 20 patients were enrolled and DNAV was initiated in 19. Among these, 16 underwent the nested titration study but only 12 had complete and analyzable respiratory waveform recordings. The remaining four patients were excluded due to non-interpretable waveform recordings resulting from signal acquisition issues. Baseline characteristics of the included patients are summarized in Table 1. Participants were predominantly male (75%), with a median age of 61 (IQR 48–64). Most were admitted to the ICU after pulmonary thromboendarterectomy (6, 50%) and had pre-existing lung disease at baseline (9, 75%). PaO_2_/FiO_2_ during passive ventilation (prior to stimulation) was median 283 (IQR 138–341), with normalized respiratory system elastance measuring 1.9 (IQR 1.6–2.4) cm H_2_O/(ml/kg). The majority of participants were receiving vasoactive support (82%).
Table 1. Baseline characteristics of the studied cohortCharacteristicDistribution (n = 12)Age (years)61 [48, 64]Sex: male9 (75%)Body mass index (kg/m^2^)26.4 [24.3, 33.4]Admission diagnosisGroup 1: Acute hypoxemic respiratory failure3 (25%)Bacterial pneumonia1 (8%)Viral pneumonia1 (8%)Aspiration pneumonia1 (8%)Group 2: Post pulmonary thrombo-endarterectomy6 (50%)Group 3: Post-lung transplantation3 (25%)Preexisting respiratory diseaseRestrictive lung disease3 (25%)Obstructive lung disease2 (17%)Chronic thromboembolic disease7 (58%)Other3 (25%)Mixed pathology (two or more of above)2 (17%)None1 (8%)Physiological characteristicsAPACHE II29 [24, 32]SOFA10 [10, 11]PaO_2_/FiO_2_ (mm Hg)284 [138, 342]Normalized respiratory system elastance(cm H_2_O/[mL/kg predicted body weight])1.9 [1.6, 2.4]Lactate (mmol/L)1.3 [1.0, 1.5]Ventilator settings at enrolmentMode of ventilationAssist control volume control12 (100%)Tidal volume (mL/kg predicted body weight)6.2 [5.9, 7.1]Respiratory rate (min^− 1^)20 [20, 23]Plateau pressure (cm H_2_O)17 [15, 21]Positive end-expiratory pressure (cm H_2_O)10 [7, 10]Clinical management at enrolmentNeuromuscular blockade infusing1 (8%)Inhaled nitric oxide1 (8%)New renal replacement therapy0 (0%)Extracorporeal membrane oxygenation0 (0%)Vasoactive agents infusing00 (0%)110 (82%)≥ 22 (8%)
Respiratory tracing quality
A total of 781 respiratory cycles were collected. Two independent reviewers (ACF and FPG) assessed the quality of each cycle. Of these, 494 cycles (63.3%) were classified as high-quality and included in the final analysis. Due to challenges in acquiring reliable gastric pressure signals, valid Pdi data were available for 209 cycles (from nine patients). Detailed tracing selection and quality assessment methodology is provided in the Online Supplement.
Diaphragmatic muscle loading during diaphragmatic neurostimulation
Progressive increases in DNS intensity—targeting occlusion pressures (Pocc) of − 5 cm H₂O (low), − 10 cm H₂O (intermediate), and − 15 cm H₂O (high)—were associated with corresponding increases in ∆PTPaw, PTPdi, PTPmus, and decrease in PTPaw (Fig. 2). In a minority of patients, the targeted occlusion pressure of − 15 cmH₂O was not fully achieved despite maximal allowable stimulation amplitude; however, all stimulated breaths remained within the predefined upper stimulation range and were included in the analysis.
Fig. 2. Diaphragmatic loading and airway pressure-time product across levels of diaphragm neurostimulation. Pressure-time product (PTP) values per breath (left panels) and per minute (right panels) for airway pressure (top row), reduction in airway pressure (second row), transdiaphragmatic pressure (third row), and respiratory muscle pressure (bottom row) across four neurostimulation intensities: none, low (Pocc − 5 cm H₂O), intermediate (Pocc − 10 cm H₂O), and high (Pocc − 15 cm H₂O)
Neurostimulation resulted in a dose-dependent increase in PTPdi and PTPmus, and a corresponding reduction in airway PTP, reflected by increasing ΔPTPaw (difference in aiway pressure-time product). The non-linear relationship between neurostimulation level and PTP is consistent with observed patterns in measured Pocc across stimulation steps. This likely reflects variability in the achieved inspiratory load at higher stimulation levels, rather than a loss of measurement accuracy. Values are presented as means with standard errors.
∆PTPaw per breath showed a strong correlation with both PTPdi per breath (β = 1.05; 95% CI, 0.92–1.17; marginal R² = 0.79; conditional R² = 0.85; p < 0.001) and PTPmus per breath (β = 0.83; 95% CI, 0.67–0.98; marginal R² = 0.52; conditional R² = 0.88; p < 0.001). Similarly, ∆PTPaw per minute correlated with PTPdi per minute (β = 0.87; 95% CI, 0.57–1.17; marginal R² = 0.33; conditional R² = 0.82; p < 0.001) and PTPmus per minute (β = 0.82; 95% CI, 0.76–0.89; marginal R² = 0.86; conditional R² = 0.92; p < 0.001) (Fig. 3). The association between ∆PTPaw and PTPdi remained consistent across PEEP levels, with no significant interaction observed per breath (p = 0.765) or per minute (p = 0.826).
Fig. 3. Correlation and agreement between ΔPTPaw and physiological markers of diaphragmatic effort. Relationship and agreement between the reduction in airway pressure-time product (ΔPTPaw) and respiratory muscle (PTPmus) or diaphragmatic (PTPdi) pressure-time products, all expressed in cm H₂O·s/min. Upper panels: ΔPTPaw vs. PTPmus. The left panel shows the correlation between ΔPTPaw and PTPmus per minute; each point represents a stimulation step from an individual patient. The blue line indicates the linear regression fit with 95% confidence interval (gray shading). ΔPTPaw showed a strong correlation with PTPmus (β = 0.82; 95% CI, 0.76–0.89; R² = 0.92; p < 0.001). The right panel displays the corresponding Bland–Altman plot, with the solid line indicating mean bias and dashed lines representing the 95% limits of agreement (bias of 20, limits − 5 to 39 cm H₂O·s/min)
Lower panels: ΔPTPaw vs. PTPdi, structured analogously. ΔPTPaw also correlated with PTPdi (β = 0.87; 95% CI, 0.57–1.17; R² = 0.82; p < 0.001), with good agreement (bias of 17, limits − 4 to 44 cm H₂O·s/min).
Bland-Altman analysis demonstrated good concordance between ∆PTPaw and physiological indices of diaphragmatic effort. ∆PTPaw/breath vs. PTPdi/breath was 1.0 cm H₂O·s/breath (limits of agreement: − 0.1 to 2.0 cm H₂O·s/breath), and vs. PTPmus/breath was 0.7 cm H₂O·s/breath (limits of agreement: − 0.2 to 1.7 cm H₂O·s/breath). At the minute level, ∆PTPaw/minute showed a bias of 20 cm H₂O·s/min vs. PTPdi/minute (limits: − 4 to 44 cm H₂O·s/min) and 17 cm H₂O·s/min vs. PTPmus/minute (limits: − 5 to 39 cm H₂O·s/min) (Fig. 3).
Reduction in airway pressure-time product to detect excessive or insufficient diaphragmatic muscle loading
∆PTPaw/min demonstrated excellent discriminative performance for detecting both low and excessive diaphragmatic effort. For low effort, defined as PTPdi/min < 40 cm H₂O·s/min and PTPdi/breath < 2 cm H₂O·s/breath [29], area under receiver operating characteristic curves (AUROCs) were 0.94 (95% CI, 0.87–1.00) and 0.84 (95% CI, 0.68–0.89), respectively. For the corresponding thresholds using PTPmus (PTPmus/min < 40 cm H₂O·s/min and PTPmus/breath < 2 cm H₂O·s/breath), AUROCs were 1.00 (95% CI, 0.99–1.00) and 0.99 (95% CI, 0.84–1.00), respectively.
For excessive effort, defined as PTPdi/min > 100 cm H₂O·s/min and PTPdi/breath > 4 cm H₂O·s/breath, AUROCs were 0.90 (95% CI, 0.82–0.98) and 0.89 (95% CI, 0.72–0.97), respectively. Discrimination was similarly high for PTPmus/min > 100 cm H₂O·s/min (AUROC = 0.94; 95% CI, 0.88–1.00) and PTPmus/breath > 4 cm H₂O·s/breath (AUROC = 0.86; 95% CI, 0.70–0.96) (Fig. 4).
Fig. 4. Discriminative performance of ΔPTPaw for identifying low and excessive diaphragmatic effort. Receiver operating characteristic (ROC) curves evaluating the ability of ΔPTPaw to discriminate between excessive (top panels) and low (bottom panels) respiratory effort, as assessed by respiratory muscle pressure-time product (PTPmus, left) and transdiaphragmatic pressure-time product (PTPdi, right). Excessive effort was defined as > 100 cm H₂O·s/min and low effort as < 40 cm H₂O·s/min. ΔPTPaw demonstrated excellent discriminative accuracy for both ends of the physiological spectrum, with area under the curve (AUROC) values ranging from 0.90 to 1.00
Determinants of bias between ΔPTPaw and measures of diaphragmatic effort
A longer insufflation time (Ti) was associated with a greater bias between PTPaw/breath and PTPdi/breath (β = 6.1 cm H₂O·s/breath per second; 95% CI, 0.9 to 11.3; p = 0.022), while higher lung resistance (RLung) showed a non-significant trend toward increased bias (β = − 0.2 cm H₂O·s/breath per cm H₂O·s/L; 95% CI, − 0.4 to 0.0; p = 0.095). None of the other predictors, including stimulation level, lung elastance (EL) or abdominal elastance (Eab), were associated with bias between ∆PTPaw and PTPdi.
In contrast, for the comparison between ΔPTPaw vs. PTPmus, higher RLung was the only significant predictor of increased bias (β = − 0.3 cm H₂O·s/breath per cm H₂O·s/L; 95% CI, − 0.4 to − 0.1; p = 0.001). No significant effects were observed for EL, Ti, stimulation level, or Eab (e-Table 1).
Discussion
In this physiological study nested within the STIMULUS trial, we demonstrate that ΔPTPaw, a non-invasive surrogate derived from standard ventilator signals, correlates strongly with both PTPdi and PTPmus and accurately discriminates low and excessive diaphragmatic loading during diaphragm neurostimulation. These findings suggest that ΔPTPaw may offer a practical and reliable method to monitor and titrate diaphragmatic loading in critically ill patients receiving DNAV during passive ventilation in a volume-cycled mode. Although the ‘dose’ of diaphragm neurostimulation is determined by both stimulation parameters (e.g., amplitude, frequency, and pulse duration) and the resulting diaphragmatic load, the present study focused specifically on the physiological output—diaphragmatic effort—as the clinically relevant target for monitoring.
Our findings align with classical respiratory physiology studies showing that reductions in airway pressure during inspiration can serve as a surrogate for respiratory muscle effort [25]. While this approach has been previously used to assess respiratory muscle relaxation and effort in different mechanical ventilation settings, its application in the context of DNAV is novel. The strong correlation observed between ΔPTPaw and both PTPdi and PTPmus supports the physiological validity of this classical measurement in a modern therapeutic application.
Although ΔPTPaw correlated well with both PTPdi and PTPmus, the association was notably stronger with PTPmus. This may be explained by the physiological basis of each measure. The drop in airway pressure during stimulated breaths reflects the decrease in pleural pressure generated by diaphragmatic contraction. PTPmus, which is derived from esophageal pressure (a surrogate for pleural pressure) plus the elastic recoil of the chest wall [27], more directly reflects changes in pleural pressure during inspiration. In contrast, PTPdi represents the pressure difference between the abdominal and thorax (Pga – Pes) and is influenced not only by diaphragm contraction but also by abdominal compliance and the degree of abdominal wall displacement during inspiration [30]. As a result, ΔPTPaw more closely mirrors PTPmus, which better reflects global pleural pressure dynamics, rather than PTPdi, which is more affected by trans-abdominal mechanics.
Several risks of diaphragm neurostimulation motivate the need for close monitoring. First, excess diaphragm contractions could contribute to increase lung stress and strain and injury. There is also a possible risk of load-induced diaphragm injury, particularly in the context of sarcolemmal hyperfragility and diaphragm myofibrillar hibernation [31, 32]. Excessive mechanical loading—especially when unopposed by accessory muscle recruitment—may pose a risk of diaphragmatic myotrauma [5]. Taken together, these observations underscore the need for careful titration of diaphragm stimulation to avoid excessive effort while preserving sufficient activity to prevent disuse.
We explored potential sources of bias in ΔPTPaw-based estimates. A longer insufflation time (Ti) was significantly associated with increased disagreement between ΔPTPaw and PTPdi. One possible explanation is that extended Ti allow for more sustained airway pressurization by the ventilator, reducing the relative drop in airway pressure during stimulated breaths and thereby underestimating diaphragmatic effort. Additionally, longer Ti may lead to activation of expiratory muscles toward the end of inspiration, which could reduce transdiaphragmatic pressure and thus PTPdi. Interestingly, this effect was not observed for PTPmus, possibly due to the more direct correspondence with pleural pressure dynamics. Additionally, higher lung resistance (Rlung) was significantly associated with greater bias between ΔPTPaw and PTPmus. This likely reflects the attenuation of pressure transmission across resistive airways, which may decouple airway pressure from actual pleural pressure changes. These findings suggest that ΔPTPaw may be less accurate under conditions of high Rlung or prolonged insufflation time, reinforcing the need for context-specific interpretation when using this surrogate in clinical settings. In our analysis, PEEP did not significantly influence the relationship between ΔPTPaw and diaphragmatic effort. Within the PEEP range used in this study, neurostimulation-induced diaphragmatic contraction appeared largely independent of PEEP level.
Although ΔPTPaw currently requires offline signal analysis, some commercially available ventilator monitoring systems and DNAV devices already incorporate automated detection of airway pressure-time product changes, which could facilitate real-time bedside application of this method in the future.
Limitations
This study has several limitations. First, the sample size was relatively small, and most participants were post-surgical patients, which may limit the generalizability of our findings to broader ICU populations with more severe or heterogeneous forms of respiratory failure.
Second, although a substantial number of cycles were analyzed—with 63% classified as adequate for analysis—over one-third were excluded due to signal artifacts or acquisition issues. To ensure internal validity, only artifact-free cycles with optimal signal quality were included, which may have reduced statistical power but strengthened the reliability of the observed correlations, especially the strong relationship between ΔPTPaw and PTPmus. Additionally, the validation against transdiaphragmatic pressure (Pdi) was limited by the availability of interpretable Pdi signals in only nine patients.
Third, the thresholds used to define low and excessive diaphragmatic effort were based on physiologic studies in healthy individuals and may not accurately reflect safe or optimal loading targets in critically ill patients. The long-term impact of different stimulation intensities—particularly in vulnerable muscle conditions—remains to be clarified.
Forth, the technique described is only valid during passive ventilation in assist-controlled volume-controlled mode. In pressure-targeted modes, elicited diaphragm contractions would increase tidal volume, so the magnitude of diaphragmatic pressure generation cannot be directly estimated. For this reason, volume-targeted ventilation may be preferable during DNAV to ensure constant tidal volume and permit monitoring of diaphragmatic loading.
Conclusion
Diaphragm neurostimulation exhibits a dose-response relationship with diaphragm contractility. ΔPTPaw is a reliable, non-invasive surrogate for monitoring diaphragm loading during DNAV under assist-controlled volume-controlled mode and may guide neurostimulation titration in mechanically ventilated patients.
Supplementary Information
Below is the link to the electronic supplementary material.
Supplementary Material 1.
The reference list from the paper itself. Each links out to its DOI / PubMed record.
- 1Hedenstierria G, Tokics L, Lundquist H, Andersson T, Strandberg A, Brismar B. Phrenic nerve stimulation during halothane anesthesia. Effects of atelectasis. Anesthesiology [Internet]. Anesthesiology; 1994 [cited 2025 Mar 4];80:751–60. 10.1097/00000542-199404000-0000610.1097/00000542-199404000-000068024128 · doi ↗ · pubmed ↗
- 2Rohrs EC, Bassi TG, Fernandez KC, Ornowska M, Nicholas M, Wittmann JC et al. Diaphragm neurostimulation during mechanical ventilation reduces atelectasis and transpulmonary plateau pressure, preserving lung homogeneity and [Formula: see text]/[Formula: see text]. J Appl Physiol (1985) [Internet]. J Appl Physiol (1985); 2021 [cited 2025 Mar 4];131:290–301. 10.1152/JAPPLPHYSIOL.00119.202110.1152/japplphysiol.00119.202134110233 · doi ↗ · pubmed ↗
- 3Rohrs EC, Bassi TG, Nicholas M, Wittmann J, Ornowska M, Fernandez KC et al. Negative-pressure-assisted ventilation lowers driving pressure and mechanical power in an ARDS model. J Appl Physiol (1985) [Internet]. J Appl Physiol (1985); 2022 [cited 2025 Mar 4];133:1237–49. 10.1152/JAPPLPHYSIOL.00486.202210.1152/japplphysiol.00486.2022 PMC 967840836227168 · doi ↗ · pubmed ↗
- 4Bassi TG, Rohrs EC, Fernandez MKC, Ornowska MM, Nicholas MM, Wittmann MJ et al. Diaphragm neurostimulation mitigates Ventilation-Associated brain injury in a preclinical acute respiratory distress syndrome Model. Crit care explor [Internet]. Crit Care Explor; 2022 [cited 2025 Mar 4];4:E 0820. 10.1097/CCE.000000000000082010.1097/CCE.0000000000000820 PMC 978897536601565 · doi ↗ · pubmed ↗
- 5Parfait M, Rohrs E, Joussellin V, Mayaux J, Decavèle M, Reynolds S et al. An initial investigation of diaphragm neurostimulation in patients with acute respiratory distress Syndrome. Anesthesiology [Internet]. Anesthesiology; 2024 [cited 2025 Nov 17];140:483–94. 10.1097/ALN.000000000000487310.1097/ALN.000000000000487338088791 · doi ↗ · pubmed ↗