Genome‐Wide Analysis of Tritipyrum HSFs and Functional Characterization of TtHSF97 for Salt Tolerance
Xianjiao Qin, Wenzhen Li, Ruoruo Wang, Jianxia Xu, Yanqing Ding, Kuiyin Li, Mingjian Ren

TL;DR
This study identifies 103 heat shock transcription factors in Tritipyrum, with TtHSF97 shown to improve salt tolerance in plants, offering a strategy for breeding crops that thrive in saline soils.
Contribution
The study identifies TtHSF97 as a key transcription factor that enhances salt tolerance in plants through heterologous overexpression in Arabidopsis.
Findings
103 TtHSF genes were identified and classified into three groups with conserved motifs.
TtHSF97 overexpression in Arabidopsis significantly improved salt tolerance and plant growth under stress.
733 genes were found to be positively correlated with TtHSF97, involved in stress responses and metabolism.
Abstract
Soil salinization is a major abiotic stress constraining global agricultural production. In this study, a genome‐wide analysis of the salt‐tolerant hybrid germplasm Tritipyrum identified 103 heat shock transcription factors (TtHSF) genes, which were classified into three major groups (A, B, and C) and shared conserved motifs. Transcriptome data and qRT‐PCR revealed that 29 of the TtHSF genes exhibited high expression levels in response to salt stress and recovery. Notably, TtHSF97, localized on Tel5E01T611500, exhibited significantly upregulated expression under salt stress. Subcellular localization confirmed that TtHSF97 is a nuclear‐enriched protein, consistent with its function as a transcription factor. Heterologous overexpression of TtHSF97 in Arabidopsis significantly enhanced salt tolerance of transgenic plants, enabling them to maintain a high leaf expansion rate and root length…
Genes, proteins, chemicals, diseases, species, mutations and cell lines named across the full text — each resolved to its canonical identifier and authoritative record.
Click any figure to enlarge with its caption.
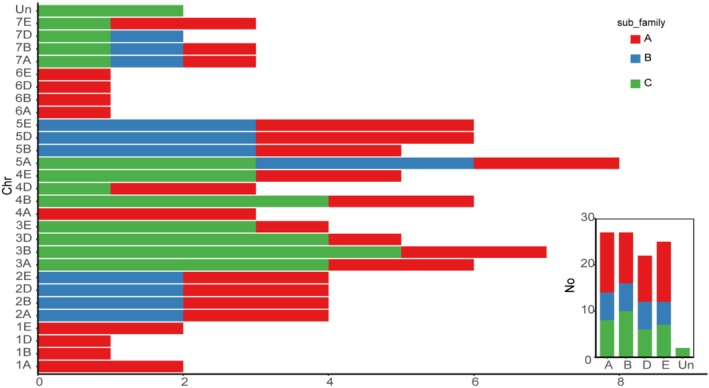 FIGURE 1
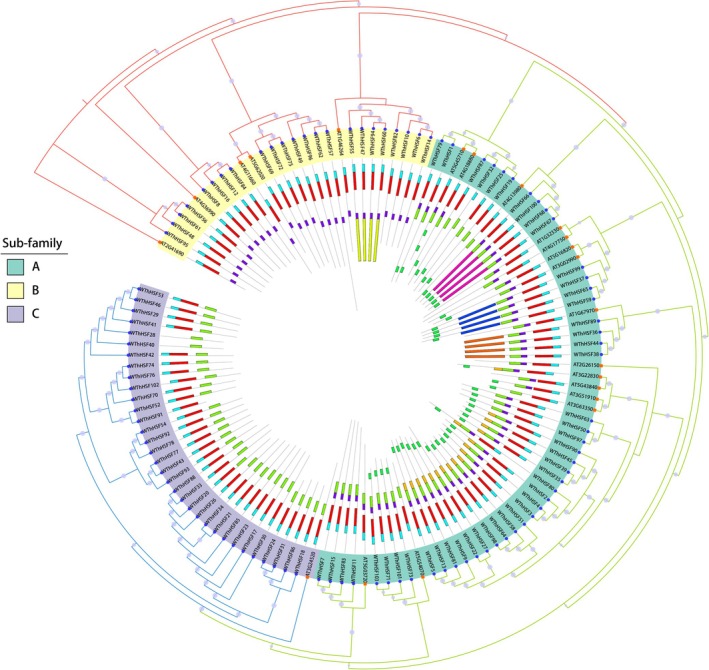 FIGURE 2
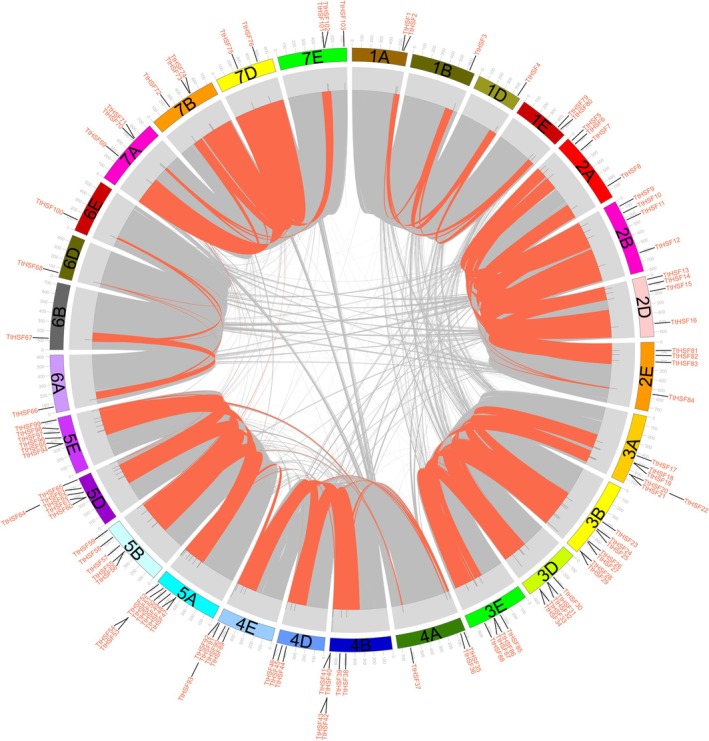 FIGURE 3
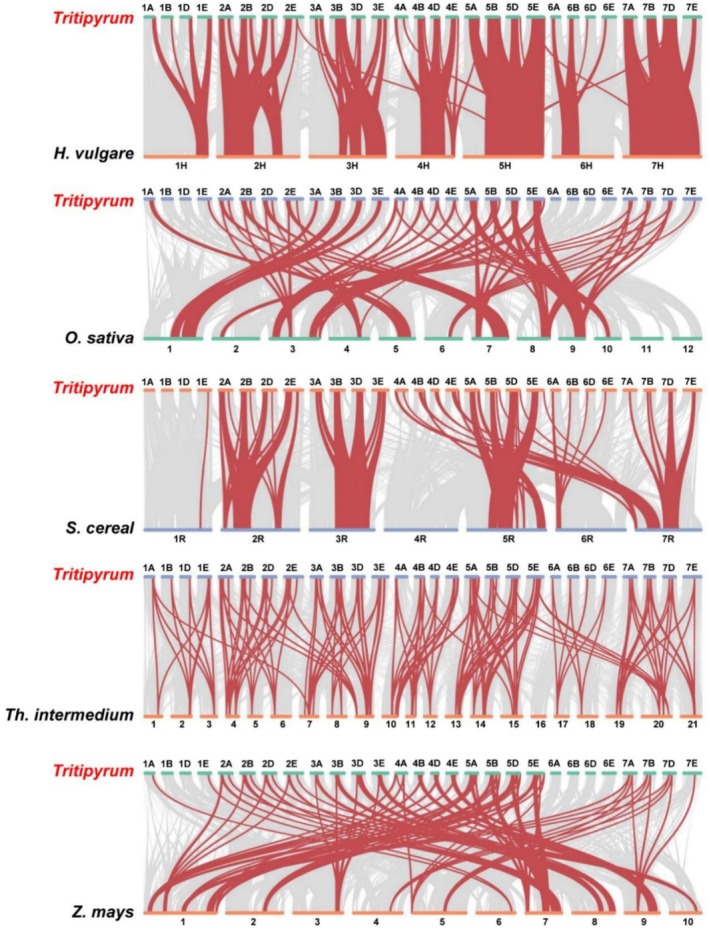 FIGURE 4
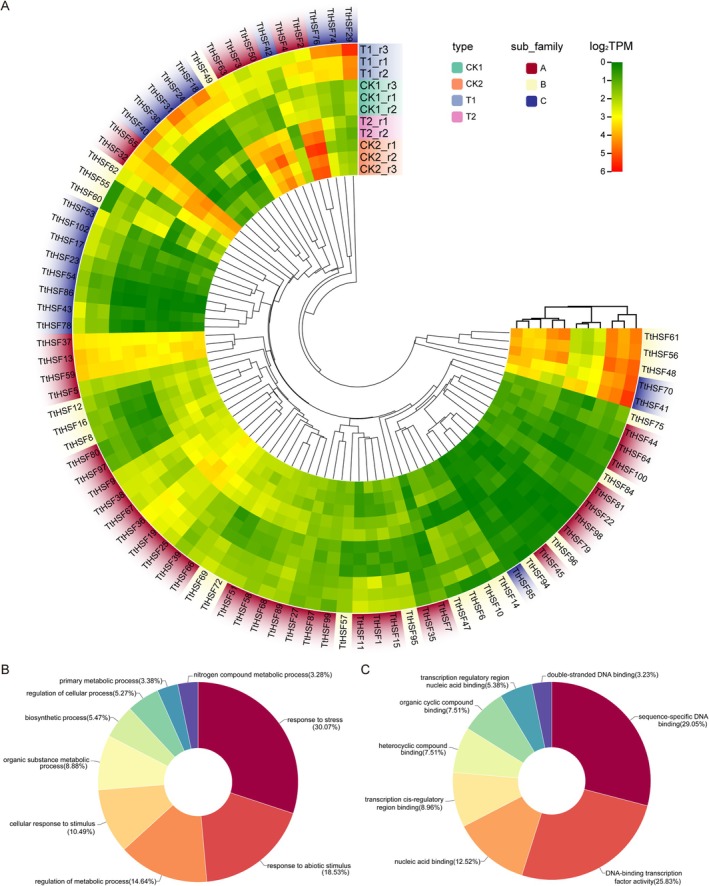 FIGURE 5
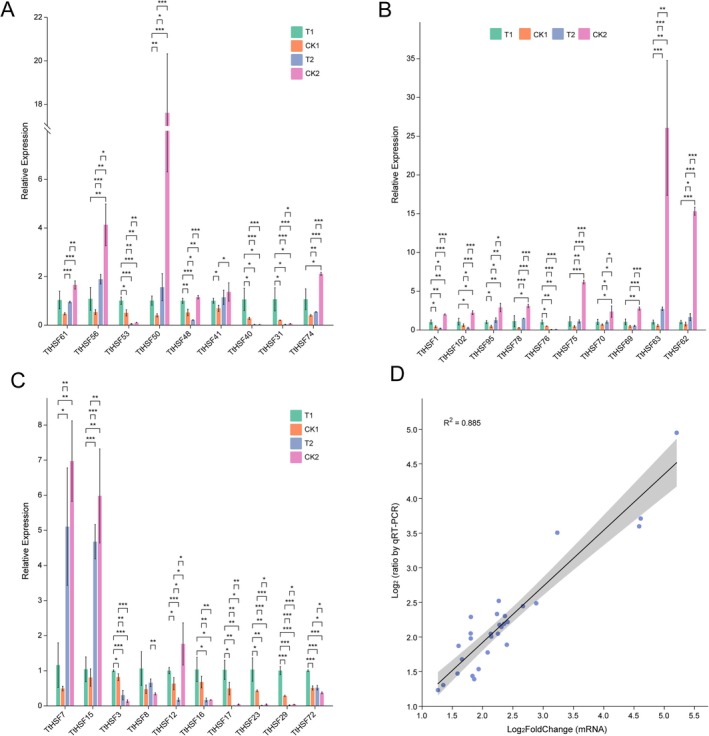 FIGURE 6
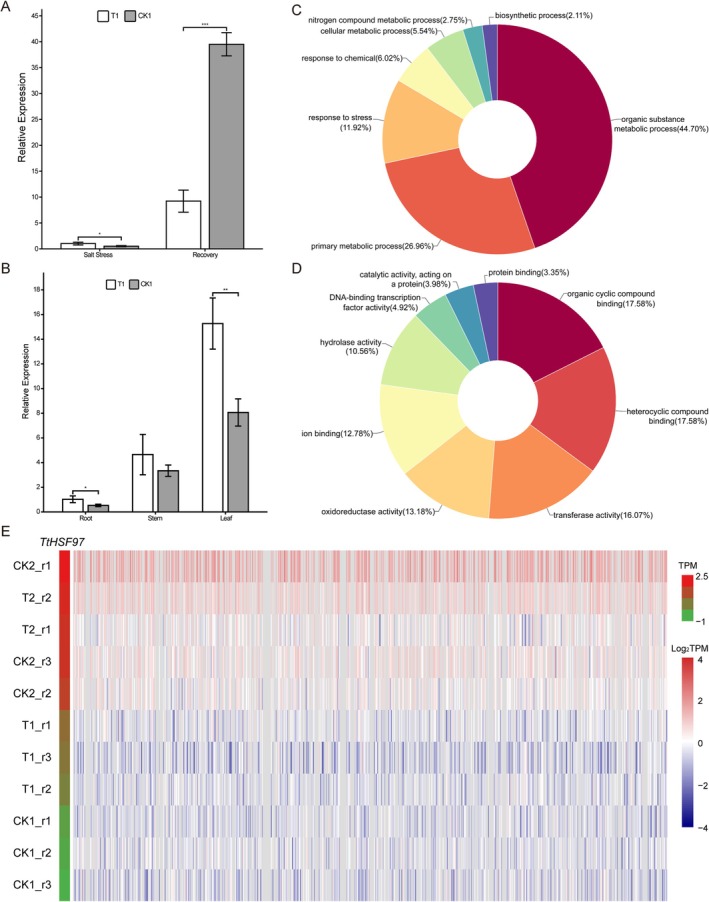 FIGURE 7
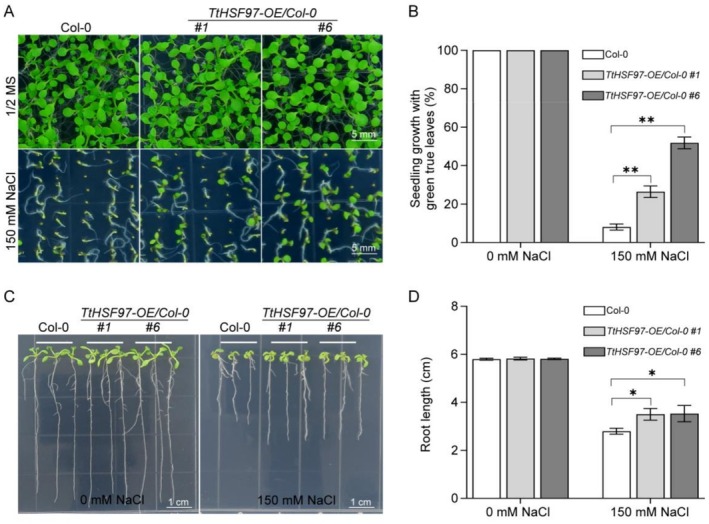 FIGURE 8
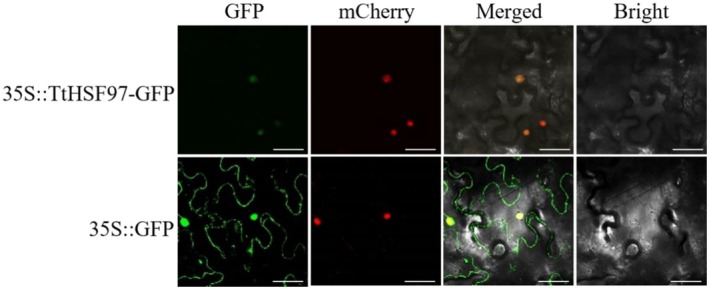 FIGURE 9
- —National Natural Science Foundation of China10.13039/501100001809
- —Guizhou key laboratory of biotechnology breeding for special minor cereals
- —Guizhou Provincial Basic Research Program(Natural Science)
Peer Reviews
No public reviews on file for this paper yet. If you reviewed it on a platform where reviews are public (OpenReview, ICLR, NeurIPS, ICML), you can paste yours below so the community can read it here.
Videos
No videos yet. Explain this paper in a talk, walkthrough, or lecture? Add one.
Taxonomy
TopicsPlant Stress Responses and Tolerance · Plant Molecular Biology Research · Plant Gene Expression Analysis
Introduction
1
Soil salinization represents one of the most severe abiotic challenges to global agriculture, affecting approximately 8.31 × 10^8^ hm^2^ worldwide, resulting in crop yield losses and incurring economic loss of up to $27.3 billion annually (Litalien and Zeeb 2020; Haj‐Amor et al. 2022; Muleta 2024). Saline soils disrupt plant growth via osmotic stress, ion toxicity, and oxidative damage induced by reactive oxygen species (ROS) that harm cellular components (Singh et al. 2022). In response, plants employ adaptive strategies spanning through morphological, physiological, and molecular scales to mitigate these effects (Yu et al. 2020; Tang et al. 2014; Wang et al. 2024; Segarra‐Medina et al. 2025). Notably, exploiting and utilizing salt‐tolerant germplasm remains the core approach to enhancing crop salt tolerance (Xu et al. 2017; Kumar et al. 2022; Yao et al. 2025). Central to orchestrating these complex salt tolerance responses is transcriptional reprogramming mediated by specific transcription factor families (Liang et al. 2018). Among these, Heat Shock Factors (HSFs) have emerged as pivotal regulators due to their indispensable roles in plant responses to environmental stresses.
HSFs facilitate plant adaptation to and defense against adverse environments by modulating the expression of a suite of stress‐responsive genes (Albihlal et al. 2018; Zang et al. 2019; Bakery et al. 2024). Studies have revealed that plant HSFs exhibit considerable variation in sequence size but share common structural features, which can be categorized into the following key conserved DNA binding domain and are phylogenetically categorized into three distinct classes (A, B, and C) (Döring et al. 2000; Treuter et al. 1993; Guo et al. 2016). Class A HSFs are primarily responsible for transcriptional activation, while class B and C HSFs are generally believed to lack this function (von Koskull‐Döring et al. 2007). HSFs exert their function by binding to heat shock elements (HSEs; 5′‐nGAAn‐3′) in target gene promoters, forming transcriptional complexes that drive heat shock protein (HSP) or other target genes' expression (Hu et al. 2015; Lin et al. 2011).
Initially identified in tomato under heat stress (Scharf et al. 1990), HSFs have been linked to a wide range of stress responses, including high and low temperatures, salinity, drought, light exposure, and disease. Most studies have focused on their role in thermal stress. In Arabidopsis, HSF members in class A are crucial in mediating the plant's response to heat stress (Bi et al. 2022; Ogawa et al. 2007), with specific subclass members, such as HSFA1d and HsfA1e, orchestrating the expression of downstream factors like HsfA2, thereby enhancing tolerance to combined high‐light and heat‐stress conditions (Nishizawa‐Yokoi et al. 2011). AtHSFA6a, AtHSFA6b, AtHSFA9, and AtHSFC1 are markedly upregulated (> 40‐fold for AtHSFC1) under low‐temperature stress (Wang et al. 2024). Beyond temperature extremes, HSFs also exhibit broad functional diversity in stress adaptation. Expression profiling in Arabidopsis reveals that specific HSFs are significantly induced by distinct abiotic stresses. The expression of certain HSF genes in Arabidopsis was elevated, with AtHSFA6a expression showing a 146‐fold increase compared to the control under salt stress (Miller and Mittler 2006). Arabidopsis transgenic plants overexpressing the tomato SlHsfA3 gene display enhanced thermotolerance but exhibit suppressed seed germination rates under salt stress, indicating a stress‐specific, potentially negative, regulatory role (Li et al. 2013). Conversely, AtHSFA7b functions as a positive regulator within the salt stress response pathway. It transcriptionally activates key components of the salt overly sensitive (SOS) signaling cascade–AtSOS1, AtSOS2, and AtSOS3–promoting cellular ion homeostasis and consequently enhancing salinity tolerance (Zang et al. 2019).
T. aestivum is moderately salt‐tolerant, outperforming rice ( Oryza sativa ) but lagging behind barley ( Hordeum vulgare ). Th. elongatum is closely related to T. aestivum and possesses the remarkable ability to thrive in salt concentrations akin to those found in seawater. The octoploid Tritipyrum, derived from intergeneric crosses between T. aestivum (AABBDD) and Th. elongatum (EE), serves as a significant source of germplasm for transferring salt tolerance genes from Th. elongatum into T. aestivum . The complete genome sequences available for both parents enable systematic dissection of stress‐responsive gene families, including HSFs (Mayer et al. 2014; Wang et al. 2020). However, despite the critical functions of HSFs in plant stress resistance and the significant value of Tritipyrum as a salt‐tolerant germplasm resource, there remains a clear gap in the comprehensive characterization of the HSF family in Tritipyrum (e.g., member composition, evolutionary relationships). This gap not only hinders in‐depth understanding of the genetic basis of salt tolerance in Tritipyrum but also becomes a key bottleneck restricting the efficient transfer of its salt tolerance genes to common wheat, thereby impeding efforts to enhance global agricultural production on saline‐alkali lands.
This study aimed to determine whether specific HSF genes in Tritipyrum contribute to enhanced salt tolerance by regulating ion homeostasis and stress signaling through regulatory networks. To this end, the genomic structural features, chromosomal locations, gene duplications, and evolutionary divergence of the HSF gene family in Tritipyrum were examined. Subsequently, the expression profiles of 29 TtHSF genes induced by salt stress were analyzed. Pearson correlation analyses and expression levels of TtHSF97 during both salt stress and recovery phases were determined. Then subcellular localization and heterologous overexpression assays in Arabidopsis assessed its role in salt tolerance. These insights will advance our understanding of HSF‐mediated salt tolerance mechanisms and inform molecular breeding strategies for enhancing crop resilience in saline environments.
Materials and Methods
2
Plant Material
2.1
Tritipyrum, a cross bred octoploid, integrates the A, B, and D genomes of T. aestivum with the E genome of Th. elongatum. The salt‐tolerant Tritipyrum line ‘Y1805’, a stable progeny from a wide cross between T. aestivum and Th. elongatum, was used in this study (Tian et al. 2024). Protein and nucleic acid sequences from Tritipyrum, utilized for identifying HSF genes, were retrieved from the genome databases of T. aestivum and Th. elongatum (http://plants.ensembl.org, Project number: PRJNA361927 and PRJCA002191). Comparative genomic data from Arabidopsis, Hordeum vulgare , Oryza sativa , Zea mays , and Thinopyrum intermedium via Phytozome 13 (https://phytozome‐next.jgi.doe.gov/), while S. cereale genome sequences were retrieved from the China National GeneBank Database (https://ngdc.cncb.ac.cn). Publicly available transcriptome data were analyzed, accessible at NCBI BioProject (https://www.ncbi.nlm.nih.gov/bioproject/PRJNA769794), with an Accession number of PRJNA769794.
Identification of the
HSF Genes in Tritipyrum
2.2
The consensus protein sequences for the HSF hidden Markov model (HMM) (PF00447) were retrieved from the Pfam database (http://www.pfam.sanger.ac.uk/). TtHSF protein candidates were identified using HMMER3.0 with default settings, and a threshold value of 0.01 was applied for elimination. Additionally, a search library was created from 21 previously reported AtHSF sequences, which were sourced from the UniProt database (www.uniprot.org). By employing the published sequences of HSF proteins from Arabidopsis and their corresponding HSF domain as query sequences, we conducted a search for TtHSF proteins using the BLASTP algorithm. After removing duplicates, candidate sequences were validated using the Pfam database and the SMART tool (http://smart.embl‐heidelberg.de/; Letunic et al. 2012). The physicochemical properties of the identified TtHSF genes were analyzed using ExPASy (http://web.expasy.org/protparam/).
Phylogenetic Analyses and Conserved Motif Determination
2.3
To investigate the evolutionary relationships of TtHSF genes, Arabidopsis HSF protein sequences were retrieved from UniProt (https://www.uniprot.org). Amino acid sequences of identified TtHSF genes were aligned using ClustalX v2.0. Phylogenetic trees were constructed for Tritipyrum and Arabidopsis using the Neighbor‐Joining method with the Poisson model and 1000 bootstrap replicates in MEGA software. Conserved motifs in TtHSF proteins were identified using the MEME Suite (https://meme‐suite.org/meme/) with motif widths set between 6 and 200 and a maximum of 10 motifs. Phylogenetic trees were visualized and annotated using FigTree v1.4.4 and iTOL (https://itol.embl.de/).
Chromosomal Distribution and Gene Duplication of the
TtHSF Genes
2.4
The chromosomal locations of TtHSF genes to the chromosomes of Tritipyrum were mapped using the approach described by Liu et al. (2014). Gene duplication events were analyzed with the MCScanX toolkit v1.0 using default parameters (Buchfink et al. 2015). All‐versus‐all protein sequence comparisons required for MCScanX were performed using DIAMOND v0.8.25 with parameters ‐max‐target‐seqs 5 and ‐e value 0.00001.
Tritipyrum Growth Conditions and Stress Treatments
2.5
Seeds of Tritipyrum ‘Y1805’ were germinated in a controlled chamber at 75% relative humidity with a 20°C/15°C light/dark cycle. Seedlings were cultivated in 1/2 Hoagland's solution on a floating board under a 16/8‐h light/dark cycle, 400 μmol m^−2^ s^−1^ irradiance, and consistent temperature and humidity conditions. The nutrient solution was refreshed three times weekly. On day 14 (two‐leaf stage), salt stress was induced using 1/2 Hoagland's solution with 250 mM NaCl. Root, stem, and leaf samples of uniform size from Tritipyrum (T_1_) were collected 5 h after exposure to salt stress. After 24 h of stress, plants were transferred to 1/2 Hoagland's solution without NaCl, and a second sample (T_2_) was collected 1 h after recovery. Control groups (CK_1_ and CK_2_) were maintained in 1/2 Hoagland's solution without NaCl. Expression level samples were snap‐frozen in liquid nitrogen and stored at −80°C. Each sample pooled at least ten seedlings from three biological replicates.
Expression Analysis and qRT‐PCR Validation of
HSF Genes Under Salt Stresses and Recovery
2.6
RNA‐Seq datasets were preprocessed using fastp v0.2 to remove adaptor contamination, low‐quality bases, and undetermined bases with default parameters. High‐quality reads were aligned to the combined genomes of T. aestivum v2.0 and Th. elongatum v1.0 using Bowtie v2.2.3 and HISAT v2.2.0. Read counts for Tritipyrum HSF genes were quantified using FeatureCounts v1.5.1 (Liao et al. 2014). Expression levels, calculated as transcripts per kilobase million (TPM), were log‐transformed and visualized using the R Circlize package (https://cran.r‐project.org/web/packages/circlize.html). Functional gene annotation was performed through GO annotation by mapping GO and KEGG terms using the BLAST2GO tool (http://blast2go.com/b2ghome/about) with an e‐value threshold of 10^−6^. qRT‐PCR primers were designed using Primer v5.0 (Table S2). The Actin gene served as the internal control, consistently expressed across growth stages and tissues. Expression levels were determined using the 2^−ΔΔCt^ method with three technical replicates from three biological replicates.
Vector Construction and Agrobacterium‐Mediated Transformation in Arabidopsis
2.7
The coding sequence (CDS) of TtHSF97 was amplified from Y1805 seedling cDNA using gene‐specific primers TtHSF97‐CDS‐XbaI (GCTCTAGAGCATGGACCCCTTCCACGGC) and TtHSF97‐CDS‐KpnI (GGGGTACCCCTCACTGGTGGCTGTGGGGC). The resulting PCR product was digested with XbaI and KpnI restriction enzymes and ligated into the similarly digested pCMBIA3301 vector to construct the overexpression vector pCMBIA3301‐TtHSF97. This recombinant plasmid was introduced into Arabidopsis ecotype Col‐0 via Agrobacterium tumefaciens strain EHA105. Transgenic T_1_ seeds were surface‐sown on half‐strength MS medium supplemented with 15 mg·L^−1^ Basta for antibiotic selection. Resistant seedlings exhibiting true leaf development and root formation were transplanted and propagated to the T_3_ generation to obtain homozygous transgenic lines. TtHSF97 expression levels were quantified by qRT‐PCR. Two independent transgenic lines with the highest expression levels were selected for subsequent functional studies.
Salt Stress Tolerance Phenotyping During Early Development in Arabidopsis
2.8
Seeds of Col‐0 and two TtHSF97‐overexpressing lines (#1 and #6) were divided into two groups: a control group grown under standard conditions and a salt‐stress group sown on 1/2 MS solid medium supplemented with 150 mM NaCl. All seeds were in a controlled‐environment growth chamber (25°C, 60% RH, 16/8 h light/dark cycle). On day 14, the green true leaves expansion rate (%) was quantified using the formula: (Number of seedlings with fully expanded true leaves/Total seedlings per line) × 100%. At the same time, seeds were plated on 1/2 MS medium (normal) for 1 week and then plated on 1/2 MS or 1/2 MS medium containing 150 mM NaCl for 1 week for comparing the root length. Three biological replicates were performed per genotype‐treatment combination, with each replicate containing ≥ 50 seeds randomized across plates.
Subcellular Localization of TtHSF Protein
2.9
The open reading frame (ORF) of TtHSF97 was amplified from a Y1805 seedling cDNA library using gene‐specific primers TtHSF97‐GFP‐F (CTCAAGCTTGGATCCATGGACCCCTTCCACGGC), and TtHSF97‐GFP‐R (GCTCACCATACTAGTCTGGTGGCTGTGGGGC). The resulting PCR product was digested and inserted into the same sites in the pHB plasmid (Mao et al. 2005) to generate the recombinant construct 2 × 35S::TtHSF97‐CDS‐GFP. This plasmid was subsequently transformed into A. tumefaciens strain GV3101 using the freeze–thaw method (Weigel and Glazebrook 2006). Bacterial cultures were prepared for infiltration by resuspending cells in an induction buffer. For transient expression, 1 mL of the bacterial suspension was pressure‐infiltrated into the abaxial epidermis of Nicotiana benthamiana leaves using a needleless syringe, with infiltrated zones clearly marked. After 48 h of low‐light incubation, GFP fluorescence was visualized and imaged using a laser scanning confocal microscope (Leica TCS SP5, Germany). For confocal imaging, GFP was excited at 488 nm and emission was collected at 507 nm, while mCherry was excited at 543 nm with emission collected at 568 nm. The subcellular localization assay was performed in three independent biological replicates. For each replicate, at least 100 cells were observed per field, and consistent localization patterns were obtained across all repeats, confirming good experimental reproducibility. Control assays were performed in parallel using A. tumefaciens transformed with the empty pHB vector.
Statistical Analysis
2.10
The study data were analyzed using analysis of variance (ANOVA) with SPSS software (IBM Corporation, version 28.0). The least significant difference (LSD) test was applied to compare mean values at a significance threshold of 0.05. Histograms were generated using Origin 8.0 (OriginLab Corporation, Northampton, Massachusetts, USA).
Results
3
Identification of the
TtHSF Genes in Tritipyrum
3.1
After removing duplicated sequences, 103 HSF genes were identified in the Tritipyrum genome using both the HMM and BLASTp approaches in this study, and were renumbered according to their positions on Tritipyrum chromosomes (Table S1). The analysis revealed that the 103 identified HSF genes in Tritipyrum were predominantly distributed in the A and B subgenomes (Figure 1), encoding proteins ranging from 145 to 569 amino acids in length (e.g., Tel4E01T582800.1 to TraesCS5B02G315600.1), and from 16.6 to 59.75 kDa in molecular weight (e.g., Tel4E01T582800.1 to TraesCS5B02G315600.1). The predicted TtHSF proteins exhibited considerable variation in both length and molecular weight (MW). The isoelectric points (PIs) of the proteins varied from 4.51 (Tel7E01T619800.1) to 9.97 (TraesCS5B02G236400.1; Table S1).
Chromosomal and subgenomes distribution of TtHSF genes in Tritipyrum.
Phylogenetic Analysis, and Motif Composition of the TtHSFs
3.2
To explore the evolutionary relationships and classify the HSF family in Tritipyrum, 124 potential HSF proteins identified in Arabidopsis and Tritipyrum were employed to construct a phylogenetic tree (Figure 2). Based on the primary amino acid sequence features and the classification of AtHSFs, the TtHSF family members were classified into three major groups. Group A, the largest subfamily, contained 47 proteins, whereas the smallest, Group B, comprised only 23 proteins. Most TtHSF proteins within the same group shared conserved motifs (Figures 2 and S1). Furthermore, the distribution of conserved amino acids within the HSF domains of Tritipyrum closely resembled that of Arabidopsis, suggesting that HSFs have been conserved throughout plant evolution. The factors of the C subfamily were highly conserved between Tritipyrum and Arabidopsis. Subgroup B displayed greater variation than subgroup C. Tritipyrum and Arabidopsis displayed a smaller genetic divergence between A and C (Figure 2). Genetic distance analysis within and between HSF subfamilies further supported this phylogenetic classification (Figure S2).
Phylogenetic relationships of the HSF proteins from Tritipyrum and Arabidopsis.
Chromosomal Distribution, Gene Duplication and Synteny Analysis of the
TtHSFs
3.3
Out of the 103 TtHSF genes, 101 were mapped to 28 chromosomes, while only TtHSF77 and TtHSF78 were excluded from the chromosome localization map due to their placement on scaffolds (Table S1, Figure 3). Most TtHSF genes were distributed across the third (21.3%) and fifth (24.3%) homologous clusters, whereas fewer were found in the first (5.8%) and sixth (3.9%) homologous groups (Table S1, Figures 1 and 3). Based on their chromosomal positions, most TtHSF genes were situated towards the chromosomal ends, with only a few near the center (Figure 3). The previous results indicated that the distribution of plant HSF genes across chromosomes was non‐random and uneven. Furthermore, an analysis of gene duplication showed that TtHSF genes experienced tandem duplications, with 12 pairs of tandemly duplicated genes identified (Figure 3). This indicates that certain genes have multiple copies, likely resulting from several rounds of replication within the T. aestivum genome. The majority of homologous genes are distributed within the same homologous groups, with only a few located in the fourth, fifth, and seventh groups, aligning with the natural translocations during the development and evolution of T. aestivum .
Distribution, duplication, and synteny analysis of TtHSF genes in Tritipyrum. The collinear correlations of TtHSF genes in Tritipyrum genomes are visualized using a Circos plot. Tritipyrum chromosomes are color‐coded according to their inferred ancestral origins, following established conventions. In the central part of the plot, the positions of annotation genes across all 28 Tritipyrum chromosomes are displayed, with 101 TtHSF genes highlighted in color.
Evolutionary Analysis of the
HSF Families in Several Different Species
3.4
To further deduce the evolutionary ties between HSF gene family members in Tritipyrum, H. vulgare , O. sativa , S. cereale , Th. intermedium, and Z. mays , the syntenic relationships between the six species were investigated (Figure 4). 102 TtHSF genes shared syntenic connections with those of Th. intermedium, followed by Z. mays (53), S. cereale (50), O. sativa (45), and H. vulgare (44) (Figure 4). Collinear pairs were identified between Tritipyrum and the other five species, indicating that these orthologous pairs likely predated the ancestral divergence event. Additionally, HSF collinear gene pairs found between Tritipyrum and H. vulgare were anchored to the highly conserved syntenic blocks, which encompassed over 500 collinear loci. Comparable syntenic conservation was observed between Tritipyrum and S. cereale , potentially reflecting their shared evolutionary trajectory among the six plant species. Significantly, multiple TtHSF genes were associated with at least three syntenic gene pairs, implying a potentially key role for these genes in the evolutionary diversification of the HSF gene family. These findings support high conservation within the TtHSF gene family and indicate greater phylogenetic proximity to * Z. mays HSFs* than to those of H. vulgare . Collectively, these data suggest that the TtHSF genes likely originated from a monophyletic ancestor within the monocotyledon lineage.
Synteny analyses of the HSF genes between Tritipyrum and five representative plant species. Background lines indicate inter‐genomic collinear blocks within Tritipyrum and other plant genomes, while red lines highlight syntenic TtHSF gene pairs.
Expression of
TtHSF Genes Under Salt Stresses and Recovery
3.5
To evaluate transcriptional dynamics of TtHSF gene under varying salt regimens, we profiled transcript abundances of all 103 TtHSF genes across salt stress conditions and post‐stress recovery phases. Among these, 84 TtHSF genes were found to be expressed in all 11 samples (TPM > 0), with 41 exhibiting constitutive expression. Hierarchical clustering revealed no significant association between gene subfamily classification and expression responsiveness to salt stress or recovery treatments (Figure 5A). Nineteen TtHSF genes were not detected in any of the samples, implying that they could be pseudogenes or stress‐nonresponsive loci. Gene Ontology (GO) annotation of the 84 expressed genes enriched biological processes (BP) including response to stress, response to abiotic stimulus, regulation of metabolic process, and cellular response to stimulus, along with molecular functions (MF) such as sequence‐specific DNA binding, transcription factor activity, nucleic acid binding, cis‐regulatory region binding, and binding of heterocyclic compounds (Figure 5B,C). To further confirm the accuracy of the transcriptome data, we selected 29 TtHSF genes with differential expression (|log_2_FoldChange| > 1) across treatments for qRT‐PCR confirmation using gene‐specific primers (Table S2). The results from qRT‐PCR and transcriptome data of the selected genes showed a high degree of correlation (r ^ 2 ^ = 0.885; Figure 6A–C), confirming the validity of our transcriptomic analysis (Figure 6D).
Expression patterns and functional annotation of TtHSF genes under salt stress and recovery treatment. (A) Hierarchical clustering of 84 expressed TtHSF genes across 11 samples including salt stress and recovery treatment. Colored branches indicate expression subclusters with no significant correlation to gene subfamilies. (B and C) The Enriched BP (B) and MF (C) from GO analysis.
*Expression analysis and correlation of TtHSF genes in response to salt stress. (A–C) Expression analysis of 29 TtHSF genes across 11 samples using qRT‐PCR. Gene expression levels were normalized to the β‐actin gene, and vertical bars represent the standard deviation. (D) Correlation analysis between qRT‐PCR and transcriptional data for the 29 up‐regulated genes. Expression values are presented as the log₂ ratio (salt stress or recovery treatment vs. CK treatment). The coefficient of determination (r 2) is shown in the figure. All qRT‐PCR experiments were performed in three biological replicates. *p < 0.05; **p < 0.01; **p < 0.001.
Functional Characterization of
TtHSF97 in Salt Stress Response
3.6
Previous studies demonstrated that overexpression of AtHSFA2 (AT2G26150) confers enhanced tolerance to salt, osmotic, and hypoxic stresses. Similarly, AtHSFA7b activates ROS‐scavenging genes, reducing oxidative damage and improving salinity tolerance, which in turn improved the plant's salt tolerance. The TtHSF97 gene (Tel5E01T611500) from the Tritipyrum HSF gene family, positioned on the same branch of the evolutionary tree with AtHSFA2 and AtHSFA7b (Figure 2), was upregulated under salt stress and recovery treatment (Figure 5). To explore the spatial and temporal expression patterns of TtHSF97, qRT‐PCR analysis was conducted to assess its expression levels in roots under salt stress and recovery conditions, as well as in stems and leaves. Under salt stress, the expression level of TtHSF97 in roots was significantly higher than that of the control, showing a 1.93‐fold increase (p < 0.05) (Figure 7A). These findings were in line with the transcriptome data mentioned earlier. Moreover, the relative expression level of TtHSF97 was highest in the leaves of ‘Y1805’ under salt stress, followed by the stems and roots (Figure 7B). Under salt stress, the expression level of TtHSF97 in the roots, stems, and leaves was higher than that in the control group. Specifically, the expression of TtHSF97 in the roots increased by 0.78‐fold, which was significantly higher than that of the control (p < 0.05), while in the leaves, it increased by 1.12‐fold, showing a highly significant difference compared to the control (p < 0.01).
Expression patterns and correlation of TtHSF97. (A) Relative expression levels of TtHSF97 in roots under salt stress and recovery conditions. Asterisks indicate significant differential expression vs. control (LSD test, p < 0.05). (B) Relative expression levels of TtHSF97 in roots, stems, and leaves under salt stress (LSD test, p < 0.05). (C, D) Gene Ontology (GO) analysis of 733 genes positively correlated with TtHSF97 expression, including biological process (BP; C) and molecular function (MF; D) categories. (E) A total of 733 genes with a high positive correlation (R > 0.9) to TtHSF97 expression.
To investigate the biological processes of TtHSF97 under salt stress and recovery treatment, a Pearson correlation analysis was conducted between TtHSF97 and other genes within the transcriptome data. The analysis revealed that 733 genes (R > 0.9) exhibited a positive correlation with TtHSF97 expression. This supports the potential role of TtHSF97 in regulating stress‐responsive genes. All of these genes showed high expression levels in the T_2_ samples (Figure 7E). Gene ontology (GO) analysis of these genes highlighted key BP and MF of GO annotation including organic substance metabolism, primary metabolism, stress response, chemical response, and cellular metabolic processes (Figure 7C,D). These findings collectively suggest that TtHSF97 may play a role in mediating abiotic stress tolerance in plants.
Additionally, we investigated the function of WT and two different transgenic lines (OE#1 and OE#6), which had extremely significantly higher TtHSF97 expression than WT under salt stress. Under control conditions (0 mM NaCl), all Arabidopsis plants, including both wild‐type (Col‐0) and TtHSF97‐overexpressing transgenic lines (#1 and #6), exhibited vigorous growth with no significant differences in green true leaf expansion rate or root length (Figure 8A,C). Following exposure to salt stress (150 mM NaCl), however, the transgenic lines overexpressing TtHSF97 (#1 and #6) displayed significantly enhanced salt tolerance compared to WT. They maintained stronger growth vigor, exhibited reduced physiological damage, and showed a significantly higher green true leaf expansion rate. At this NaCl concentration, WT plants exhibited severe growth inhibition and were unable to fully expand their true leaves. Quantitative analysis revealed that the true leaf expansion rates for transgenic lines #1 and #6 were 39.0% and 53.7%, respectively, whereas the rate for WT plants was markedly lower at only 9.5% (Figure 8B; p < 0.001 for each transgenic line compared to WT, Student's t‐test). Furthermore, the root lengths of the overexpression lines were also significantly longer than those of WT under salt stress (Figure 8D).
*TtHSF97 confers salt tolerance to Arabidopsis plants. (A) Phenotypic comparison of wild‐type (WT, Col‐0) and two homozygous 35S::TtHSF97 lines (#1, #6) under control (0 mM NaCl) and saline (150 mM NaCl) conditions. (B) Quantitative assessment of true leaf expansion rates after 12‐day exposure. Transgenic lines exhibited significantly higher expansion rates versus WT. **Denotes statistically significant differences between WT and transgenic lines (Student's t‐test, p < 0.01). Three independent biological experiments were performed. (C) The phenotypic comparison of different types of plant lines in culture medium under salinity or normal conditions. Seeds were plated on 1/2 MS or 1/2 MS medium containing 150 mM NaCl for 12 days to compare the root length. (D) The root length was compared. Three independent biological experiments were performed. Significant difference compared with WT (p < 0.05).
Subcellular Localization of TtHSF97 Protein
3.7
For subcellular localization analysis, a fusion construct 35S::TtHSF97‐GFP was generated by ligating the TtHSF97 CDS lacking its native stop codon to the N‐terminus of the fluorescent reporter gene GFP. Recombinant plasmids (35S::TtHSF97‐GFP) and the empty vector control (35S::GFP) were independently transformed into the abaxial epidermis of N. benthamiana leaves via A. tumefaciens ‐mediated transient transformation. Confocal microscopy images (Figure 9) revealed diffuse GFP fluorescence throughout the entire cell in control epidermal cells expressing GFP. In contrast, cells expressing the chimeric gene TtHSF97‐GFP exhibited exclusive nuclear GFP signals, which demonstrated precise colocalization with the mCherry fluorescence of a co‐expressed nuclear marker. This compartment‐specific localization confirms that TtHSF97 is an enriched protein, consistent with the canonical functional characteristics of transcription factors requiring nuclear access for DNA binding and transcriptional regulation.
Subcellular localization of TtHSF97 by confocal imaging. Top: Diffuse GFP signal in 35S::GFP control. Bottom: Exclusive nuclear accumulation of 35S::TtHSF97‐GFP, co‐localizing with the mCherry‐tagged nuclear marker (Merge). 35S::TtHSF97‐GFP, a fusion protein: TtHSF97 protein was fused at the amino terminal of GFP. GFP, green fluorescent protein. Scale bar = 50 μm.
Discussion
4
HSF, one of the largest plant transcription factor families, has been extensively studied, and their regulatory roles and molecular mechanisms in plant stress responses have become important research directions in the field of plant molecular biology. This study identified 103 HSF genes in Tritipyrum, substantially exceeding the numbers reported in Arabidopsis (21) (Nover et al. 2001), rice (25) (Guo et al. 2008), maize (30) (Lin et al. 2011), soybean (52) (Li et al. 2014), Secale cereale (31) (Li et al. 2021), and wheat (≥ 56) (Xue et al. 2014). This expansion likely reflects the combined effects of whole‐genome duplication (WGD), segmental duplication, and tandem duplication events, common drivers of gene family diversification in plants, and key mechanisms for environmental adaptation and stress resistance (Lallemand et al. 2020; Ren et al. 2018; Vanneste et al. 2014; Faraji et al. 2021; Rezaee et al. 2020; Heidari et al. 2021). Genomic studies on crops further confirm that such gene family expansion and duplication promote plant evolution and enhance viability across diverse environments (Shen and Yuan 2020; Li et al. 2021; Rehman et al. 2021). Collectively, these studies confirm that gene duplication events provide a critical molecular basis for the survival, reproduction, and evolution of crops in variable environments.
Notably, although salt‐tolerant species such as common wheat do not possess the highest number of HSF family members, their HSF members exhibit distinct characteristics in terms of functional differentiation at the subclass level and specialization of expression patterns, thereby forming an efficient multi‐dimensional stress regulatory network. Phylogenetic classification revealed that 103 HSF genes identified in Tritipyrum could be classified into three distinct groups, with Group A containing the highest proportion of HSF members. Comparative synteny analysis of the HSF genomes in Tritipyrum, H. vulgare , O. sativa , S. cereale , Th. intermedium, and maize demonstrated particularly strong conservation between Tritipyrum and Th. intermedium, supporting their close evolutionary relationship with traditional Gramineae. The genera Tritipyrum and S. cereale were found to have the fewest syntenic linkages. The identification of 1–13 HSF genes shared among at least three species in five syntenic relationships offers valuable insights into the evolutionary conservation of HSF genes across species. The functional differentiation of HSFs in such salt‐tolerant species is primarily manifested in three core subclasses. (1) The conservatively regulated HSF A2 subclass, serving as a “universal regulatory switch” for salt stress responses, is significantly upregulated by salt stress in diverse species including Arabidopsis thaliana , rice, and wheat. Its core function is to maintain intracellular protein homeostasis by activating the transcription of heat shock protein (HSP)‐encoding genes (e.g., TaHsp17 in wheat). In monocotyledonous plants, it further forms a coordinated regulatory pattern with the HSF C2 subclass, improving the precision of stress responses. (2) The salt tolerance‐specialized HSF A6 subclass exhibits a dual characteristic of “constitutive high expression + salt stress‐induced upregulation” in quinoa and wheat: its expression could increase sharply under salt stress (e.g., the expression level of the HSF A6e subclass in quinoa can reach 15 times the basal level). It is hypothesized to play a core role in establishing “stress memory” in embryonic and root tissues, enhancing the overall salt tolerance of plants by strengthening the stress response capacity of key organs. (3) The monocot‐specific HSF C2 subclass has an encoded protein that contains a unique AHA‐like activation domain (e.g., the LLLDGDFGNVSAFGPDAVDF). It can independently activate HSP transcription without relying on other HSFs, providing an additional regulatory layer for salt adaptation.
On this basis, salt‐tolerant species have also evolved a regulatory strategy of coordinated response among multiple HSF subclasses: Under salt stress, quinoa can synchronously induce the expression of members from five HSF subclasses (A2, A4, A6, B1, and C1), reducing the “failure risk” of stress responses through the redundancy of the regulatory network and improving adaptation stability (Giraldo Acosta et al. 2022). Common wheat, on the other hand, exhibits obvious organ‐specific division of labor—HSF A4 and A6 subclasses act as dominant regulatory factors in roots, with their transcriptional levels reaching more than 3 times those in leaf tissues; in contrast, the HSF B1 and C1 subclasses show stronger stress response activity in leaves, achieving efficient salt adaptation at the whole‐plant level through functional complementation between organs.
In summary, the expansion of the HSF gene family provides a genetic basis for functional differentiation, while functional specialization at the subclass level further drives the diversification of plant stress adaptation strategies. Future in‐depth analysis of the functions of crop‐specific HSFs (especially stress tolerance‐related subclasses) will provide an important theoretical basis for clarifying the molecular mechanisms of plant stress tolerance and guiding the genetic improvement of crop stress resistance, which is of great significance for breeding new crop varieties with high stress tolerance.
Salinity disrupts cellular homeostasis through osmotic and ionic imbalances (Tavakkoli et al. 2010). Unlike single functional genes, transcription factors (TFs), including HSFs, can simultaneously regulate multiple downstream genes involved in salt stress response. TFs such as bHLH, bZIP, MYC, NAC, WRKY, and HSF are associated with salt tolerance pathways (Golldack et al. 2011; Lan Thi Hoang et al. 2017; Meraj et al. 2020; Okushima et al. 2007). Numerous HSFs have been identified in response to various environmental stresses in species such as Arabidopsis, rice, maize, and wheat (Guo et al. 2016; Scharf et al. 2012; Xiang et al. 2013). The tissue‐specific expression of HSF genes, through regulation of transcriptional processes, can influence the growth and development of target tissues and organs (Guo et al. 2016; Scharf et al. 2012). In salt‐stressed Arabidopsis, the expression level of several HSF genes was upregulated, with AtHSFA6a showing a 146‐fold increase compared to the control (Miller and Mittler 2006), while AtHSFA1 and AtHSFA2 enhance seedling‐stage resistance to salt stress (Liu et al. 2011). Heterologous expression of wheat TaHSFA2d and rice OsHSFA2e genes in Arabidopsis improves salt tolerance, increasing germination rates and seedling stage chlorophyll content compared to wild‐type plants (Chauhan et al. 2013; Yokotani et al. 2007). Additionally, OsHSFA2s, OsHSFA4s, OsHSFA7, OsHSFA9, OsHSFB2b, and FvHSFA2a genes were upregulated by high salt stress, improving stress resistance to high salinity in rice and strawberry (Chauhan et al. 2013; Hu et al. 2015; Xiang et al. 2013). In this study, 84 TtHSF genes were identified in Tritipyrum root tissues, showing significant responses to salt stress induction. Among these, 41 showed constitutive expression, suggesting their involvement in regulating basic cellular processes, while 29 exhibited marked salt‐stress induction, suggesting their role in the salt stress adaptation. Expression profiling and qRT‐PCR analyses highlighted these 29 TtHSFs as potential key regulators of salt stress response in Tritipyrum root tissues. Further transgenic experiments will be conducted to elucidate the precise biological functions of these TtHSFs, with potential applications in genetic engineering to enhance crop stress resistance and other agronomic traits.
HSFs from different subfamilies can act as either positive or negative regulators of salt stress tolerance. For instance, overexpression of the wheat TaHSFA2d gene in Arabidopsis enhanced salt tolerance (0.3 mM NaCl), with transgenic lines exhibiting significantly higher seed germination rates and seedling chlorophyll content compared to wild‐type control plants. In contrast, seeds and seedlings of the AtHSFA2 deletion mutant showed poorer growth than those of the wild type (Chauhan et al. 2013). Similarly, overexpression of OsHSFA2e in Arabidopsis enabled plants to survive up to 20% in an agar medium containing 0.125 mM NaCl, while all non‐transgenic plants died, indicating that OsHSFA2e enhances salt tolerance in Arabidopsis (Yokotani et al. 2007). In contrast, overexpression of OsHSFB2b in japonica rice treated with 0.2 mol·L^−1^ NaCl led to a marked decrease in salt tolerance, suggesting that OsHSFB2b acts as a negative regulator in the salt stress response and regulation (Xiang et al. 2013). These results underscore the functional divergence of HSF subfamilies in salt stress adaptation. TtHSF97, from Tritipyrum's HSF family, shares the same evolutionary lineage. AtHSFA2 in Arabidopsis emerged as a key candidate due to its significant upregulation under salt stresses and recovery. Overexpression of AtHSFA2 can enhance the salt tolerance of transgenic Arabidopsis thaliana and simultaneously improve its tolerance to salt stress and osmotic stress (Zang et al. 2019). Studies have shown that the transcription level of TaHsfA6f in common wheat is significantly upregulated under multiple abiotic stress conditions, including salt stress. Overexpression of TaHsfA6f can enhance the tolerance of transgenic plants to heat, drought, and salt stresses, while increasing the plants' sensitivity to exogenous abscisic acid (ABA) and promoting ABA accumulation in vivo. This result indicates that TaHsfA6f enhances plant tolerance to multiple abiotic stresses by regulating the metabolic and signaling pathways of ABA (Bi et al. 2020).
Tissue‐specific profiling revealed highest relative expression of TtHSF97 in leaves of Tritipyrum under salt stress, followed by stems and roots. High salt concentrations directly and severely damaged the root system. Under both salt stress and recovery, TtHSF97 expression levels were significantly higher in the entire plant compared to the control. These findings align with our transcriptome data and previous reports (Chauhan et al. 2013). Consequently, TtHSF97 was highly and sensitively expressed throughout the plant to assist in coping with salt stress. The genes closely related to TtHSF97 are involved in processes such as metabolism, cellular functions, response to stimuli, and biological regulation. Functional validation via Arabidopsis heterologous overexpression of TtHSF97 confirmed its positive regulatory role, enhancing transgenic lines salt stress tolerance, likely through early stress perception akin to AtHSFA7b (Zang et al. 2019). This mechanism may involve coordinating cellular defense mechanisms through activation of downstream stress‐responsive genes (e.g., SOS1, HSE‐containing targets). While this study establishes TtHSF97's critical role, future studies will identify the specific cis‐regulatory motifs bound by TtHSF97 via Chip‐seq or DAP‐seq, define its direct target genes to map its direct transcriptional network, and validate TtHSF97 efficacy directly in triticale crops (e.g., wheat, Tritipyrum) via genetic engineering. In this study, we identified several genes significantly correlated with the expression of TtHSF97. For further investigation into the regulatory mechanisms of TtHSF97, we will utilize a yeast two‐hybrid system to screen for potential interacting target genes, particularly those involved in salt stress tolerance. This screening will help identify key genes that interact with TtHSF97 and provide deep insights into how these genes contribute to salt tolerance. Subsequently, we plan to validate these interactions and explore their specific functions under salt stress, thus providing a more comprehensive understanding of the role of TtHSF97 in stress adaptation.
Soil salinization has emerged as a critical factor, adversely affecting seed germination, seedling development, and crop yield, posing an increasingly serious challenge. Th. elongatum, a species closely related to T. aestivum , can thrive in salt concentrations comparable to those of seawater. Tritipyrum, a hybrid derived from intergeneric crossbreeding between T. aestivum and Th. elongatum, serves as a vital bridge for transferring salt tolerance genes from Th. elongatum into T. aestivum (Baker et al. 2020; McKenna et al. 2020). Enhancing salt tolerance in plants predominantly triggers stress‐responsive genes, whose products contribute to the repair of both primary and secondary stresses induced by salt.
Unlike individual functional genes, TFs, such as HSFs, have the capacity to regulate a group of downstream target genes, which, in turn, control physiological and biochemical processes responding to salt stress (Amirbakhtiar et al. 2019; van Zelm et al. 2020). In this study, we systematically characterized the Tritipyrum HSF family through phylogenetic, motif, and correlation analyses. RNA‐seq was employed as part of a transcriptomic analysis under salt stress identified TtHSF97 as a key candidate, homologous to Arabidopsis AtHSFA2. Subcellular localization confirmed its nuclear targeting (Figure 9), consistent with its role as a transcriptional regulator. Heterologous expression of TtHSF97 in Arabidopsis validated its salt‐responsive function, with transgenic lines exhibiting 38%–54% leaf expansion than WT (9.5%) under 150 mM NaCl (Figure 8B,C). These findings position TtHSF97 as a promising regulator of salinity resilience. In particular, our overexpression experiments in Arabidopsis have confirmed that the constitutive expression of TtHSF97 can significantly enhance the salt tolerance of transgenic plants, including higher survival rates, faster leaf expansion rates, and more developed root systems architecture. This makes it a highly promising target for genetic engineering. By introducing TtHSF97 or its allelic variants into major food crops such as common wheat through molecular marker‐assisted selection (MAS) or transgenic technology, it is expected to develop new varieties with stronger adaptability to saline‐alkali soils, thereby directly addressing the threat of global soil salinization to agricultural production. Studies have confirmed that salt‐tolerant plants can maintain high protein content and nutritional stability under salt stress: although some quinoa genotypes show reduced yield due to increased salt concentration, they still retain high seed protein content (Hussain et al. 2020); salt‐tolerant rice genotypes exhibit significantly better yield and appearance quality than salt‐sensitive ones (Li et al. 2023). This may stem from the close association between salt tolerance and plant physiological metabolism, and salt tolerance can also positively regulate nutritional value (Ullah et al. 2019; Duan et al. 2023; Ben‐Amar et al. 2022). Specific genes (e.g., OsGrx_C7 in rice) can enhance salt tolerance and promote biomass accumulation and root development by regulating metabolic pathways under salt stress (Verma et al. 2021; Zang et al. 2025; Zhang et al. 2020; Ali et al. 2025). In conclusion, improving plant salt tolerance not only helps plants survive under salt stress but also can enhance food crop quality and nutritional stability through multiple physiological and molecular mechanisms. Plant response to salt stress is highly complex, involving numerous genes and pathways. The deployment of HSF‐based genetic engineering promises to facilitate the cultivation of salt‐tolerant crops, driven by the discovery and widespread use of candidate transcription factor genes linked to salt tolerance, along with the ongoing advancement in understanding the transcription factor‐mediated salt tolerance mechanism.
Conclusions
5
This study provides a comprehensive analysis of the HSF gene family in Tritipyrum. The motif compositions of the 103 full‐length TtHSF genes within the same groups and subgroups exhibit striking similarity. Synteny analysis and phylogenetic comparisons of HSF genes across multiple plant species revealed the evolutionary features of HSF genes in Tritipyrum. Based on their expression patterns in various tissues and their response to salt stress and recovery treatments, 29 TtHSF genes are pivotal in the salt stress response of Tritipyrum. TtHSF97, a top‐priority salt‐responsive gene among 29 TtHSFs, exhibits nuclear localization, consistent with its function as a transcriptional regulator. Heterologous expression of TtHSF97 in Arabidopsis significantly enhances salinity tolerance, indicating TtHSF97 could serve as a potential target gene for enhancing salt tolerance in wheat through biotechnological or molecular breeding approaches. These findings provide valuable insights into the biological functions of specific HSF genes in Tritipyrum.
Author Contributions
Xianjiao Qin: data curation (equal), formal analysis (equal), investigation (equal), writing – original draft (equal). Wenzhen Li: investigation (equal), writing – original draft (equal). Ruoruo Wang: writing – review and editing (equal). Jianxia Xu: data curation (equal), investigation (equal). Yanqing Ding: investigation (equal), visualization (equal). Kuiyin Li: data curation (equal), funding acquisition (equal), writing – review and editing (equal).
Conflicts of Interest
The authors declare no conflicts of interest.
Supporting information
Figure S1: Conserved motif distribution of HSF proteins in Tritipyrum. Figure S2: Genetic distance distribution among HSF subfamilies.
Table S1: Systematic renaming of HSF genes based on chromosomal positions in the Tritipyrum genome.
Table S2: Forward and reverse primers used for qRT‐RCR validation of TtHSF gene expression.
The reference list from the paper itself. Each links out to its DOI / PubMed record.
- 1Albihlal, W. S. , I. Obomighie , T. Blein , et al. 2018. “ Arabidopsis Heat Shock Transcription Factor A 1b Regulates Multiple Developmental Genes Under Benign and Stress Conditions.” Journal of Experimental Botany 69, no. 11: 2847–2862. 10.1093/jxb/ery 142.29697803 PMC 5961379 · doi ↗ · pubmed ↗
- 2Ali, S. , M. Khan , and Y. S. Moon . 2025. “Synergistic Effect of Serratia fonticola and Pseudomonas koreensis on Mitigating Salt Stress in Cucumis sativus L.” Current Issues in Molecular Biology 47, no. 3: 194. 10.3390/cimb 47030194.40136448 PMC 11941737 · doi ↗ · pubmed ↗
- 3Amirbakhtiar, N. , A. Ismaili , M. R. Ghaffari , F. Nazarian Firouzabadi , and Z. S. Shobbar . 2019. “Transcriptome Response of Roots to Salt Stress in a Salinity‐Tolerant Bread Wheat Cultivar.” P Lo S One 14: e 0213305. 10.1371/journal.pone.0213305.30875373 PMC 6420002 · doi ↗ · pubmed ↗
- 4Baker, L. , S. Grewal , C. Y. Yang , et al. 2020. “Exploiting the Genome of Thinopyrum elongatum to Expand the Gene Pool of Hexaploid Wheat.” Theoretical and Applied Genetics 133: 2213–2226. 10.1007/s 00122-020-03583-3.32313991 PMC 7311493 · doi ↗ · pubmed ↗
- 5Bakery, A. , S. Vraggalas , B. Shalha , H. Chauhan , M. Benhamed , and S. Fragkostefanakis . 2024. “Heat Stress Transcription Factors as the Central Molecular Rheostat to Optimize Plant Survival and Recovery From Heat Stress.” New Phytologist 244, no. 1: 51–64. 10.1111/nph.20017.39061112 · doi ↗ · pubmed ↗
- 6Ben‐Amar, A. , S. Daldoul , D. Allel , T. Wetzel , and A. Mliki . 2022. “Ectopic Expression of a Grapevine Alkaline α‐Galactosidase Seed Imbibition Protein Vv SIP Enhanced Salinity Tolerance in Transgenic Tobacco Plants.” Functional & Integrative Genomics 23, no. 1: 12. 10.1007/s 10142-022-00945-6.36547729 · doi ↗ · pubmed ↗
- 7Bi, H. , J. Miao , J. He , et al. 2022. “Characterization of the Wheat Heat Shock Factor Ta Hsf A 2e‐5D Conferring Heat and Drought Tolerance in Arabidopsis .” International Journal of Molecular Sciences 23, no. 5: 2784. 10.3390/ijms 23052784.35269925 PMC 8911409 · doi ↗ · pubmed ↗
- 8Bi, H. , Y. Zhao , H. Li , and W. Liu . 2020. “Wheat Heat Shock Factor Ta Hsf A 6f Increases ABA Levels and Enhances Tolerance to Multiple Abiotic Stresses in Transgenic Plants.” International Journal of Molecular Sciences 21, no. 9: 3121. 10.3390/ijms 21093121.32354160 PMC 7247712 · doi ↗ · pubmed ↗