Correction: Divergent molecular pathways drive monomorphic epitheliotropic and enteropathy-associated intestinal T-cell lymphoma
David Vallois, Edoardo Missiaglia, Luis Veloza, Anja Fischer, Doriane Cavalieri, Vimel Rattina, Bettina Bisig, Vincent Roh, Laura Wiehle, Rita Sarkis, Emmanuel Bachy, Christophe Bonnet, Julie Bruneau, Anne Cairoli, Roland De Wind, Fanny Drieux, Romain Dubois, Jean-François Emile

Abstract
Genes, proteins, chemicals, diseases, species, mutations and cell lines named across the full text — each resolved to its canonical identifier and authoritative record.
Click any figure to enlarge with its caption.
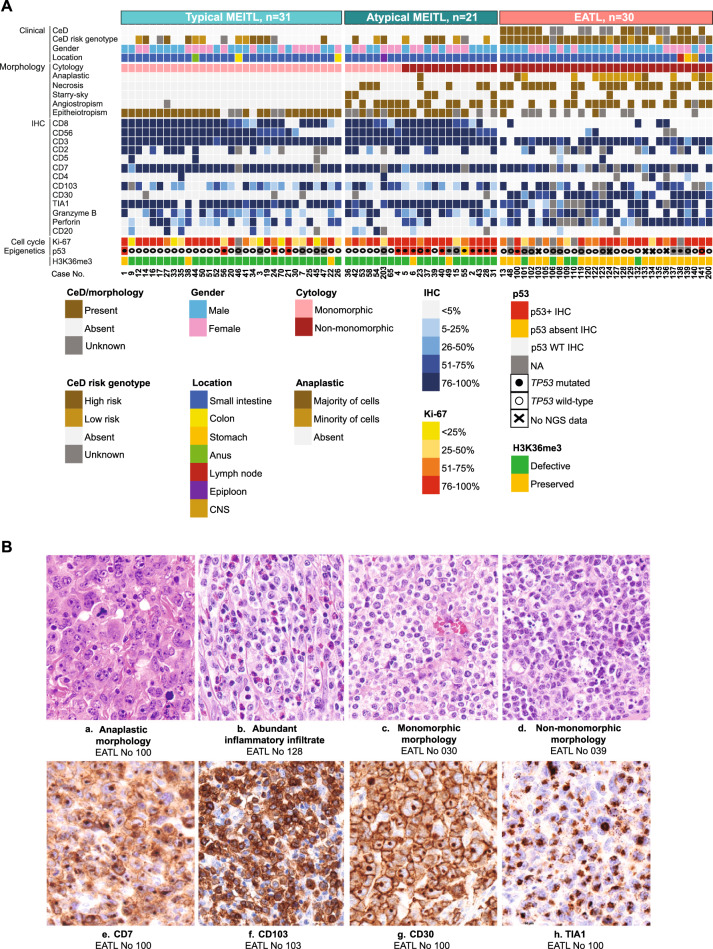 Figure 1
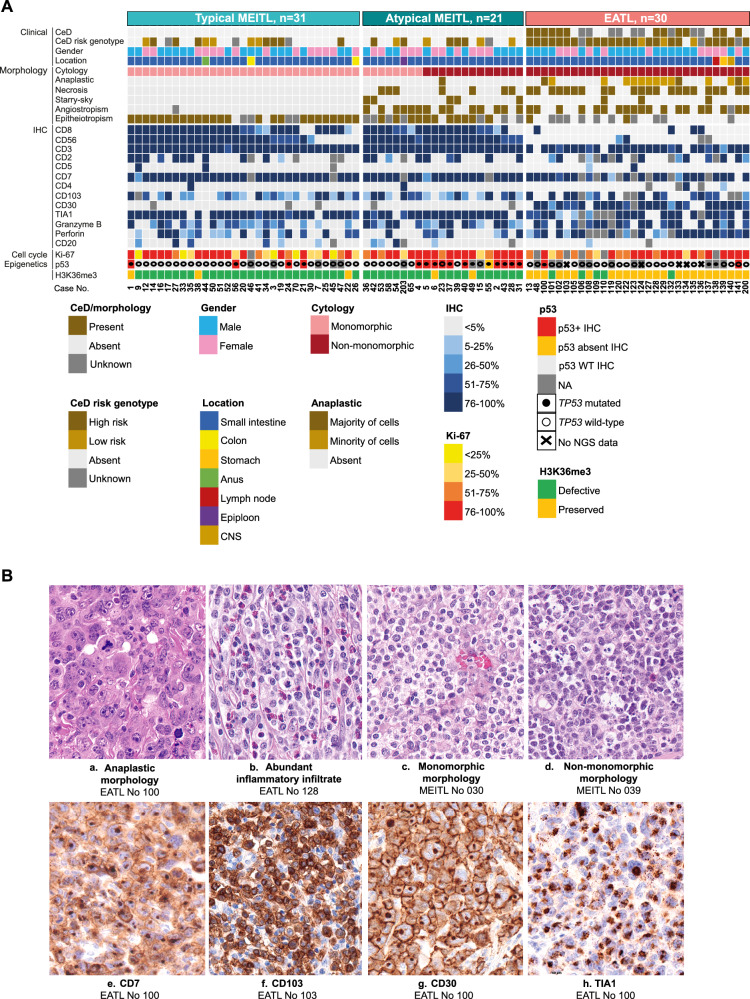 Figure 2
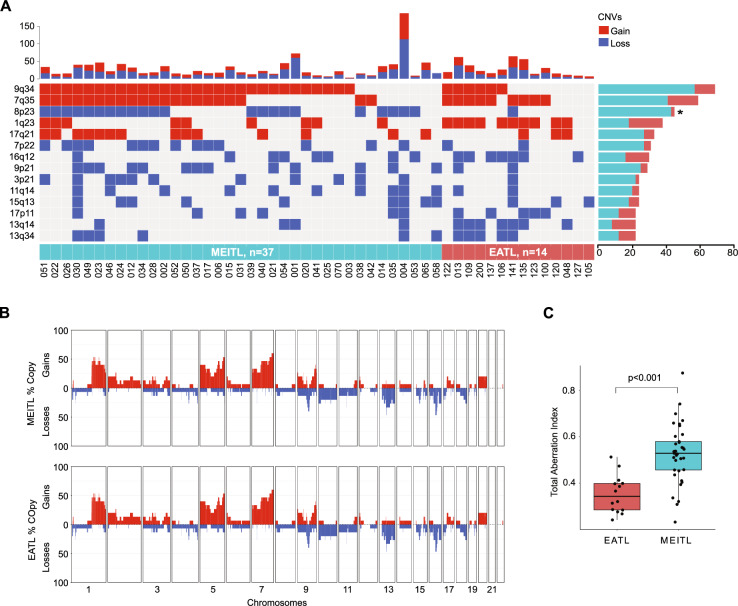 Figure 3
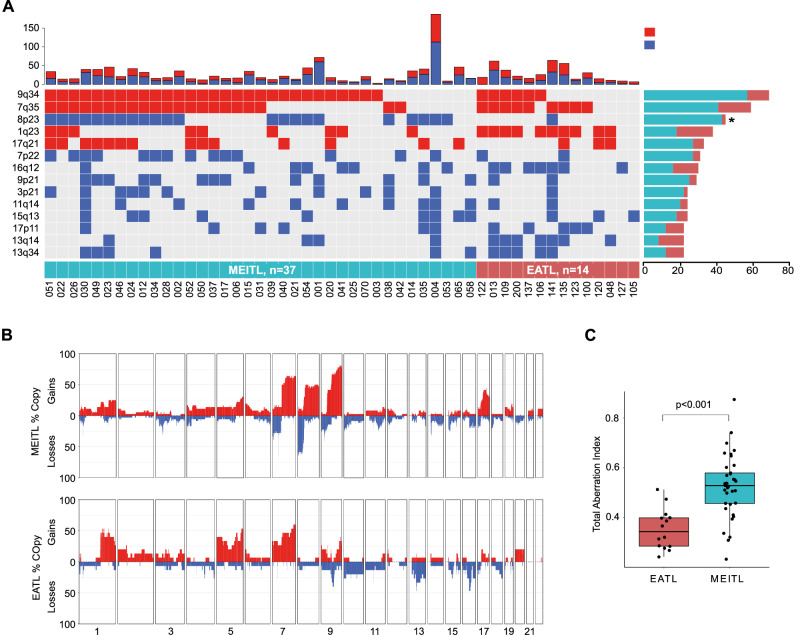 Figure 4
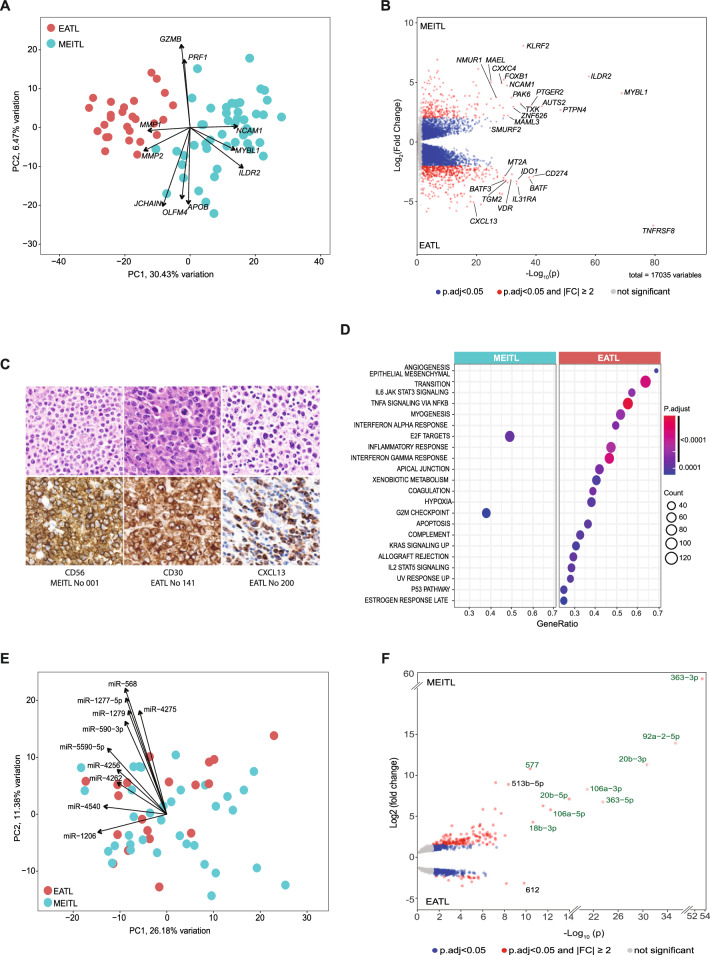 Figure 5
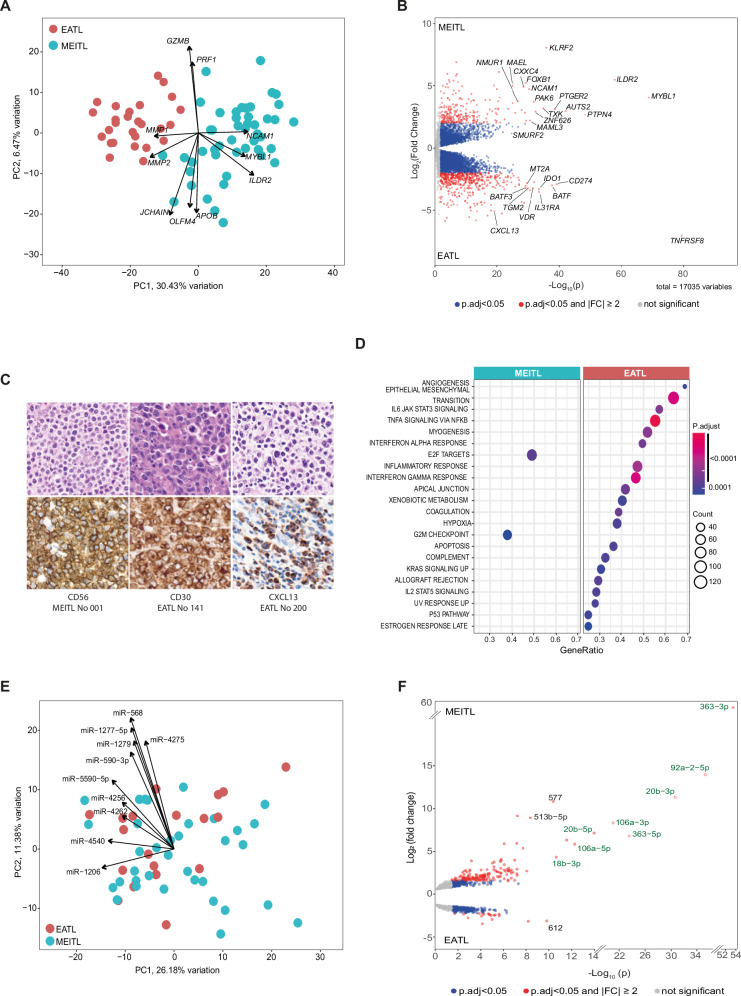 Figure 6
Peer Reviews
No public reviews on file for this paper yet. If you reviewed it on a platform where reviews are public (OpenReview, ICLR, NeurIPS, ICML), you can paste yours below so the community can read it here.
Videos
No videos yet. Explain this paper in a talk, walkthrough, or lecture? Add one.
Taxonomy
TopicsCeliac Disease Research and Management · Chronic Lymphocytic Leukemia Research · Lymphoma Diagnosis and Treatment
Correction to: Leukemia 10.1038/s41375-025-02777-2, published online 07 October 2025
In the originally published version of this article, same minor errors were present: (1) in Table 1, only the headers should appear in bold font, as now corrected; (2) in Figure 1B, two typographical errors occurred in panels c and d, where the correct legends are MEITL No 030 and MEITL No 039 instead of EATL No 030 and EATL No 039; (3) in Figure 3B, the MEITL CNV profile was mistakenly replaced by a duplication of the EATL profile. The correct MEITL profile has been now inserted; (4) in Figure 4F, the miRNA “577” label appeared in green font instead of black. All errors have been corrected in the revised figures and table provided in the updated version.
Incorrect figure 1
Corrected figure 1
Incorrect figure 3
Corrected figure 3
Incorrect figure 4
Corrected figure 4MEITL (n = 52)EATL (n = 30)p valueClinical featuresReported celiac disease0/52 (0%)13/30 (43%)<0.005Age, median, years (range, median)67 (29-91)64 (34-86)0.37Gender (male/female)27:25:0019:110.2Acute event at presentation38/44 (86%)12/18 (67%)0.09 Bowel perforation33/44 (75%)8/18 (44%)0.037 Bowel obstruction12/44 (27%)6/18 (33%)0.76Lugano stage Stage I/II27/44 (61%)8/13 (61%)1 Stage III/IV17/44 (39%)5/13 (39%)PS0-118/40 (45%)4/8 (50%)1≥222/40 (55%)4/8 (50%)Morphology Typical31/52 (60%) Atypical21/52 (40%)Pleomorphic13/52 (25%)30/30 (100%)<0.005Anaplastic1/52 (2%)15/30 (50%)<0.005Necrosis7/52 (13%)22/30 (73%)<0.005Starry-sky5/52 (10%)3/30 (10%)1Angiotropism14/51 (27%)19/29 (65%)<0.005Epitheliotropism36/41 (88%)2/20 (10%)<0.005Moderate/abundant inflammation3/52 (6%)20/30 (67%)Immunophenotype CD847/52 (90%)4/30 (13%)<0.005 CD5646/52 (88%)2/28 (7%)<0.005 CD352/52 (100%)27/30 (90%)0.046 CD220/47 (42%)12/24 (50%)0.619 CD52/51 (4%)2/30 (7%)0.624 CD748/48 (100%)22/23 (96%)0.324 CD42/52 (4%)2/27 (7%)0.603 CD10340/51 (78%)15/25 (60%)0.108 CD300/47 (0%)25/29 (86%)<0.005 TIA147/52 (90%)20/25 (80%)0.108 Granzyme B37/52 (71%)19/28 (68%)0.596 Perforin27/52 (52%)22/29 (76%)<0.005 CD209/49 (18%)1/29 (3%)0.046 CD79a3/41 (7%)0/10 (0%)0.567TCR TCRβ17/50 (34%)8/28 (29%)0.472 TCRγδ26/50 (52%)8/27 (30%)0.05 TCRαβ-TCRγδ+22/49 (44%)4/26 (15%)0.012 TCRαβ+TCRγδ-12/49 (24%)4/26 (15%)0.391 TCRαβ+TCRγδ+4/49 (8%)3/26 (11%)0.685 TCRαβ-TCRγδ-11/49 (22%)15/26 (58%)0.004
The original article has been corrected.