Effects of Acute Altitude, Speed and Surface on Biomechanical Loading in Distance Running
Olaf Ueberschär, Marlene Riedl, Daniel Fleckenstein, Roberto Falz

TL;DR
This study examines how altitude, speed, and surface affect biomechanical loading in distance running, finding that running speed is the main factor influencing these effects.
Contribution
The study provides new insights into how acute altitude, speed, and surface interact to influence biomechanical loading during running.
Findings
Running speed significantly affects cadence and peak tibial acceleration, with speed being the main factor influencing biomechanical loading.
Altitude decreases cadence and peak tibial acceleration, with notable effects at higher speeds.
Surface type had no significant impact on the biomechanical variables measured.
Abstract
Altitude training camps are a popular measure to enhance endurance performance at sea level. This study elucidates the effects of acute altitude-induced hypoxia, running speed and surface on cadence, peak tibial acceleration (PTA), gait asymmetry and residual shock in distance running. Ten healthy, trained native lowlanders (6 males, 4 females; 28.2 ± 9.2 years; mean V˙O2,peak of 54.9 ± 5.9 mL min−1 kg−1) participated in this study. They ran 1500 m bouts of at 50, 1000 and 2300 m above mean sea level on paved roads and natural trails at three different speeds. Those speeds were chosen to represent the most common training zones and were defined as v1=90%⋅vVT1, v2=12vVT1+vVT2 and v3=100%⋅vVT2, with vVT1 and vVT2 denoting the speeds at the ventilatory thresholds 1 and 2. Based on the experimental results, cadence increased by +2.2 spm per +1 km h−1 (p < 0.001) and fell by −1.1. spm per…
Genes, proteins, chemicals, diseases, species, mutations and cell lines named across the full text — each resolved to its canonical identifier and authoritative record.
Click any figure to enlarge with its caption.
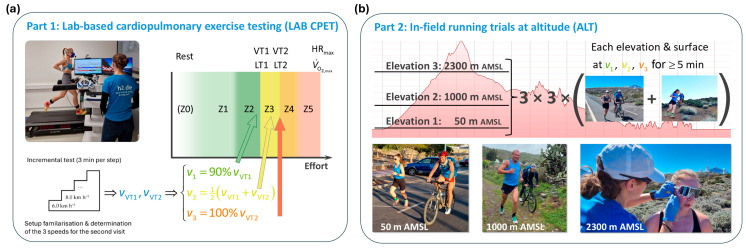 Figure 1
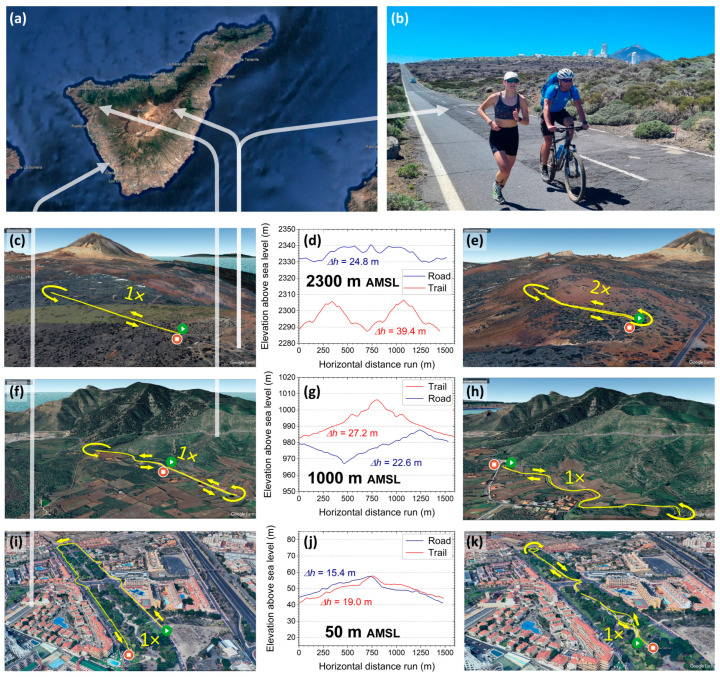 Figure 2
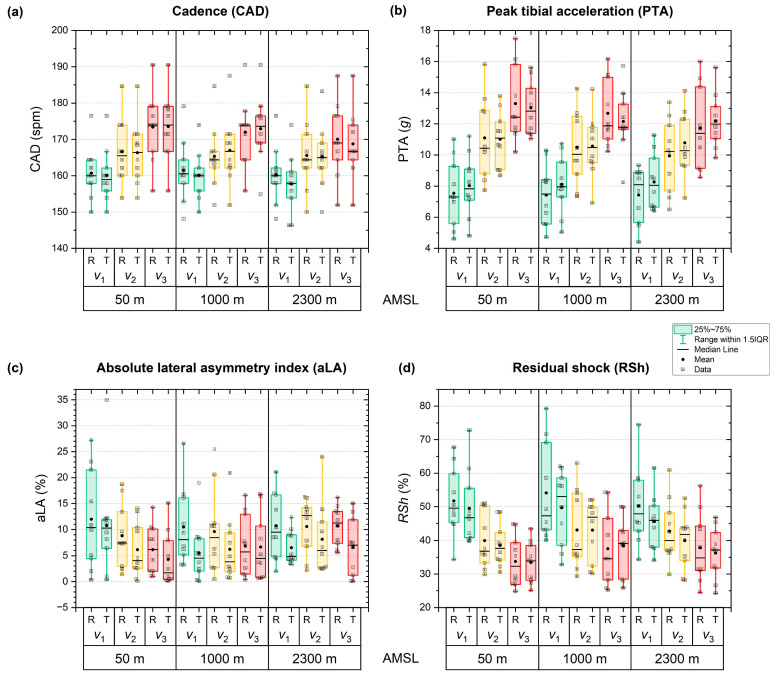 Figure 3
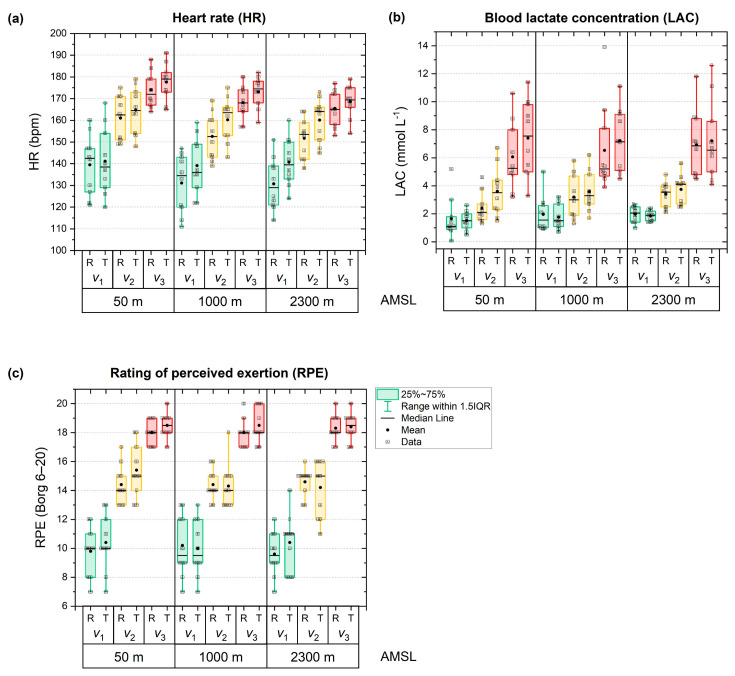 Figure 4
- —Federal Ministry of Research, Technology and Space of Germany
Peer Reviews
No public reviews on file for this paper yet. If you reviewed it on a platform where reviews are public (OpenReview, ICLR, NeurIPS, ICML), you can paste yours below so the community can read it here.
Videos
No videos yet. Explain this paper in a talk, walkthrough, or lecture? Add one.
Taxonomy
TopicsHigh Altitude and Hypoxia · Cardiovascular and Diving-Related Complications · Sports Performance and Training
1. Introduction
Altitude training camps are a common and well-established measure in the training regimens of elite endurance athletes to utilise hypoxia-induced adaptations to enhance sea-level endurance performance [1,2,3,4,5,6,7,8], particularly of runners and triathletes [9,10]. These camps are typically held at moderate elevations between 2000 and 2500 metres above mean sea level (AMSL) [2,11]. Basically, exposure to reduced oxygen availability for a sufficiently long period of at least three weeks triggers increased production of erythropoietin and a consequent increase in total haemoglobin mass and the blood’s oxygen-carrying capacity, as well as a heightened capillary density, mitochondrial efficiency and buffering capacity in muscles [2,5,6,11,12]. At the same time, training intensities can be kept at an acceptable level. After returning to sea level, responsive athletes are likely to benefit from a temporary “performance window” of approximately 14 to 30 days [4,11,13].
Despite these potentially beneficial performance outcomes, training under altitude conditions is subject to the repercussions of altered physiological responses and biomechanical loads. For instance, a direct translation of intensity control from sea level to altitude conditions based on heart rate, lactate levels or external performance metrics (e.g., running speed or pedalling power output) may be challenging: On the one hand, aerobic capacity (i.e., peak oxygen uptake) and peak exercise heart rate have been shown to decrease under acute hypoxia [7,14,15], with effect sizes varying between specific exercises, e.g., running or cycling [14]. On the other hand, anaerobic capacity, i.e., lactate accumulation and tolerance at submaximal efforts, exhibits a duration-dependent different response [8,15], sometimes referred to as the “lactate paradox” [8]. Irrespective of the underlying details, it is evident that, owing to the generally altered physiological responses, factors defining exercise intensities (e.g., running speed, incline, etc. [16,17]) need to be carefully adjusted under altitude conditions to achieve a comparable training stimulus and avoid overreaching.
Given that the majority of popular altitude training camp sites are situated in rather rural mountain regions [10], running sessions often include off-road courses on hilly trails with natural surfaces. These courses may alter the biomechanical loading of the musculoskeletal system due to uphill and downhill segments, changes in speed and varying running surfaces [18,19,20,21,22,23]. Higher running speeds generally increase cadence (CAD, i.e., step frequency) and peak tibial acceleration (PTA) [16,20,23], while, conversely, they may potentially result in lower PTA asymmetry [18,24]. Regarding the effects of running surface on CAD and on PTA as an external biomechanical loading metric [25,26,27,28,29,30,31,32,33,34], the extant literature provides an inconclusive picture, with partly conflicting results that depend on surface properties [18,19,21,22,35,36]. A recent case study has demonstrated that topographical and surface-related running course conditions may alter PTA and lateral, i.e., between-legs asymmetry in PTA [19]. Potential effects on lateral asymmetry in running gait are of particular interest to the successful balancing of exercise loading and recovery, since asymmetry is regularly discussed as a possible risk factor for sustaining overuse injuries [37,38,39]. In light of this, special attention should be given to individual lateral asymmetries in running gait, especially during periods of increased training load and physiological stress typical of altitude training camps.
Taken together, these two aspects—acute hypoxia and potentially different running course conditions—may be relevant to training management, particularly at the beginning of a camp when no adaptation has yet taken place. It remains unclear how the aforementioned additional contributing factors to total physiological and biomechanical effort may further increase the load of a typical running session outside an athletics tartan track. This study aims to bridge this research gap through a real-world experimental approach to elucidate the effects of acute altitude-induced hypoxia and specific running surfaces on the biomechanical loading at relevant running speeds. We hypothesised that acute hypoxia might induce increases in CAD and PTA and a decrease in PTA asymmetry, and that natural surface conditions would elevate asymmetry.
2. Materials and Methods
2.1. Participants
Ten healthy, trained amateur triathletes and runners (4 females, 6 males) participated in this study. All subjects were adult native lowlanders and had been regularly living at an elevation between 50 and 160 m AMSL for at least 10 years. They exhibited no signs of cardiac, pulmonary or inflammatory diseases, nor did they report any orthopaedic issues at the time of the examinations. The subjects accomplished an average weekly running mileage of 29.5 ± 13.5 km and a regular exercise load of 10.7 ± 3.7 h per week. The performance-based inclusion criterion was a seasonal best of under 45 min over 10 km road running for the males (<4:30 min km^−1^) and under 60 min for the females (<6:00 min km^−1^). Detailed characteristics of the cohort are summarised in Table 1. Written informed consent was obtained from all participants prior to their participation. The study adhered to the Declaration of Helsinki and received approval from the Ethics Committee of the Department of Engineering and Industrial Design at the Magdeburg-Stendal University of Applied Sciences (approval numbers EKIWID-2023-09-001RM and EKIWID-2023-09-001RMII).
Due to the exploratory nature and multifactorial design, only an exemplary sample size estimation based on a single influencing factor and a single outcome variable was possible. Alda-Blanco et al. [40] reported a significant difference in HR of 5 bpm in trained runners when running on substantially different surfaces (tartan track vs. grass), with a pooled standard deviation of 8 bpm. Given the within-study design, we assumed a correlation of 0.75 between repeated measurements, resulting in a Cohen’s d of 0.92. To achieve a statistical power of 0.8 with a type I error level of α = 0.05, a minimum of 9 participants needed to be included in this study. Based thereon, we chose 11 subjects to allow for a dropout rate of up to 20%. Of those 11 participants, 10 eventually completed the study.
2.2. Study Design
We employed a crossover design with counterbalanced surface conditions comprising two parts: (1) a laboratory-based cardiopulmonary exercise testing (LAB CPET) at virtual sea level (56 m AMSL, Figure 1a) and (2) a block of in-field running trials at three different altitude levels (ALTs) of approximately 50 m, 1000 m and 2300 m AMSL (Figure 1b).
2.2.1. Part 1: Laboratory-Based Cardiopulmonary Exercise Testing (LAB CPET)
The LAB CPET was conducted in Magdeburg, Germany, between February and March 2024. First, participants’ physical health and suitability were confirmed through physical examination, self-reporting of health status, a questionnaire addressing physical activity and exercise patterns, and current performance metrics. Second, the subjects underwent a CPET on a motorised treadmill (Star Trac FreeRunner 10TRx, Core Health 6 Fitness, Vancouver, BC, Canada) using an established standardised incremental protocol [41,42], starting at a running speed of 6.0 km h^−1^ with 3 min stages and increments of 2.0 km h^−1^ until voluntary exhaustion. A 1% belt incline was used to compensate for the absence of air drag on the treadmill [43]. During each stage, the subjects’ ventilation, oxygen uptake and carbon dioxide output were continuously monitored through breath-by-breath spirometry (MetaMax 3B, CORTEX Biophysik GmbH, Leipzig, Germany) with appropriately sized face masks (7450 Series V2 Mask; Hans Rudolph, Inc., Shawnee, KS, USA). HR was continuously assessed using a multisport smartwatch (Garmin Forerunner 955 Solar, Garmin Ltd., Olathe, KS, USA) connected to a compatible chest strap (Garmin HRM Swim, Garmin Ltd., Olathe, KS, USA). HR measurements through this combination of wearables have recently been shown to be accurate within ±1 bpm by direct comparison to electrocardiography [44].
Based on those cardiopulmonary gas exchange data, the individual ventilatory thresholds 1 (VT1) and 2 (VT2) were derived by two independent, experienced researchers. Furthermore, LAC levels at volitional exhaustion (LAC_ex_) were measured by capillary blood sampling (Lactate SCOUT 4 Solo, EKF-diagnostic GmbH, Barleben, Germany), while RPE was assessed using the Borg 6–20 scale [45]. Based on the individual running speeds at VT1 (vVT1) and at VT2 (vVT2), three running speeds for in-field testing, i.e., v1, v2 and v3, were defined as
for each subject individually. These speeds cover the typical range of paces used in distance running-specific training, i.e., Zone 2 “easy running” (within the framework of the five-zone model typically used in training practice [46]), Zone 3 “threshold training” and Zone 3→4 “threshold to ” (Figure 2a) [41].
2.2.2. Part 2: Altitude Trials (ALTs)
All ALTs were carried out on the island of Tenerife, Spain, within two weeks in March 2024 (Figure 2a). The participants spent most of their stay at or near sea level, except for the days of the ALTs (“sleep low, train high”). Before each trial, they were transferred to the altitude measurement sites by car within a travel time of ½ to 1 h. Measurements started within 1 h upon arrival at the specified elevation, ensuring an acute state of hypoxia.
At each of the three altitudes of 50, 1000 and 2300 m AMSL, the participants ran two predefined courses with different surfaces—road (ROAD, Figure 2c,f,i) and trail (TRAIL, Figure 2e,h,k)—at their individually set running speeds v1, v2 and v3. All courses were on public, paved roads with an asphalt surface in good condition (ROAD) or publicly accessible hiking paths with sufficiently even surfaces and similar ground conditions featuring a mixture of natural soil, gravel and volcanic ashes (TRAIL). All but one course consisted of a single lap and were approximately 1500 m long, implying that each subject had to run for at least 5 min to complete it. In one case (2300 m AMSL on TRAIL), the course consisted of two consecutive identical laps due to local topographical constraints. For each course, the start and end points were identical within ±20 m. The relative elevation profiles (Figure 2d,g,j), i.e., ascending and descending vertical metres and inclines, were chosen such that the expected climbing effort remained comparable between the courses given the local conditions and topological and geographical constraints, ranging between = 15–25 m (ROAD) and 19–39 m (TRAIL), respectively. The upper boundary of the remaining biassing effect due to varying profiles was estimated to be less than 2.8% through the calculation of grade-adjusted paces [47]. Moreover, the experimental trials were scheduled in such a way that, across all measurement days, temperatures (20 ± 3 °C) and relative humidity (60 ± 10%) were relatively comparable at all elevations during the runs, taking advantage of the stable subtropical desert climate of the central and southern regions of Tenerife in March.
The order of uphill and downhill segments within a single course was dictated by the demands of practical feasibility, and its inevitable variability between courses was not deemed to possess the capacity to substantially alter the outcome in terms of time-averaged biomechanical variables. To facilitate the selection of the correct individual pace, a cyclist or an experienced, trained runner accompanied the participant at the specific target speed (Figure 2b), depending on the speed and local restrictions (particularly restrictions within the Teide National Park not allowing cyclists to use certain pathways). In addition to providing a reliable pacing reference, the accompanying person carried the IMU receiving station in their backpack (see Figure 2b and photo insets in Figure 1b at the top right, bottom left and centre).
In this way, in total, 3 elevations × 3 speeds × 2 surfaces = 18 ALT running bouts were conducted by each subject within a total time frame of 8 days. All six bouts belonging to the same elevation were completed as a combined trial on the same day. Between these elevation trials, at least two days of rest were granted, with only compensatory training.
Within an elevation trial, the order from v1 to v2 and v3 for a given surface was fixed to reduce the recovery time required between the bouts. Since at v1, by definition, LAC accumulation is negligible, the v1 runs were unlikely to bias the physiological baseline of the v2 runs, and, instead, they could serve as a standardised familiarisation routine for each course. Similarly, the potentially elevated LAC level at the end of the v2 run was not expected to significantly affect the experimental outcome at v3 because, according to the definition of VT2, a substantial lactate accumulation was anticipated to occur at that speed, marking the individual’s maximum LAC steady state. Therefore, both the v2 and the v3 runs could start shortly (i.e., 3–5 min) after the previous run at v1 or v2 had been completed. The remaining effect of LAC accumulation during v2 on the subsequent run at v3 can be regarded as negligible, as confirmed by the large numerical differences that were experimentally observed between the LAC levels after runs at v2 and v3. In contrast, the order of the two surfaces was randomised to minimise the effects of familiarisation with altitude. Blinding was not possible for obvious reasons of geographical clarity. Between the two surface trials at a given elevation, a compensatory recovery period of at least 15 min was granted until LAC levels in the subjects returned to roughly their baseline value, accounting for the generally substantial LAC accumulation in the v3 run of the previous surface trial.
Because altitude heightens physiological effort due to hypoxia, while the decrease in air pressure (e.g., a drop from approximately 1013 mbar at sea level to roughly 800 mbar at 2000 m AMSL) is considered important given the biomechanical objective of this study, the zone-based running speeds v1, v2 and v3 were slightly reduced at 1000 m and 2300 m AMSL to ensure the same relative effort in terms of percentage of maximum heart rate (%HR_max_) and, correlated with it, the Borg 6–20 scale for RPE [48,49]. Based on the experimental findings of Wehrlin et al. in trained endurance athletes, an increase in submaximal HR of +6.8 bpm (+5.1%) per 1000 m in elevation could be expected for efforts near VT1 (i.e., specifically, 55% , and a drop in maximal HR of −1.9 bpm (−1.0%) per 1000 m [50,51]. Hence, by combining these two findings, running at the same submaximal speed (in terms of km h^−1^) at higher altitude will require a heightened level of relative physiological effort (in terms of %HR_max_ or RPE), owing to both the higher submaximal HR and lower maximal HR. Numerically, the combination of the specific experimental results of Wehrlin et al. yields an approximate factor for the expected increase in %HRmax and RPE of , i.e., +3.5% per 1000 m in elevation. In this context it should be noted that other researchers have reported slightly higher reductions in maximal HR at altitude as summarised, e.g., by Lundby et al. [7], resulting in potentially slightly lower correction factors. A spot check with two subjects from our cohort yielded a correction factor of +3.3% per 1000 m, so that we chose to reduce the running speeds v1, v2 and v3 uniformly by −3.3% and −7.8% at 1000 m and 2300 m AMSL, respectively. Importantly, the adequacy of this adjustment, aiming at comparable relative physiological efforts at the three running speeds despite the effects of acute hypoxia, was later reconfirmed by the RPE results of the ALT runs of all subjects (see Section 3 below).
2.3. Biomechanical and Physiological Measurements During ALTs
Before the v1 runs, LAC levels of the subjects were assessed applying the same procedure and instrumentation as in LAB CPET. In addition, LAC was measured after each bout at v1, v2 and v3. During those consecutive capillary blood samplings, RPE was collected in an identical fashion as in the LAB CPET procedure. Similarly, during all runs, the athletes wore the same smartwatches and chest straps for HR measurements as in the LAB CPET condition. Furthermore, the subjects were equipped with three synchronised inertial measurement units (IMUs) of the type Xsens MTw Awinda (Movella Inc., Enschede, the Netherlands), two worn at their distal tibiae and one at their sacrum. The IMUs collected tri-axial accelerations (±16 g; 1 g = 9.80665 m s^−2^), angular velocities (±2000° s^−1^) and Euler angles at an internal data sampling rate of 1000 Hz and converted them to a time-continuous data stream of 120 Hz through strap-down integration and sensor fusion. These time series were transmitted to the receiving base station of the accompanying cyclist or runner using the 2.4 GHz band with a range of 50 m in free space. The employed IMUs have been widely used and validated in sport sciences and biomechanical research, particularly under in-field conditions [18,19,52].
2.4. Data Post Processing
All continuous HR readings of an individual running bout were averaged over its duration using the manufacturer’s software (Garmin Connect, Garmin Ltd., Olathe, KS, USA). The tri-axial acceleration time series of the two tibial sensors and the sacral sensor were analysed following established running gait segmentation algorithms based on magnitude peak detection described in previous studies using LabVIEW 2025 Q1 64-bit (National Instruments Corp., Austin, TX, USA) [18,19,42]. The resulting PTA values in terms of 3D vector magnitude were averaged over the duration of a running bout by discarding an initialisation and finalisation margin of 15 s each. Using these mean PTA of the left (aL) and right shank (aR), the lateral asymmetry index (LA) for a specific bout of an individual was calculated as [18]
Because LA can take both signs, i.e., for higher PTA in the left leg and for higher PTA in the right leg, summing over LA of different individuals might numerically cancel out effects of external factors, and thus conceal them. Therefore, the absolute lateral asymmetry index aLA, i.e., the absolute value of LA, is considered in all group means instead of LA. Moreover, residual shock at the pelvis (RSh) was derived from the mean peak tibial and mean peak sacral (aSac) acceleration values through
Residual shock generally describes the portion of combined impact and active peak shock during stance phase that is transferred by the musculoskeletal system from the distal caudal joints and body segments, such as the ankles, to the more cranial body parts, e.g., pelvis, trunk and head. On this route, it is continuously dampened by the natural shock attenuation mechanisms of the human body, e.g., eccentric joint flexion, energy absorption of muscles, tendons and cartilage, and, conditionally, also active compensation. In this study, we analysed only the pelvic aspect of residual shock as defined by RSh.
CAD was obtained as the frequency of the combined left and right leg (and sacral) impact acceleration peaks in the continuous acceleration time series [53].
2.5. Statistical Analysis
All data were processed using Microsoft Excel 2021 (Microsoft Corporation, Redmond, WA, USA) and analysed using IBM SPSS Statistics (Version 29; IBM, Armonk, New York, NY, USA). Unless otherwise stated, tables show mean values and standard deviations (SDs). The Shapiro–Wilk test was used to test for normality, and the Mauchly test for sphericity. Primary analysis was conducted using a three-way analysis of variance with repeated measures (rmANOVA) and post hoc tests adjusted for multiple comparisons using the Bonferroni correction. If sphericity could not be assumed, the Greenhouse-Geisser correction was applied. The level of significance was set to p < 0.05. Effect sizes in the rmANOVA were assessed based on partial eta squared (ηp^2^) and rated according to Cohen: negligible for ηp^2^ < 0.01, small for 0.01 ≤ ηp^2^ < 0.06, medium for 0.06 ≤ ηp^2^ < 0.14, and large for ηp^2^ ≥ 0.14 [54]. Analogously, effect sizes in the (Bonferroni-corrected post hoc) t-test comparisons were calculated and evaluated according to Cohen’s d with negligible (d < 0.2), small (0.2 ≤ d < 0.5), medium (0.5 ≤ d < 0.8) and large effects (d ≥ 0.8) [54].
3. Results
During the LAB CPET incremental treadmill test, the participants achieved a mean maximum running speed of 17.0 ± 1.7 km h^−1^ with an average relative oxygen uptake per body mass of = 54.9 ± 5.9 mL kg^−1^ min^−1^. Table 2 summarises further outcome variables and derived performance metrics of the LAB CPET.
Summarising the results of all ALT runs are presented in terms of detailed numerical data and test statistics in Table A1 in Appendix A1. The corresponding post hoc test results for the three-way rmANOVA are provided in Table A2 there. Figure 3 depicts the cohort’s mean for CAD, PTA, aLA and RSh as a function of altitude, running speed and running surface. Running speed had the most significant impact on all biomechanical metrics. There were also minor interactions noted between speed and elevation, as well as between speed and surface. However, the effect of elevation was only apparent in cadence. Meanwhile, surface conditions did not affect the biomechanical parameters.
The corresponding results for the control variables HR, LAC and RPE are shown and discussed in Appendix A2, essentially confirming that the perceived physiological effort in terms of RPE was practically identical between elevations for fixed other conditions within measurement uncertainty. The mean relative difference between the planned and the actually run speeds, as determined by GPS/GNSS tracking, was −1.1 ± 1.6% at v1 (i.e., the subjects actually ran slightly faster), +0.3 ± 2.0% (slightly more slowly) at v2 and +1.4 ± 2.7% at v3 (slightly more slowly).
Concerning the biomechanical metrics, CAD (Figure 3a) was unaffected by surface condition (p = 0.610; Table A1), whereas elevation (p < 0.001; ηp^2^ = 0.659) and running speed (p < 0.001; ηp^2^ = 0.894) exhibited both significant and strong effects (Table A1). Elevation-related changes were small, with only a slight but significant decrease from sea level to 2300 m AMSL (167 ± 8 vs. 165 ± 9 spm; p < 0.006). Running speed elicited robust increases in cadence across all levels (v1: 160 ± 7 spm, v2: 166 ± 9 spm, v3: 172 ± 9 spm; all p < 0.001) Table A2). Significant speed-elevation interactions revealed lower cadences at higher elevations, particularly at v1 (2300 vs. 1000 m AMSL) and v3 (1000 and 2300 vs. 50 m AMSL), with moderate-to-large effect sizes (Cohen’s d = −0.79 to −1.44; p < 0.034). Speed–surface interactions were minimal, with only one significant effect at v2 and 1000 m AMSL, cadence was moderately higher on TRAIL than ROAD (p < 0.07). All other interaction effects were non-significant.
PTA (Figure 3b) was largely affected by the main factor running speed (p < 0.001, ηp^2^ = 0.926; Table A1), but neither by elevation (p = 0.197) nor surface (p = 0.614) alone. However, there were significant interaction effects between running speed and elevation (p < 0.001, ηp^2^ = 0.503) and running speed and surface (p = 0.003, ηp^2^ = 0.477). Other interactions were not significant (Table A1). Specifically, PTA was 7.8 ± 1.6 g at v1, 10.6 ± 1.8 g at v2 and 12.5 ± 1.6 g at v3, with all differences being highly significant (p < 0.001; Table A2). Comparing surface results, mean PTA, averaged across all elevations and running speeds, was similar on ROAD (10.2 ± 2.1 g) and TRAIL (10.5 ± 1.4 g; Table A2). Similarly, PTA was comparable between elevations, amounting to 10.7 ± 1.9, 10.2 ± 1.5 and 10.1 ± 1.6 g at 50, 1000 and 2300 m AMSL, respectively (Table A2). Interaction analyses indicated that elevation-related reductions in PTA occurred only at higher running speeds and exclusively on ROAD. Specifically, PTA was lower at v2 at 1000 m (−5.4%) and 2300 m AMSL (−10.4%) compared with 50 m AMSL, and at v3 at 2300 m AMSL (−11.9%), with moderate to large effect sizes (Cohen’s d = −0.73 to −1.11; p ≤ 0.048). No further significant interaction effects were observed.
Considering aLA (Figure 3c), none of the factors elevation (p = 0.664), running speed (p = 0.058) or surface (p = 0.150) exhibited a significant influence on running gait symmetry (Table A1). There was a trend of smaller asymmetries at higher speeds, with mean absolute asymmetries of 9.3 ± 4.6%, 8.2 ± 2.7% and 6.9 ± 2.3% at v1, v2 and v3, respectively, although not reaching significance (Table A1 and Table A2). Mean values were comparable across elevations (50 m: 8.0 ± 4.6%, 1000 m: 7.5 ± 4.7%, 2300 m AMSL: 8.9 ± 2.0%; all p = 1.000) and did not differ significantly between ROAD and TRAIL (9.5 ± 4.9% vs. 6.8 ± 3.0%; p = 0.150; Table A2).
Similarly to PTA, RSh (Figure 3d) was strongly affected by running speed (p < 0.001; ηp^2^ = 0.897) and the interaction between speed and elevation (p < 0.001; ηp^2^ = 0.425), while the other main effects (p > 0.218) and interactions (p > 0.181) demonstrated no significant effect (Table A1). Particularly, increasing the speed significantly reduced RSh from 50.1 ± 8.0% at v1 to 41.2 ± 7.4% at v2 and 36.2 ± 7.6% at v3 (all pairwise post hoc comparisons with p < 0.001; Table A2). RSh was similar across elevations (41.1–44.3%) and between surface conditions (ROAD: 43.4 ± 9.1% vs. TRAIL: 41.6 ± 7.1%; Table A2), with no significant difference therein. Interaction analysis revealed significant elevation-related increases in RSh only at v3 on TRAIL, with higher values at 1000 m (+14.8%) and 2300 m AMSL (+8.4%) compared to sea level (p < 0.032). All other interaction effects were non-significant.
4. Discussion
The aim of this study was to systematically elucidate how acute hypoxia and surfaces specific to altitude training camps affect the biomechanical loading at the range of running speeds relevant to structured training in long-distance running. It was hypothesised that acute hypoxia may induce increases in CAD and PTA and a decrease in PTA asymmetry. No hypotheses as to the spatiotemporal gait structure and the associated biomechanical loading in terms of CAD, PTA and between-leg lateral asymmetry were possible, leaving this aspect open to direct exploration in this study.
First, in terms of perceived exertion, acute altitude did not exhibit a statistically significant effect on RPE, confirming that the adjustment of running speeds at altitude conditions (i.e., −3.3% and −7.8% at 1000 and 2300 m AMSL, respectively; see above) as derived from the literature and a prior spot check was indeed successful in inducing a comparable subjective physiological effort at different elevations and thus oxygen partial pressures. In view of this, it seems reasonable to postulate that reducing running speeds by roughly −3% per +1000 m in elevation gain may compensate for the—subjectively—higher physiological effort at altitude. For a running pace of, e.g., 4:15 min km^−1^, this would imply a reduction in pace to 4:30 min km^−1^ at 2000 m AMSL, thus approximately +15 s per kilometre, which is in good quantitative agreement with current coaching procedures. Moreover, in terms of the effect of surface, the study outcome suggests that the athletes did not perceive trail or road conditions as a particularly strenuous factor for the submaximal running speeds given.
Second, regarding the spatiotemporal structure of running gait, running speed was found to strongly affect cadence, with an average increase of +2.2 spm per +1 km h^−1^, which is in formidable numerical accordance with the recent literature [53,55]. Statistically, elevation also exerted a strong effect on cadence, but the drop in cadence by −2.2 [−3.7, −0.7] spm from sea level (166.8 spm) to 2300 m AMSL (164.6 spm), i.e., −1.0 spm per +1000 m in elevation, was numerically small (−1.3%; Cohen’s d = −0.22) and fell within the margin of experimental uncertainty due to the speed adjustment and the practically inevitable small differences in total vertical metres between the courses. The observed slight numerical differences in cadence at different elevations at fixed speed and surface conditions are thus likely to possess limited practical relevance. Moreover, surface did not substantially affect step frequency, neither as a main factor nor in interactions, yielding practically equivalent results in road running and trail running for a given speed and elevation. This suggests that the potentially decreasing effect of a more compliant surface on cadence (even asphalt vs. even turf), as recently reported by Moon et al. [21], may be cancelled out in trail running practice by an increase in PTA due to the inherent bumpier surface properties. Therefore, in view of our results, it can be concluded that the effect of uneven surface conditions on cadence is likely to play as decisive a role as mechanical surface compliance, but in the opposite direction.
As for biomechanical loading metrics, PTA demonstrated a strong dependence on running speed, with an average increase of +0.9 g per +1 km h^−1^, showing excellent numerical agreement with previous, laboratory-based studies [18]. Remarkably, neither elevation nor surface exerted significant main effects on PTA. However, there was a stable trend in road running of slightly to moderately lower PTA at higher elevations when combined with higher running speeds, which became significant for 1000 m and 2300 m vs. 50 m AMSL at v2 and for 2300 m vs. 50 m AMSL at v3. Although effect sizes and relative changes (−5%, −10% and −12%) remained within moderate ranges, this finding suggests that acute hypoxia does indeed induce some subtle changes in running gait structure on asphalt roads towards a potentially lower associated musculoskeletal loading at vigorous running speeds beyond the first ventilatory threshold. Given that this effect was observed only on asphalt and not in trail running, the underlying mechanisms are currently speculative. Possibly, a slight, subconscious adaptation in running gait may take place under acute hypoxia in order to match a new metabolic optimum under altered external conditions, perhaps similar to an effect that has been reported for hypogravity [42]. These changes may perhaps stay concealed in trail running because of the less stable spatiotemporal gait structure there. While this is highly speculative, it is evident that the observed phenomenon of lower PTA at altitude on ROAD at faster running speeds is unlikely to be a methodological artefact caused by the speed adjustments at altitude: Firstly, those adjustments (−3.3% at 1000 m AMSL and −7.8% at 2300 m; see above) were only approximately half the size of the observed drops in PTA. Secondly, the effect of lower PTA at altitude was absent at v1 on ROAD and, remarkably, also at all speeds on TRAIL. Furthermore, the numerically negligible trend towards lower cadences at altitude, particularly on ROAD, does not possess the effect size to explain the observed reductions in PTA either. Irrespective of this, the experimental outcome that road running and trail running result in virtually identical PTA metrics at a given running speed and elevation challenges the common presumption that running on trails may impose lower impact loading than on asphalt. Nonetheless, this outcome of the present study is in line with previous research that found that running speed is substantially more decisive than surface [18], and that asphalt, grass and tartan tracks induce practically the same PTA for a given running speed [18,21]. In terms of practical implications for altitude training camps, this finding suggests that some of the typical exercising convictions may be worth revisiting, given that well-runnable roads may be more easily accessible than similarly even and gentle trails.
With regard to the absolute lateral asymmetry index, all results across running speeds, elevations and surface conditions, stayed within the boundaries considered to be physiological in the pertinent literature [18]. Intriguingly, among all biomechanical and physiological measures investigated in this study, aLA was the only metric that remained fully unaffected by running speed, elevation and surface in terms of statistical significance. Despite not reaching statistical significance (p = 0.058), a tendency towards smaller absolute asymmetries with increasing speed was yet observable, a trend known from previous studies in well trained runners and trained amateur triathletes [18,24]. As to its explanation, it may be speculated that with increasing neuromuscular effort, the between-leg variance tends to reduce in order to optimise efficiency and avoid premature unilateral muscular fatigue. Nonetheless, the fact that aLA was essentially not altered to any substantial extent by the external factors in this study supports the notion that lateral asymmetry may be a rather stable intrinsic feature of individual running gait, at least for a given running speed and footwear condition [18,19,24]. In other words, focussing on practical relevance, this outcome implies that neither acute hypoxia nor changes in running surface during an altitude training camp should be a cause for concern with regard to a potential deterioration of existing between-leg loading asymmetries.
Finally, residual shock at the pelvis exhibited a strong reduction by running speed throughout elevations and surfaces, suggesting that at faster speeds, the internal attenuation of tibial impact shock by the ankle, knee and hip joints substantially increases in magnitude. This finding is in line with previous laboratory-based studies, as was the range of RSh values observed in this study [18,24]. Remarkably, RSh was practically the same in road and trail running, another finding that has the potential to question the common belief of purportedly less impact loading on natural surfaces compared to paved asphalt roads. Moreover, acute hypoxia did not substantially impact shock attenuation, with the only, rather moderate increases in RSh observed in trail running at the fastest speed at sea level vs. 1000 m and 2300 m AMSL, respectively. While it could be speculated, somewhat in line with the hypothesis that PTA might be slightly reduced at higher speeds at altitude, that a slightly higher physiological demand of running under acute hypoxia might have a diminishing effect on non-essential, comfort-related features of running gait, the effect sizes of this observation are too small to warrant any practically meaningful interpretation.
From a practical training perspective, it remains important for coaches and athletes to note that running speed is one of the key factors for biomechanical changes, regardless of altitude conditions or different surfaces. Both cadence and PTA are strongly influenced by this, which can lead to increased biomechanical stress—and the risk of overuse injuries. This relation is substantially more important than the influence of altitude or surface. The absolute lateral asymmetry index seems to be less sensitive to external factors, as it remains practically unaffected by running speed, elevation and surface. The fact that virtually identical results for residual shock at the pelvis were obtained in asphalt and trail running should alert coaches that a supposedly “lower impact loading” of trail running seems questionable.
This study is subject to several limitations that must be accounted for. First, the relatively small sample size of 10 athletes results in a limited statistical power, increasing the likelihood of a type II error. Additionally, the sample size calculation was based on heart rate. Thus, for the biomechanical metrics, only a post hoc power analysis could be performed. Overall, the results related to surface showed no significant effects. This outcome is further supported by the post hoc power of the main effect of surface: CAD (power 0.065), PTA (0.076), RSh (0.120) and aLA (0.300). Due to the time constraints of the measurement trials, recovery phases between runs, particularly after runs at v3, may have been, in part, too short to allow for a full recovery back to baseline physiology in terms of HR and LAC. However, the randomisation of surface conditions among the subjects is thought to have minimised this bias, whereas randomising the running speeds for a fixed elevation and surface was not possible given the prolonged recovery times after v3. In addition, despite being similar, the topographical profiles of the running courses were neither identical between surface conditions nor between elevations, which may have impacted the biomechanical outcome to some—from our perspective still acceptable—extent. Finally, the slight adjustment of running speeds to yield akin ratings of perceived exertion at different elevations for a given running speed and surface helped to keep physiological loading comparable and ensure feasibility for all subjects. However, this adjustment might have slightly biased the exact quantitative interpretation of changes in the biomechanical metrics CAD, PTA and RSh. Nevertheless, the fact that the observed effects, if present and practically relevant, had a substantially higher magnitude than that of the speed adjustments supports our conception that this adjustment was a reasonable, and probably inevitable, trade-off between study objectives and study feasibility. In an ideal scenario, the ventilatory threshold of each subject would have been determined at each elevation using the same standardised treadmill setup. In practice, however, this is not feasible due to apparent technical and logistic constraints.
5. Conclusions
In conclusion, running speed seems to be the practically dominant factor defining biomechanical loading under acute hypoxia and varying surface conditions. In particular, the effect of acute altitude on PTA was found to be small and likely below the threshold of practical meaningfulness with respect to load measurement and injury prevention. In addition, trail running did not reduce PTA compared to running on asphalt surfaces, which may challenge some common beliefs among coaches. Moreover, between-leg asymmetry in running gait was not altered by elevation, surface or running speed. Shock attenuation also remained practically unaffected by elevation and surface conditions, but exhibited a positive association with running speed. In essence, coaches should prioritise controlling running speed rather than surface selection when managing biomechanical loading at altitude to optimise training and minimise injury risks.
The reference list from the paper itself. Each links out to its DOI / PubMed record.
- 1Wilber R.L. Current Trends in Altitude Training Sports Med.20013124926510.2165/00007256-200131040-0000211310547 · doi ↗ · pubmed ↗
- 2Mujika I. Sharma A.P. Stellingwerff T. Contemporary Periodization of Altitude Training for Elite Endurance Athletes: A Narrative Review Sports Med.2019491651166910.1007/s 40279-019-01165-y 31452130 · doi ↗ · pubmed ↗
- 3Bonetti D.L. Hopkins W.G. Sea-level exercise performance following adaptation to hypoxia: A meta-analysis Sports Med.20093910712710.2165/00007256-200939020-0000219203133 · doi ↗ · pubmed ↗
- 4Chapman R.F. Laymon Stickford A.S. Lundby C. Levine B.D. Timing of return from altitude training for optimal sea level performance J. Appl. Physiol.201411683784310.1152/japplphysiol.00663.201324336885 · doi ↗ · pubmed ↗
- 5Lundby C. Millet G.P. Calbet J.A. Bärtsch P. Subudhi A.W. Does ‘altitude training’ increase exercise performance in elite athletes?Br. J. Sports Med.20124679279510.1136/bjsports-2012-09123122797528 · doi ↗ · pubmed ↗
- 6Lundby C. Nielsen T.K. Dela F. Damsgaard R. The influence of intermittent altitude exposure to 4100 m on exercise capacity and blood variables Scand. J. Med. Sci. Sports 20051518218710.1111/j.1600-0838.2004.405.x 15885040 · doi ↗ · pubmed ↗
- 7Lundby C. Araoz M. van Hall G. Peak heart rate decreases with increasing severity of acute hypoxia High Alt. Med. Biol.2001236937610.1089/1527029015260854311682016 · doi ↗ · pubmed ↗
- 8Lundby C. Saltin B. van Hall G. The ‘lactate paradox’, evidence for a transient change in the course of acclimatization to severe hypoxia in lowlanders Acta Physiol. Scand.200017026526910.1046/j.1365-201x.2000.00785.x 11450136 · doi ↗ · pubmed ↗