Multi-Strain Probiotic Improves Tryptophan Metabolism and Symptoms in Chronic Fatigue Syndrome Patients with Co-Occurring Irritable Bowel Syndrome: An Open-Label Pilot Study
Cezary Chojnacki, Marta Mędrek-Socha, Jan Chojnacki, Anita Gąsiorowska, Ewa Walecka-Kapica, Michal Bijak, Karolina Przybylowska-Sygut, Tomasz Poplawski

TL;DR
A multi-strain probiotic improved gut health and reduced fatigue in women with chronic fatigue syndrome and irritable bowel syndrome.
Contribution
This study demonstrates that a high-dose probiotic can modulate the gut-kynurenine axis and reduce fatigue in CFS patients with IBS.
Findings
Fatigue scores decreased by 40.3% in patients after 12 weeks of probiotic use.
The probiotic improved the KYNA/QA ratio, indicating a shift toward neuroprotection.
3-indoxyl sulfate levels normalized to those seen in healthy controls.
Abstract
Chronic Fatigue Syndrome (CFS) is a debilitating condition often accompanied by gut health issues, but effective treatments are scarce. Recent research suggests that an imbalance in gut bacteria (dysbiosis) may contribute to CFS symptoms by producing harmful substances that affect the nervous system. We investigated whether a specific multi-strain probiotic (CDS22-formula) could improve symptoms in women with CFS and co-occurring IBS. Over 12 weeks, patients took a high-dose probiotic supplement. We monitored their fatigue levels and analyzed urine samples to track changes in tryptophan metabolism—a key pathway linking the gut to the brain. The results showed that the probiotic intervention was associated with an improved gut bacteria profile. Importantly, this coincided with a reduction in neurotoxic metabolites and a significant decrease in fatigue severity. Our findings suggest that…
Genes, proteins, chemicals, diseases, species, mutations and cell lines named across the full text — each resolved to its canonical identifier and authoritative record.
Click any figure to enlarge with its caption.
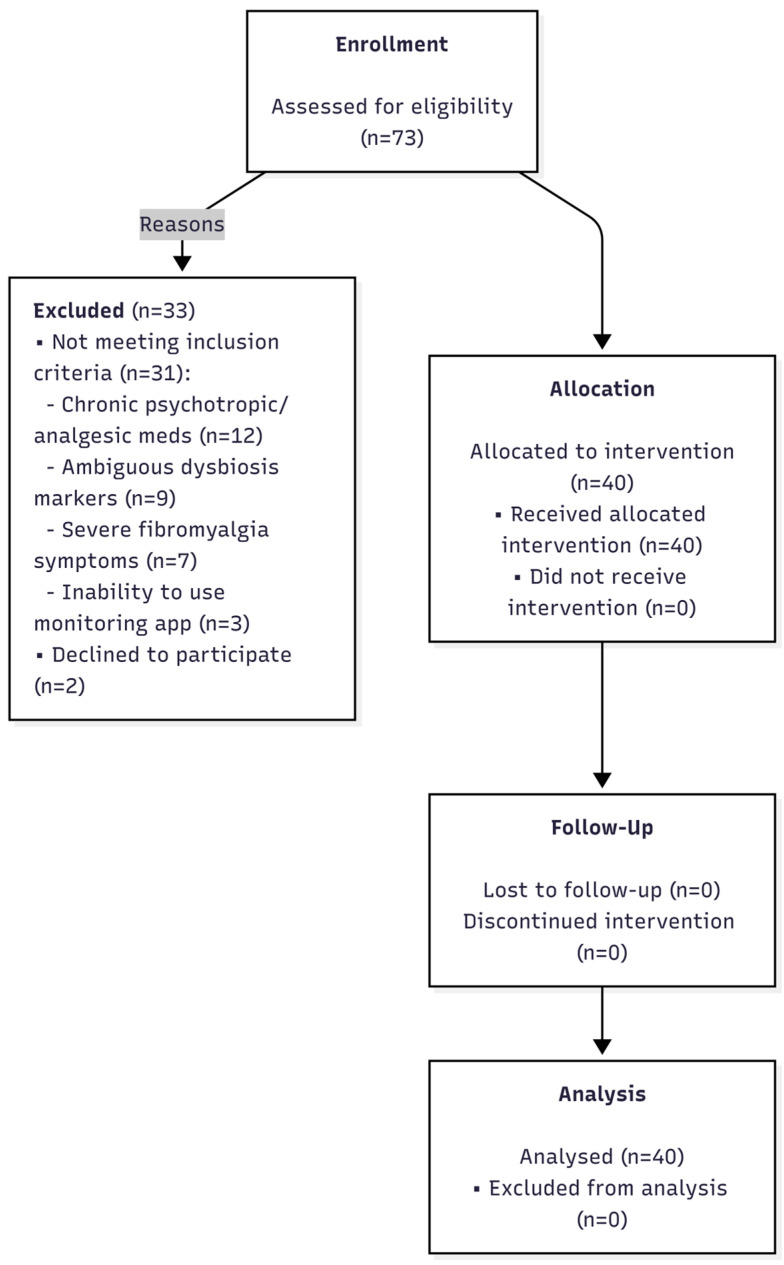 Figure 1
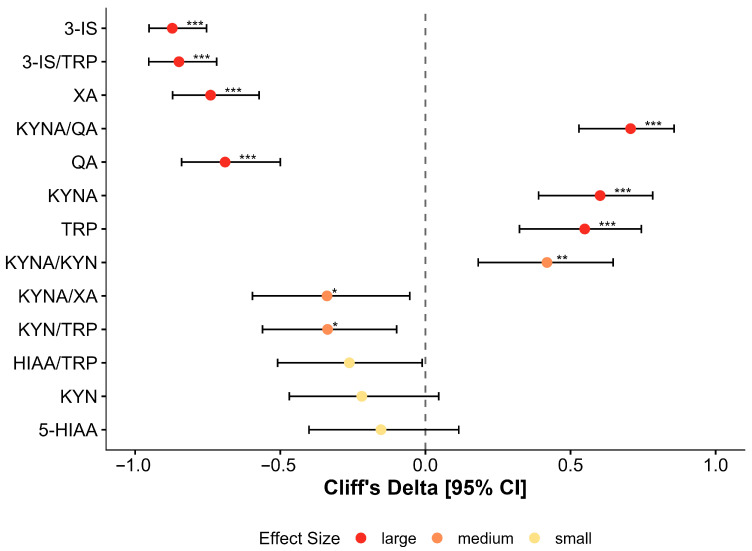 Figure 2
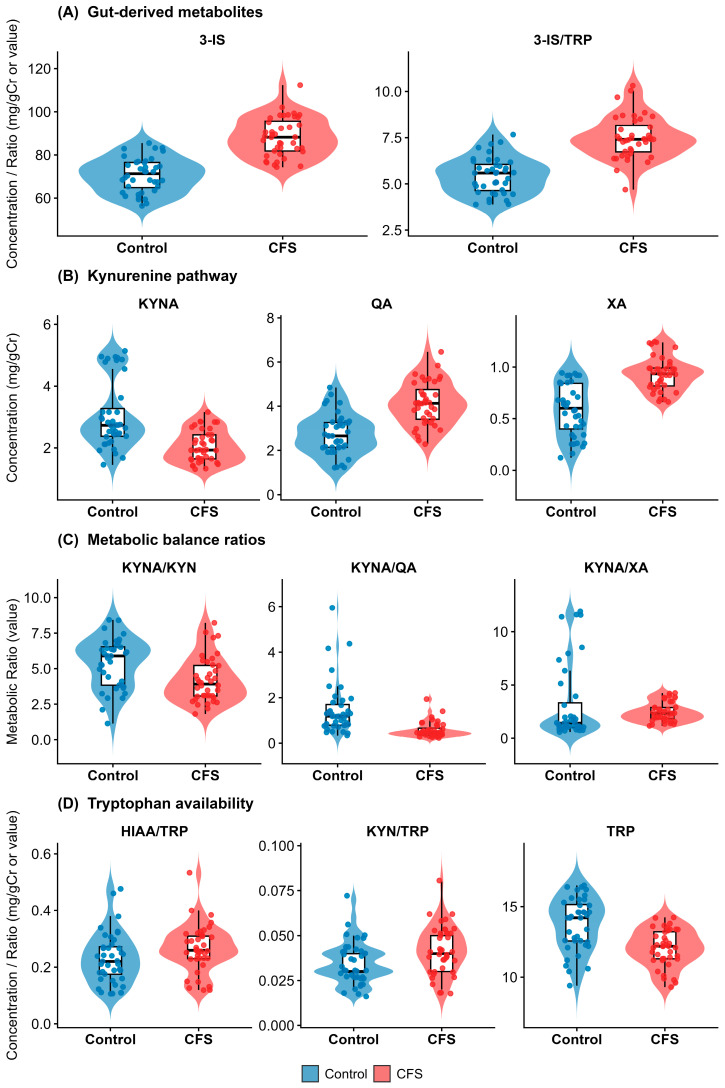 Figure 3
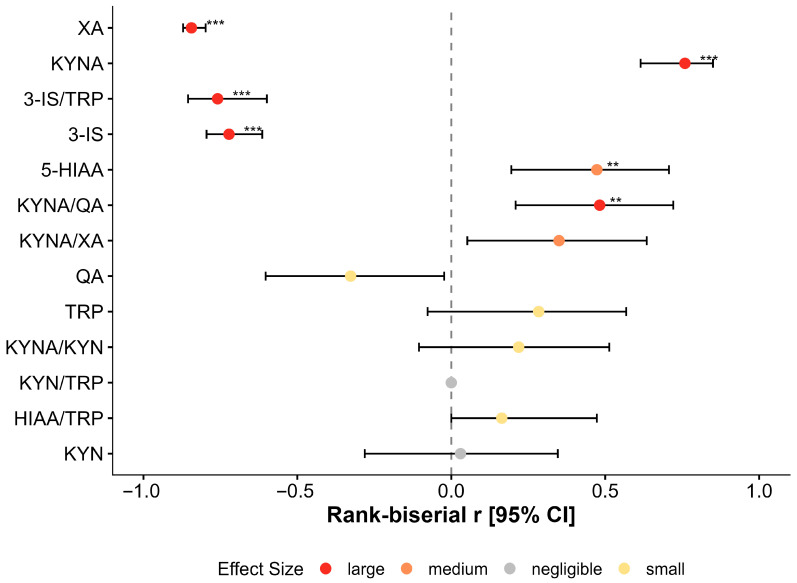 Figure 4
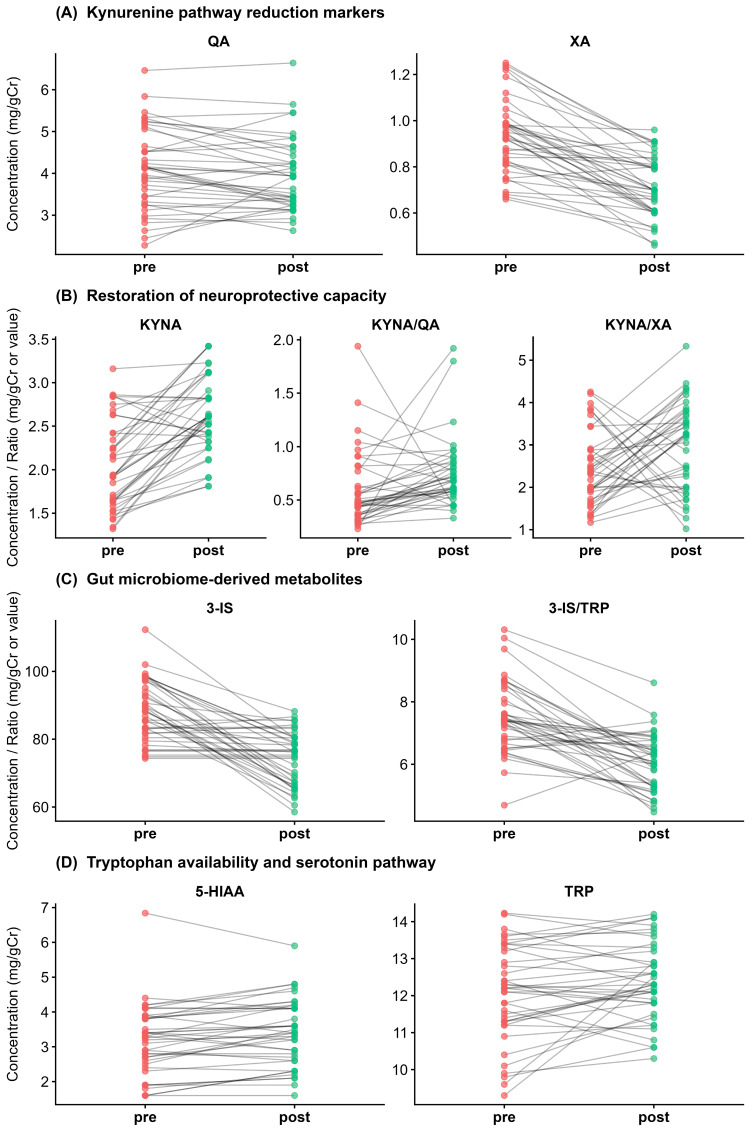 Figure 5
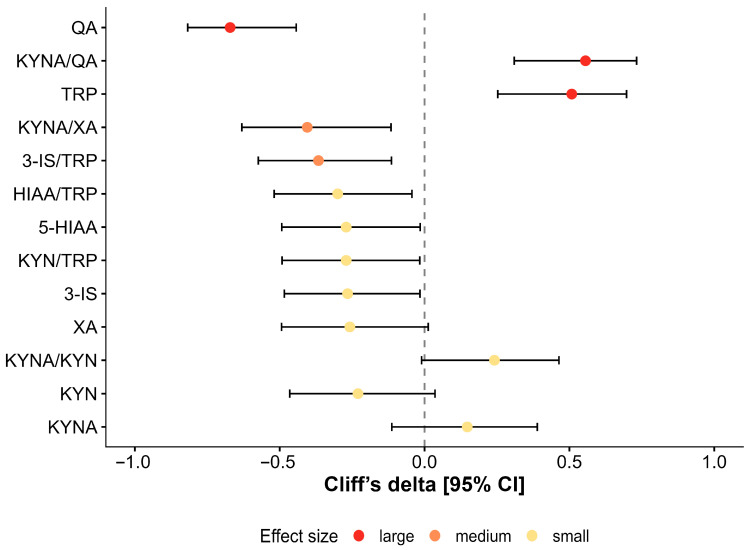 Figure 6
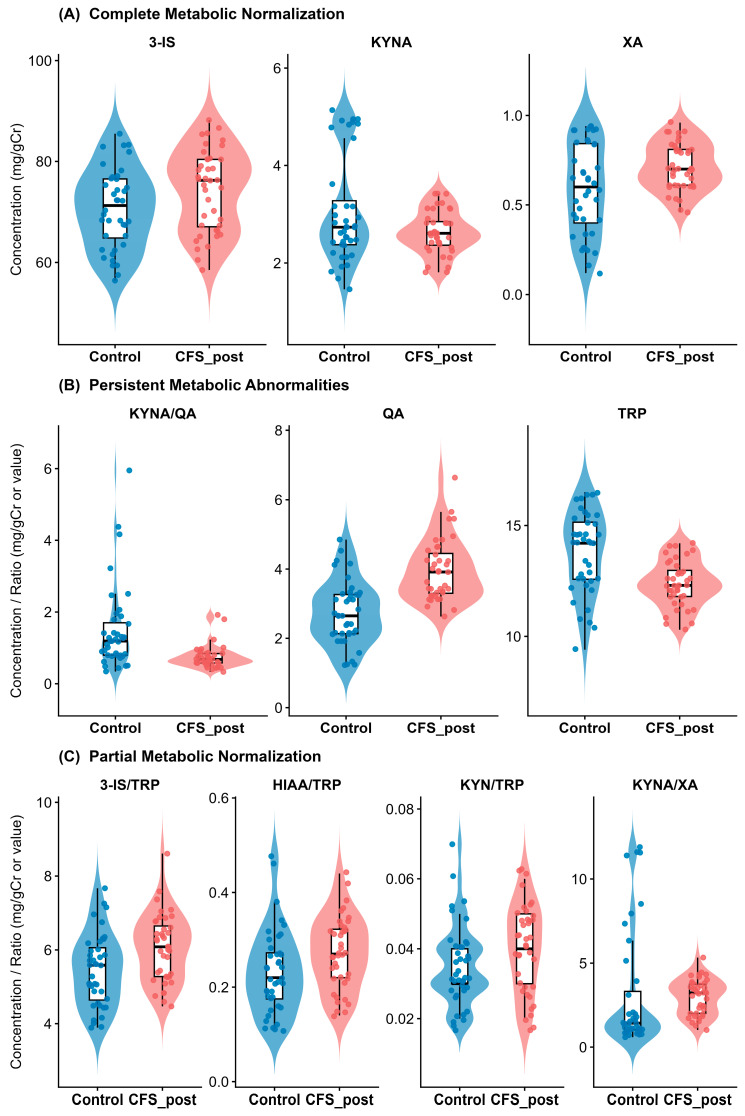 Figure 7
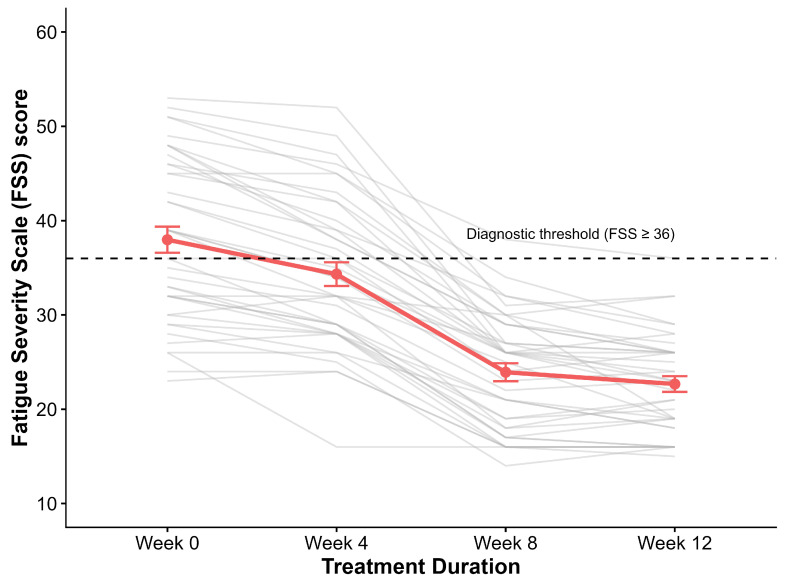 Figure 8
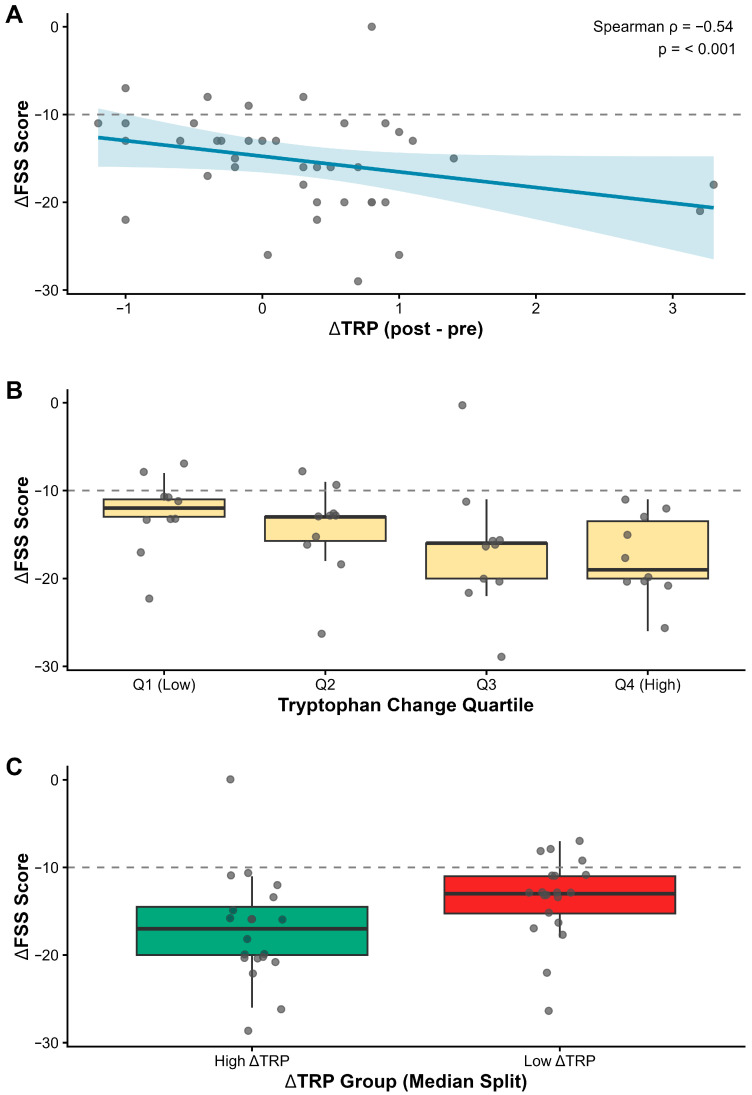 Figure 9
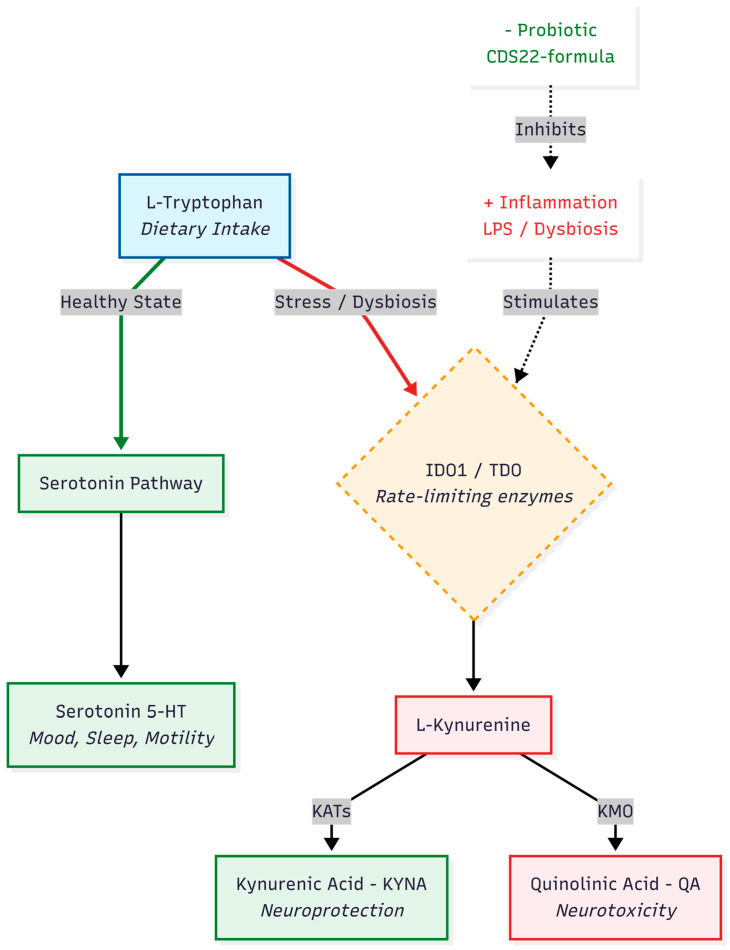 Figure 10
- —Medical University of Lodz
- —ALAB Laboratories
Peer Reviews
No public reviews on file for this paper yet. If you reviewed it on a platform where reviews are public (OpenReview, ICLR, NeurIPS, ICML), you can paste yours below so the community can read it here.
Videos
No videos yet. Explain this paper in a talk, walkthrough, or lecture? Add one.
Taxonomy
TopicsTryptophan and brain disorders · Fibromyalgia and Chronic Fatigue Syndrome Research · Gastrointestinal motility and disorders
1. Introduction
Chronic fatigue manifests across various pathologies but serves as the primary, sometimes isolated, symptom of Chronic Fatigue Syndrome (CFS) [1,2]. Characterized by persistent or recurrent exhaustion, the syndrome’s diagnostic criteria have undergone repeated modification [3,4]. While historical classifications framed CFS as a psychosomatic or inflammatory disorder [5], recent investigation has shifted toward gut microbiome alterations (dysbiosis) [6,7]. Despite this focus, a definitive causal relationship remains elusive [8,9].
Data regarding specific bacterial populations are inconsistent; studies have reported increases in both pro- and anti-inflammatory strains [10,11,12]. A prevailing hypothesis posits that low-grade intestinal inflammation compromises barrier integrity, facilitating the translocation of bacterial and dietary antigens into the systemic circulation [13,14,15]. Elevated serum antibacterial antibodies and pro-inflammatory cytokines in CFS patients support this inflammatory model [16,17], yet evidence linking specific dysbiotic profiles to pathogenesis remains mixed.
“Dysbiosis” is traditionally defined by quantitative shifts in bacterial composition, diversity, or the ratio of commensal to pathogenic species [18,19,20,21]. However, taxonomic profiles do not always predict functional output [22]. As indicated by our previous study [23], structural microbiome changes often fail to correlate with metabolic activity. While metagenomic assessments in CFS patients yield conflicting results—some showing species overgrowth, others depletion—metabolic markers paint a more consistent picture. Independent of specific bacterial abundance, metabolic assessments (hydrogen/methane breath tests) and urinary markers (hippuric acid, indoxyl) frequently indicate functional bacterial overgrowth [23]. Crucially, this metabolic shift coincides with the overproduction of neurotoxic tryptophan metabolites, specifically xanthurenic and quinolinic acid. Since gut dysbiosis is a shared pathophysiological core linking enteric symptoms (IBS) with systemic neurotoxicity (CFS), we purposely recruited patients presenting with this overlapping phenotype to target the gut–brain axis directly.
These discrepancies between taxonomic structure and metabolic function necessitate a targeted therapeutic intervention. Probiotics, particularly those with anti-inflammatory properties, remain a primary treatment strategy [24,25]. This study investigates the association between a high-concentration, multi-strain probiotic intervention (CDS22 formula) and the modulation of neuroactive tryptophan metabolites in CFS patients with co-occurring IBS-U. Specifically, we aimed to determine whether restoring gut eubiosis correlates with a shift from neurotoxic to neuroprotective kynurenine pathway activity and a reduction in fatigue severity.
2. Materials and Methods
2.1. Participants and Study Design
A total of 73 patients presenting with overlapping symptoms of IBS and chronic fatigue were screened for eligibility at the Department of Gastroenterology outpatient clinic. Following detailed medical and laboratory evaluation, 33 candidates were excluded. The primary reasons for exclusion were chronic use of medications affecting the nervous system or gut motility (n = 12), ambiguous dysbiosis markers not meeting the threshold (n = 9), predominance of severe fibromyalgia pain (n = 7), and technical inability to comply with app-based monitoring (n = 3). Two additional patients declined participation. Ultimately, 40 female patients meeting all inclusion criteria were enrolled and completed the full 12-week intervention protocol. No dropouts or serious adverse events necessitating withdrawal were recorded. However, transient mild-to-moderate constipation and bloating were reported by 6 patients (15%) in the second week. These were successfully managed with temporary lactulose or macrogol supplementation (resolved within 3 days) without interrupting the probiotic regimen. The flow of participants through the study is depicted in Figure 1 (CONSORT Flow Diagram).
The study enrolled 40 female patients aged 29–56 years (mean 38.3 ± 7.1), recruited and treated between 2019 and 2025. The control group comprised 40 age-matched healthy women (mean 39.1 ± 11.3). Recruitment and diagnostic procedures were conducted at the Department of Gastroenterology and outpatient clinic of the Central Hospital of the Medical University in Lodz.
Patients presented with chronic fatigue, sleep disturbances, and abdominal symptoms persisting for 3 to 11 years. Inclusion required confirmed gut dysbiosis and tryptophan metabolism disorders [23] in the absence of abnormalities in routine laboratory profiles. Organic gastrointestinal, neurological, and psychiatric pathologies were ruled out via comprehensive laboratory and endoscopic evaluation, including histological assessment of duodenal and colonic mucosa.
Based on symptom variability and the lack of correlation between pain and defecation, patients were diagnosed with the unclassified subtype of irritable bowel syndrome (IBS-U) according to Rome IV Criteria [26,27]. Fatigue status and severity were quantified using the Chalder Fatigue Scale (CFQ-11) and the Fatigue Severity Scale (FSS), while dysbiosis was assessed using both indirect (Organix Gastro) and direct (GA-map Dysbiosis Test) methods alongside urinary tryptophan metabolite profiling.
Exclusion criteria included age > 55 years; inflammatory diseases of the gastrointestinal tract; hepatic, pancreatic, renal, or thyroid dysfunction; lactose or gluten intolerance; and malnutrition or obesity. Patients using hormonal contraceptives, probiotics, or psychotropic medications were also excluded.
2.2. Fatigue Assessment
The severity of fatigue was evaluated using the Chalder Fatigue Scale (CFQ-11) [28]. This 11-item instrument assesses two dimensions of fatigue: physical (items 1–7, e.g., lack of energy, need for rest, muscle weakness) and mental (items 8–11, e.g., difficulty concentrating, memory slips, finding words). Responses were recorded using a Likert scoring system (0–3), yielding a total score range of 0–33.
The impact of fatigue on daily functioning was quantified using the Fatigue Severity Scale (FSS) [29]. This 9-item questionnaire evaluates the interference of fatigue with physical activity, motivation, and social obligations. Participants rated each item on a 7-point scale (1 = strongly disagree, 7 = strongly agree). The total score ranges from 9 to 63, with higher scores indicating greater functional impairment. Both instruments were administered at baseline to confirm eligibility for the IBS-CFS group.
2.3. Laboratory Tests
Baseline biochemical and serological assessments were performed to exclude confounding metabolic, endocrine, or inflammatory pathologies. The screening panel included hematology (hemoglobin, HbA1c); renal function (urea, creatinine); liver function (bilirubin); and electrolytes (magnesium, potassium). Nutritional and hormonal status was assessed via serum iron, vitamin D3 (25-OH-D), vitamin B12, folic acid, TSH, fT3, fT4, FSH, and 17-β-estradiol. Celiac disease was ruled out using tissue transglutaminase (anti-tTG) and deaminated gliadin peptide (anti-DGP) antibodies. Systemic and intestinal inflammation was evaluated via C-reactive protein (CRP) and fecal calprotectin, respectively.
Urinary analysis focused on quantification of bacterial and tryptophan metabolites. First-morning void urine samples were collected on an empty stomach into sterile containers stabilized with 0.1% hydrochloric acid.
Gut microbial metabolites were assessed using the Organix Gastro profile (ALAB Laboratories, Warsaw, Poland). This panel quantified 11 organic acids, including p-hydroxyphenylacetic acid (HPA), hippuric acid (HA), and 3-indoxyl sulfate (3-IS), which serve as markers of intestinal bacterial overgrowth. Analysis was performed using gas chromatography–tandem mass spectrometry (GC-MS/MS).
Tryptophan metabolism was evaluated using the Organix Neuro panel (ALAB Laboratories). Concentrations of tryptophan (TRP) and its downstream metabolites—5-hydroxyindoleacetic acid (5-HIAA), kynurenine (KYN), kynurenic acid (KYNA), xanthurenic acid (XA), and quinolinic acid (QA)—were determined via liquid chromatography–tandem mass spectrometry (LC-MS/MS) utilizing an Agilent Technologies liquid chromatograph (Agilent Technologies, Santa Clara, CA, USA) coupled to a Waters mass spectrometer (Waters Corporation, Milford, MA, USA). Data acquisition and processing were conducted using Analyst 1.5.2 software.
Urine samples were collected during the follicular phase at baseline and after 12 weeks of probiotic intervention. Metabolite concentrations were normalized to urinary creatinine and expressed as milligrams per gram of creatinine (mg/gCr). To ensure pre-analytical validity, participants observed a 4-week washout period for antibiotics and probiotics and restricted dietary tryptophan intake to 15 mg/kg/day for three days prior to sampling.
2.4. Direct Dysbiosis Assessment (GA-Map™ Technology)
Gut microbiota composition and the degree of dysbiosis were assessed using the standardized, commercially available GA-map™ Dysbiosis Test (Genetic Analysis AS, Oslo, Norway) [30]. All analyses were performed externally by a certified reference laboratory (ALAB Laboratories, Warsaw, Poland) employing the complete, licensed manufacturer’s platform (marketed locally by ALAB Laboratories as the FloraGen panel) (ALAB Laboratories, Warsaw, Poland).
The assay utilizes 54 DNA probes targeting variable regions (V3–V9) of the bacterial 16S rRNA gene. These probes specifically identify over 300 bacterial taxa across six phyla: Actinobacteria, Bacteroidetes, Firmicutes, Proteobacteria, Tenericutes, and Verrucomicrobia. Hybridization was performed on the Luminex MAGPIX platform (Luminex Corporation, Austin, TX, USA).
Raw data processing and dysbiosis calculation were conducted exclusively via the GA-map™ Analyzer Software v1.4. This software employs a proprietary, closed-source algorithm developed and validated by Genetic Analysis AS to generate the Dysbiosis Index (DI). The study authors played no role in the development, modification, or calculation of this algorithm. The DI is a categorical score ranging from 1 to 5, defined against a normobiotic reference population:
DI 1–2: Normobiosis (non-dysbiotic profile).
DI > 2: Dysbiosis (3 = mild, 4 = moderate, 5 = severe).
Shannon alpha diversity was automatically calculated by the same software platform to provide a standardized measure of microbial richness and evenness.
Fecal samples were collected by participants into sterile, pathogen-free containers on the morning of the scheduled diagnostic visit. In strict adherence to the GA-map™ manufacturer’s validation for stability, samples were stored at ambient temperature (20–22 °C) for no longer than 7 days prior to analysis. This pre-analytical protocol is certified for the preservation of microbial DNA integrity in this specific assay.
2.5. Probiotic Intervention Protocol
Following the confirmation of intestinal dysbiosis via both direct and indirect assessments, participants were enrolled in a targeted probiotic intervention. The study utilized the De Simone Formulation (DSF), marketed as Vivomixx^®^ (currently rebranded as the CDS22 formula, Mendes S.A., Lugano, Switzerland). This poly-biotic preparation contains 450 billion colony-forming units (CFU) of eight specific, live bacterial strains: Streptococcus thermophilus DSM24731, Bifidobacterium breve DSM24732, Bifidobacterium longum DSM24736, Bifidobacterium infantis DSM24737, Lactobacillus acidophilus DSM24735, Lactobacillus plantarum DSM24730, Lactobacillus paracasei DSM24733, and Lactobacillus delbrueckii subsp. bulgaricus DSM24734.
The preparation is devoid of gluten, lactose, and genetically modified organisms, holding both Generally Recognized As Safe (GRAS, USA) and Qualified Presumption of Safety (QPS, EU) status. Sachets were stored at 2–8 °C to ensure viability.
The study was conducted as a prospective, open-label clinical trial. Patients were administered one sachet (450 billion CFU) daily in the morning for a period of 12 weeks. Compliance and tolerability were monitored via dietary diaries submitted at weeks 4, 8, and 12. Clinical status was reassessed at these time points using the fatigue severity questionnaires. The primary biochemical endpoint—profiling of urinary tryptophan metabolites (Organix Neuro) and gut dysbiosis markers (Organix Gastro)—was evaluated at baseline and upon completion of the 12-week protocol.
2.6. Nutritional Control and Dietary Monitoring
To minimize the confounding impact of diet on microbiome composition and metabolite profiles, all participants followed a standardized nutritional protocol. Throughout the study, subjects maintained a habitual, normocaloric diet (approximately 2000 kcal/day) with a standardized macronutrient distribution (minimum daily intake: protein 50 g, carbohydrates 270 g, fat 70 g, and soluble fiber 30 g).
Strict pre-analytical dietary controls were implemented prior to biochemical testing. For three days preceding urine sample collection, dietary tryptophan intake was controlled and capped at 15 mg/kg body weight/day in both groups to reduce inter-individual variability in amino acid availability.
Adherence to dietary recommendations was verified through supervised dietary logs, reviewed regularly by trained dietitians via telephone and email. Nutrient intake, specifically amino acid content, was quantified using Kcalmar Pro-Premium software (Hermex, Lublin, Poland; 2024 version), which utilizes a database of over 2500 products and has been validated for nutritional assessment in Polish populations.
Patients received initial training on food logging and portion estimation. Data were reviewed weekly by certified clinical dietitians (M.M.-S., E.W.-K.) via standardized telephone consultations to ensure adherence to the macronutrient and tryptophan limits. Clinical assessments and fatigue questionnaires were administered by board-certified gastroenterologists (C.C., J.C., A.G.) who were blinded to the ongoing biochemical results. To ensure data validity and mitigate the limitations of self-reporting, entries were reviewed weekly by a clinical dietitian. Furthermore, the stability of urinary creatinine levels across time points served as an internal biochemical control, confirming consistent hydration status and dietary compliance during the intervention period.
2.7. Ethical Statement
The study was conducted as an open-label clinical trial in strict accordance with the Declaration of Helsinki and the International Council for Harmonisation Guidelines for Good Clinical Practice (ICH-GCP). Written informed consent was obtained from all participants prior to enrollment. The study protocol received formal approval from the Bioethics Committee of the Medical University of Lodz under resolutions RNN/176/18/KE (15 May 2018) and RNN/75/25/KE (15 April 2025).
Registration Statement: This study was not prospectively registered in a public clinical trial registry. Under Polish national law, clinical trial registration requirements—as defined by the Act of 9 March 2023 on Clinical Trials of Medicinal Products for Human Use (Ustawa z dnia 9 marca 2023 r. o badaniach klinicznych produktów leczniczych stosowanych u ludzi; Journal of Laws 2023, item 605) and EU Regulation No. 536/2014—apply exclusively to investigational medicinal products (produkty lecznicze). The intervention product used in this study (CDS22 formula, 450 billion CFU sachets) is officially registered as a dietary supplement (suplement diety) in the Register of Products Subject to Notification of First Marketing maintained by the Chief Sanitary Inspectorate (Główny Inspektorat Sanitarny, GIS) under entry No. 212378 (year 2025). As such, the study does not fall within the legal scope of clinical trial registration mandated for medicinal products. Official documentation from the GIS Register confirming the product’s classification as a dietary supplement has been provided to the Editorial Office. Despite the absence of a statutory registration requirement for dietary supplement intervention studies in Poland, the investigation was conducted with full ethical oversight and bioethics committee approval.
2.8. Statistical Analysis
All statistical analyses were performed using R software (version 4.5.1; R Foundation for Statistical Computing, Vienna, Austria) accessed via the RStudio integrated development environment (version 2025.09.2+418 “Cucumberleaf Sunflower”; Posit Software, PBC, Boston, MA, USA). Continuous variables are reported as median with interquartile range (IQR), and categorical variables as counts and percentages (%). Due to the non-Gaussian and skewed distribution of metabolite data, non-parametric tests were employed throughout.
2.8.1. Hypothesis Testing and Effect Sizes
Between-group differences (baseline CFS vs. controls; post-treatment CFS vs. controls) were assessed using the Wilcoxon rank-sum test (Mann–Whitney U). Within-group changes (pre- vs. post-treatment) were evaluated using the paired Wilcoxon signed-rank test. Median differences are reported with Hodges–Lehmann estimates and 95% confidence intervals (CIs). To quantify the magnitude of observed differences, effect sizes were calculated for all comparisons:
- Cliff’s delta (δ) for independent samples.
- Rank–biserial correlation (r_rb_) for paired samples.
- 95% CIs for effect sizes were generated via bootstrap resampling (B = 4000 replicates).
Interpretation followed established thresholds: negligible (|δ| < 0.147; |r_rb_| < 0.10), small (0.147 ≤ |δ| < 0.330; 0.10 ≤ r_rb_ < 0.30), medium (0.330 ≤ |δ| < 0.474; 0.30 ≤ |r_rb_| < 0.50), and large (|δ| ≥ 0.474; |r_rb_| ≥ 0.50).
2.8.2. Multiple Testing Correction
To control the family-wise error rate across the 13 primary metabolic endpoints (7 metabolites, 6 ratios), p-values were adjusted using the Benjamini–Hochberg False Discovery Rate (FDR) procedure. Adjusted q-values < 0.05 were considered statistically significant.
2.8.3. Clinical and Longitudinal Analysis
Longitudinal Fatigue Severity Scale (FSS) scores (weeks 0, 4, 8, 12) were analyzed using the Friedman test, followed by Bonferroni-corrected paired Wilcoxon post hoc contrasts. Clinical response was defined as a ≥10-point reduction (Minimally Clinically Important Difference, MCID) or a decrease below the diagnostic threshold (<36 points).
Associations between metabolic shifts (Delta) and clinical improvement (Delta FSS) were assessed using Spearman’s rank correlation. Dose–response relationships were probed using the Jonckheere–Terpstra trend test across quartiles of tryptophan change (Delta TRP).
2.8.4. Binary Outcomes
Changes in binary somatic symptoms were analyzed using McNemar’s test (with continuity correction or exact test for sparse data). Efficacy was quantified using Absolute Risk Reduction (ARR) and Number Needed to Treat (NNT). p-values for the four symptom endpoints were adjusted using the Holm method.
2.8.5. Visualization
Data distributions were visualized using raincloud plots (combining half-violin, boxplot, and jittered raw data). Paired changes were depicted using patient-level trajectory plots and alluvial diagrams. Effect sizes were summarized in forest plots.
3. Results
3.1. Baseline Characteristics and Safety Profile
Baseline assessment confirmed significant gut microbiome alterations in the CFS cohort. While healthy controls exhibited normobiosis with a Shannon Diversity Index (SDI) of 3.19 ± 0.83, patients demonstrated a markedly elevated Dysbiosis Index (DI) of 3.72 ± 1.28 and reduced bacterial diversity (SDI 2.23 ± 0.51; p < 0.001).
Routine biochemical, renal, and hepatic profiles were largely within physiological reference ranges. A specific deficit was observed in serum iron levels, which were significantly lower in CFS patients compared to healthy controls at baseline (93.0 ± 11.1 vs. 109.8 ± 12.7 µg/dL; p < 0.05). Following the 12-week probiotic intervention, serum iron levels increased significantly (p = 0.046), effectively restoring values to the range observed in the control group. Other metabolic and endocrine parameters remained stable throughout the intervention, confirming the safety and tolerability of the preparation (Table 1).
3.2. Baseline Tryptophan Metabolite Profile Distinguishes CFS from Healthy Controls
3.2.1. Overview of Metabolic Dysregulation
Quantitative profiling of seven tryptophan metabolites and six metabolic ratios revealed profound baseline alterations in CFS patients. Following Benjamini–Hochberg False Discovery Rate (FDR) correction, 10 of 13 analyzed variables differed significantly from healthy controls (q < 0.05). Notably, seven of these variables exhibited large effect sizes (δ ≥ 0.474), indicating a robust and consistent metabolic shift (Figure 2, Table 2).
3.2.2. Markers of Dysbiotic Tryptophan Catabolism
Patients demonstrated a marked upregulation of bacterial tryptophan metabolism. Urinary 3-indoxyl sulfate (3-IS) was elevated by 23.8% in the CFS group compared to controls (median: 88.18 vs. 71.25 µmol/L; p < 0.001), with a large effect size (δ = −0.872). Similarly, the 3-IS/TRP ratio, reflecting the diversion of tryptophan toward bacterial indole pathways, was increased by 32.6% (q < 0.001). These findings corroborate the dysbiosis confirmed by the GA-map™ analysis (Section 3.1) (Figure 3A).
3.2.3. Shift Toward Kynurenine Pathway Neurotoxicity
The kynurenine pathway exhibited a distinct pro-neurotoxic signature. Quinolinic acid (QA), a potent NMDA receptor agonist, was elevated by 55.8% in CFS patients (median: 4.13 vs. 2.65 µmol/L; q < 0.001). Conversely, the neuroprotective metabolite kynurenic acid (KYNA) was significantly reduced (1.93 vs. 2.74 µmol/L; q < 0.001). Xanthurenic acid (XA), a marker of vitamin B6-dependent kynurenine flux, was also elevated by 55.8% in the patient cohort (δ = −0.740; q < 0.001) (Figure 3B).
3.2.4. Imbalance of Neuroprotective Capacity
The functional balance between neuroprotection and neurotoxicity was severely compromised. The KYNA/QA ratio was reduced by 60.5% in CFS patients compared to controls (median: 0.47 vs. 1.19; δ = 0.707; q < 0.001), while the channeling of precursors toward xanthurenic acid (KYNA/XA ratio) was shifted in favor of XA (q = 0.012) (Figure 3C).
3.2.5. Substrate Availability and Serotonin Pathway
Urinary tryptophan (TRP) availability was significantly lower in CFS patients (δ = 0.549; q < 0.001). Despite this substrate deficit, the activation of the kynurenine pathway relative to tryptophan (KYN/TRP ratio) was increased (q = 0.011), suggesting enhanced IDO/TDO enzymatic activity. The serotonin pathway marker, 5-HIAA, did not differ in absolute concentration, but the 5-HIAA/TRP turnover ratio showed a borderline significant elevation (q = 0.052) (Figure 3D).
3.3. Treatment-Induced Changes in Tryptophan Metabolism
3.3.1. Overview of Treatment Response
Following the 12-week probiotic intervention, paired analysis demonstrated significant metabolic improvements in 6 of the 13 evaluated variables (q < 0.05). Five of these changes were characterized by large effect sizes (r_rb_ ≥ 0.50), indicating a robust physiological response to therapy (Table 3, Figure 4).
3.3.2. Attenuation of the Kynurenine Pathway
Treatment resulted in a marked downregulation of kynurenine pathway activation markers. Xanthurenic acid (XA) levels decreased by 25.1% (median: 0.94 to 0.70 mg/gCr), demonstrating a large effect size (r_rb_= −0.897; q < 0.001). Notably, this reduction was observed in 92.5% of patients (37/40). Quinolinic acid (QA) showed a nominal decrease (median: 4.13 to 3.92 mg/gCr; p = 0.038), but this change did not reach statistical significance after correction for multiple comparisons (q = 0.062) (Figure 5A).
3.3.3. Restoration of Neuroprotective Capacity
A significant upregulation of the neuroprotective branch was observed. Kynurenic acid (KYNA) increased by 35.2% (median: 1.93 to 2.61 mg/gCr; q < 0.001), with 82.5% of patients showing an elevate response. Consequently, the neuroprotective-to-neurotoxic ratio (KYNA/QA) improved significantly (median: 0.47 to 0.68; r_rb_ = 0.590; q = 0.006), reflecting a shift toward a more favorable metabolic profile (Figure 5B).
3.3.4. Reduction in Gut-Derived Metabolites
Markers of dysbiosis improved significantly. Urinary 3-indoxyl sulfate (3-IS) decreased by 13.5% (median: 88.18 to 76.25 mg/gCr; q < 0.001), and the 3-IS/TRP ratio declined by 17.8% (q < 0.001). These changes suggest a reduction in the bacterial catabolism of tryptophan within the gut lumen (Figure 5C).
3.3.5. Serotonin Pathway and Substrate Availability
Levels of 5-HIAA increased significantly post-treatment (median: 3.28 to 3.40 mg/gCr; q = 0.006), indicating enhanced serotonin turnover. Tryptophan (TRP) availability showed a trend toward increase, but this was not statistically significant (p = 0.073; q = 0.105) (Figure 5D).
3.4. Post-Treatment Metabolic Profile Relative to Healthy Baseline
3.4.1. Overview of Normalization Status
Comparison of post-treatment CFS patients (n = 40) with the healthy control baseline (n = 40) revealed a heterogeneous pattern of metabolic recovery. While 10 variables differed significantly at baseline, this number decreased to 6 post-treatment (q < 0.05). Crucially, the number of variables exhibiting large effect sizes (δ ≥ 0.474) dropped from seven to three, indicating substantial but incomplete restoration of metabolic homeostasis (Table 4, Figure 6).
3.4.2. Complete Normalization of Gut and Kynurenine Markers
Several key metabolites achieved levels statistically indistinguishable from healthy controls. Urinary 3-indoxyl sulfate (3-IS), a marker of dysbiosis, was fully normalized (CFS post: 76.25 vs. controls: 71.25 mg/gCr; q = 0.060), reducing the effect size from large at baseline (δ = −0.87) to small/negligible (δ = −0.27). Similarly, xanthurenic acid (XA) returned to the control range (q = 0.062), suggesting successful attenuation of excessive kynurenine pathway flux. Kynurenic acid (KYNA) levels, initially depressed, were restored and showed no significant difference from the controls (q = 0.258) (Figure 7A).
3.4.3. Persistent Neurotoxic Liability
Despite the improvements noted above, specific metabolic deficits remained refractory to treatment. Quinolinic acid (QA) remained significantly elevated in treated patients compared to controls (median: 3.92 vs. 2.65 mg/gCr; q < 0.001), retaining a large effect size (δ = −0.67). Consequently, the neuroprotective ratio (KYNA/QA) remained significantly lower than in healthy individuals (q < 0.001), indicating that the neurotoxic burden was reduced but not eliminated (Figure 7B).
3.4.4. Persistent Tryptophan Deficit
Tryptophan (TRP) availability failed to normalize. Post-treatment levels in CFS patients remained significantly lower than in controls (median: 12.30 vs. 14.20 mg/gCr; q < 0.001; δ = 0.51), suggesting ongoing substrate depletion or malabsorption despite probiotic supplementation (Figure 7C).
3.5. Progressive Reduction in Fatigue and Symptom Resolution
3.5.1. Fatigue Severity Scale (FSS) Trajectory
Probiotic intervention resulted in a continuous and highly significant reduction in fatigue severity across all time points (Friedman test: chi2 = 103.41, p < 0.001). The mean FSS score declined from 38.0 ± 8.8 at baseline to 22.7 ± 5.3 at week 12, representing a 40.3% reduction relative to baseline (Table 5). Post hoc pairwise comparisons confirmed significant improvements at weeks 4, 8, and 12 compared to baseline (all adjusted p < 0.001) (Figure 8).
3.5.2. Clinical Response Rates
By week 12, 39 of 40 patients (97.5%) achieved the diagnostic threshold for remission (FSS < 36), compared to only 18 (45.0%) at baseline. A Minimally Clinically Important Difference (MCID), defined as a reduction of ≥10 points on the FSS, was achieved by 35 patients (87.5%).
3.5.3. Somatic Symptoms and Tolerability
Gastrointestinal complaints, specifically bloating and abdominal pain, improved in the majority of participants. However, constipation showed a divergent pattern, worsening in 6 patients (15%) and necessitating temporary laxative use. Sleep disturbances were the most refractory symptom, persisting in the majority of the cohort despite the reduction in daytime fatigue. The probiotic preparation was otherwise well-tolerated (Table 6).
3.6. Tryptophan Availability Predicts Magnitude of Clinical Benefit
To investigate the biological basis of the observed clinical improvement, we analyzed the relationship between metabolic shifts and fatigue reduction. A significant negative correlation was identified between the increase in urinary tryptophan (ΔTRP) and the change in fatigue severity ΔFSS) (Spearman’s rho = −0.36, p = 0.024). This indicates that patients who experienced greater restoration of tryptophan availability achieved larger reductions in fatigue scores.
This relationship followed a monotonic dose–response pattern (Jonckheere–Terpstra trend test, p = 0.007). Patients in the highest quartile of tryptophan increase (ΔTRP > median) exhibited significantly greater clinical improvement compared to those in the lowest quartile (median ΔFSS: −18 vs. −12 points), reinforcing the hypothesis that normalizing substrate availability is a key driver of symptom relief (Figure 9).
4. Discussion
Current therapeutic strategies for CFS remain largely symptomatic. This reflects our incomplete understanding of the disease etiology [31,32]. Crucially, in the specific subgroup of patients with co-occurring IBS, gut microbiome dysbiosis acts as a driver of low-grade inflammation [6,7], and the precise causal mechanisms are still debated [8,9]. In this study, we demonstrated that a 12-week intervention with a multi-strain probiotic (De Simone Formulation) was associated with the correction of intestinal dysbiosis. More importantly, this microbiological improvement coincided with a functional shift in tryptophan metabolism that correlated with clinical symptom mitigation.
Baseline analysis confirmed that our patients—specifically recruited with a dysbiotic/IBS phenotype—exhibited reduced alpha diversity and an increase in pro-inflammatory taxa. This was metabolically mirrored by elevated urinary 3-IS. This excessive 3-IS production is a direct marker of bacterial tryptophan catabolism and implies increased intestinal permeability (“leaky gut”) [13,14,15]. Probiotic treatment effectively reduced 3-IS levels to the reference range observed in healthy controls. This suggests that the epithelial barrier was restored and proteolytic bacterial species were suppressed.
Our findings regarding the kynurenine pathway stand in contrast to some prevailing theories. Specifically, our patients exhibited elevated KYN/TRP ratios and high levels of downstream metabolites (XA, QA) at baseline. This indicates a robust activity of indoleamine 2,3-dioxygenase (IDO). Such data contradict the “Metabolic Trap” hypothesis, which assumes a functional block in IDO activity [33]. Instead, our results support a model of chronic, immune-mediated IDO activation, likely driven by persistent dysbiosis [34]. Tryptophan is essentially “stolen” from the serotonin pathway and shunted toward the kynurenine axis, leading to the observed substrate depletion, as illustrated in Figure 10.
The treatment effects were heterogeneous. We saw a robust reduction in xanthurenic acid (XA) and a marked increase in neuroprotective kynurenic acid (KYNA). However, quinolinic acid (QA) levels remained significantly elevated compared to controls. This persistence of QA, despite clear clinical improvement, is puzzling but interpretable. We argue that the absolute concentration of QA is less clinically relevant than its ratio to KYNA [35,36]. Since the intervention increased KYNA by 35%, the KYNA/QA ratio improved by nearly 45%. This suggests a functional neuroprotective blockade: the “antidote” (KYNA) increased enough to neutralize the neurotoxin (QA).
It is also possible that QA clearance is simply slower. QA accumulates in tissues [34]. While gut markers (3-IS) responded rapidly, the persistent urinary QA might reflect a gradual washout of tissue stores or saturation of the QPRT enzyme [37,38].
These metabolic shifts translated into tangible clinical benefits: 87.5% of patients achieved the Minimally Clinically Important Difference in fatigue. However, symptom resolution was not uniform. While fatigue and muscle pain improved, sleep disturbances persisted in the majority of the cohort. This suggests that peripheral metabolic realignment is sufficient to relieve physical fatigue, but central sleep regulation may require more targeted support. We also noted that 15% of patients developed constipation. While Bifidobacteria usually improve transit, alterations in serotonin availability via TRP metabolism changes can evidently affect motility in some individuals.
A critical consideration in interpreting these findings is the distinction between subjective symptom relief and objective metabolic modulation. While the reduction in FSS observed in this open-label trial could theoretically be influenced by the placebo effect or the natural fluctuation of chronic illness, the biochemical data suggest a specific biological mechanism of action. The placebo response typically manifests as a generalized stress reduction, potentially lowering cortisol-mediated TDO activation, but it is unlikely to induce the highly specific pattern of enzymatic shifts observed here—namely, the simultaneous upregulation of kynurenic acid and downregulation of xanthurenic acid. Furthermore, the significant reduction in urinary 3-indoxyl sulfate constitutes a microbiological marker of gut barrier integrity that is independent of host psychology. Thus, while the magnitude of clinical benefit should be viewed with caution given the study design, the consistency of the tryptophan pathway modulation provides strong evidence for a physiological, rather than purely psychogenic, effect of the intervention.
This study has limitations. First, while the sample size (n = 40) is relatively modest compared to large-scale population studies, the large effect sizes observed (Cliff’s δ > 0.47; rrb > 0.50) confirm that the study possessed sufficient statistical power to validate the primary metabolic endpoints. Secondly, it was an open-label trial, introducing potential placebo bias. Nevertheless, the rigorous quantification of objective biochemical markers provides a solid physiological basis for the observed changes. Also, measurements were restricted to urine; cerebrospinal fluid analysis would be needed to confirm central neurochemistry changes. Moreover, we strictly excluded confounding factors like high-protein diet [39] or hormonal contraceptives [40], which strengthens the validity of our metabolic findings. Consistent with this rigorous control, the study cohort was restricted exclusively to female participants. While this decision increased internal validity by minimizing the confounding influence of sex hormones on tryptophan metabolism, it limits the generalizability of our findings to the male CFS population. Thirdly, although macronutrient and tryptophan intake were controlled, the study did not strictly monitor dietary FODMAP content. As fermentable carbohydrates can influence gut microbiota activity and IBS symptoms, unmeasured variations in FODMAP intake remain a potential confounding factor. Finally, the durability of the observed metabolic shift after cessation of probiotic supplementation remains unknown. Future longitudinal studies are required to determine whether continuous supplementation is necessary to maintain the neuroprotective KYNA/QA balance.
5. Conclusions
Dysbiotic patients with CFS exhibit a metabolic signature of upregulated tryptophan catabolism and a shift toward neurotoxicity. Intervention with the CDS22 formula probiotic restores gut eubiosis and reinstates a neuroprotective balance (KYNA/QA), even if absolute quinolinic acid levels remain elevated. These metabolic corrections correlate with clinical remission, validating the gut–kynurenine axis as a therapeutic target.
The reference list from the paper itself. Each links out to its DOI / PubMed record.
- 1Holmes G.P. Kaplan J.E. Gantz N.M. Komaroff A.L. Schonberger L.B. Straus S.E. Jones J.F. Dubois R.E. Cunningham-Rundles C. Pahwa S. Chronic Fatigue Syndrome: A Working Case Definition Ann. Intern. Med.198810838738910.7326/0003-4819-108-3-3872829679 · doi ↗ · pubmed ↗
- 2Fukuda K. Straus S.E. Hickie I. Sharpe M.C. Dobbins J.G. Komaroff A. The Chronic Fatigue Syndrome: A Comprehensive Approach to Its Definition and Study Ann. Intern. Med.199412195395910.7326/0003-4819-121-12-199412150-000097978722 · doi ↗ · pubmed ↗
- 3Carruthers B.M. Jain A. De Meirleir K.L. Peterson D.L. Klimas N.G. Lerner A.M. Bested A.C. Flor-Henry P. Joshi P. Powles A.C.P. Myalgic Encephalomyelitis/Chronic Fatigue Syndrome: Clinical Working Case Definition, Diagnostic and Treatment Protocols J. Chronic Fatigue Syndr.200311711510.1300/J 092v 11n 01_02 · doi ↗
- 4Committee on the Diagnostic Criteria for Myalgic Encephalomyelitis/Chronic Fatigue Syndrome Board on the Health of Select Populations Institute of Medicine Beyond Myalgic Encephalomyelitis/Chronic Fatigue Syndrome: Redefining an Illness National Academies Press Washington, DC, USA 2015 Available online: https://www.ncbi.nlm.nih.gov/books/NBK 274235/(accessed on 10 February 2025)
- 5Tate W. Walker M. Sweetan E. Heliweli A. Peppercorn K. Edgar C. Blair A. Chatterjee A. Molecular Mechanism of Neuroinflammation in ME/CFS and Long COVID to Sustain Disease and Promote Relapses Front. Neurol.20221387777210.3389/fneur.2022.87777235693009 PMC 9174654 · doi ↗ · pubmed ↗
- 6Nagy-Szakal D. Williams B.L. Mishra N. Che X. Lee B. Bateman L. Klimas N.G. Komaroff A.L. Levine S. Montoya J.G. Fecal Metagenomic Profiles in Subgroups of Patients with Myalgic Encephalomyelitis/Chronic Fatigue Syndrome Microbiome 201754410.1186/s 40168-017-0261-y 28441964 PMC 5405467 · doi ↗ · pubmed ↗
- 7Fremont M. Coomans D. Massart S. De Meirleir K. High-Throughput 16S r RNA Gene Sequencing Reveals Alterations of Intestinal Microbiota in Myalgic Encephalomyelitis/Chronic Fatigue Syndrome Patients Anaerobe 201322505610.1016/j.anaerobe.2013.06.00223791918 · doi ↗ · pubmed ↗
- 8Armstrong C.W. Mc Gregor N.R. Lewis D. Butt H.L. Gooley P.R. The Association of Fecal Microbiota and Fecal, Blood Serum and Urine Metabolites in Myalgic Encephalomyelitis/Chronic Fatigue Syndrome Metabolomics 201713810.1007/s 11306-016-1145-z · doi ↗