Evolution of Retinal Morphology Changes in Amyotrophic Lateral Sclerosis
Valeria Koska, Stefanie Teufel, Aykut Aytulun, Margit Weise, Marius Ringelstein, Rainer Guthoff, Sven G. Meuth, Philipp Albrecht

TL;DR
This study found no significant retinal layer thickness changes in early ALS patients compared to healthy controls using optical coherence tomography.
Contribution
The study provides new evidence that OCT may not be effective for monitoring ALS progression in early stages.
Findings
No baseline differences in retinal layer thickness were observed between ALS patients and controls.
No significant thickness changes occurred in ALS patients over the observational period.
A negative correlation was found between retinal layer thinning and higher modified Rankin scale scores.
Abstract
Background/Objectives: To compare changes in the thickness of retinal layers between patients with amyotrophic lateral sclerosis (ALS) and healthy controls using optical coherence tomography. Amyotrophic lateral sclerosis is a degenerative disease of the upper and lower motoneurons with a rapidly progressive course, but non-motor symptoms such as decreased ocular motility and reduced visual acuity have also been reported. Specific biomarkers or surrogate parameters assessing neurodegeneration in ALS are of interest. Methods: In a retrospective, longitudinal study using optic coherence tomography of the retinal layers, we compared changes in the thickness of the layers between patients with ALS and healthy controls. Correlations to clinical scores, such as the modified ranking scale, were analyzed. Results: In our cohort of patients with early ALS (disease duration 5.15 ± 21.4 months at…
Genes, proteins, chemicals, diseases, species, mutations and cell lines named across the full text — each resolved to its canonical identifier and authoritative record.
Click any figure to enlarge with its caption.
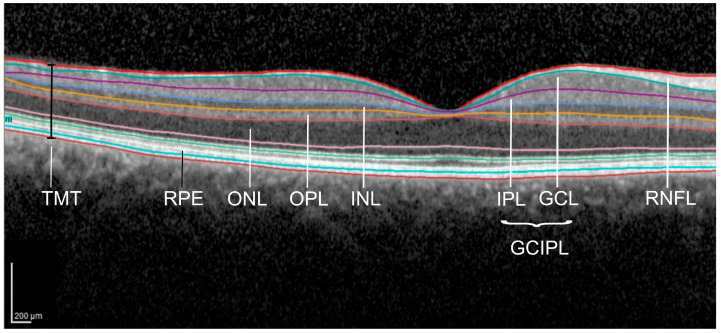 Figure 1
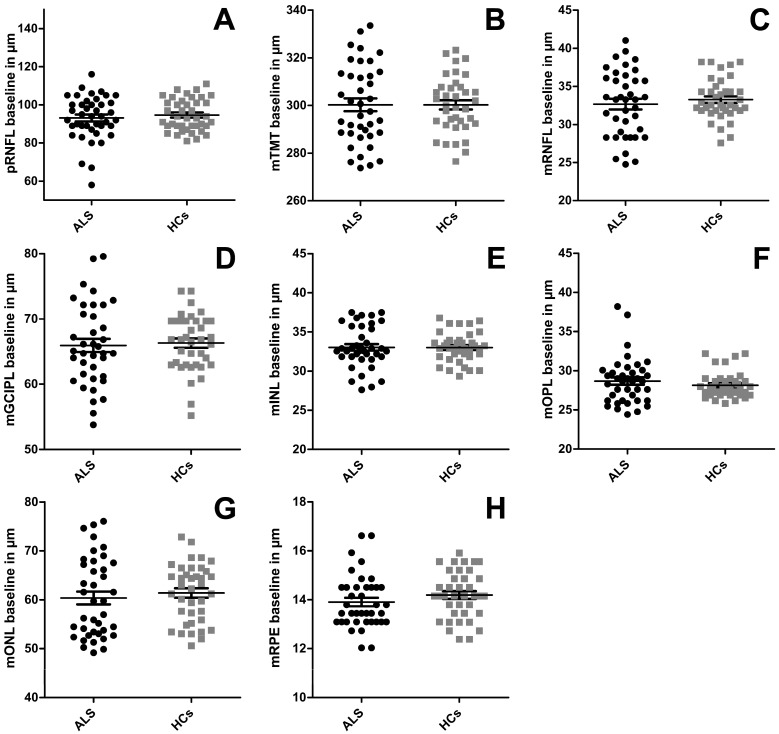 Figure 2
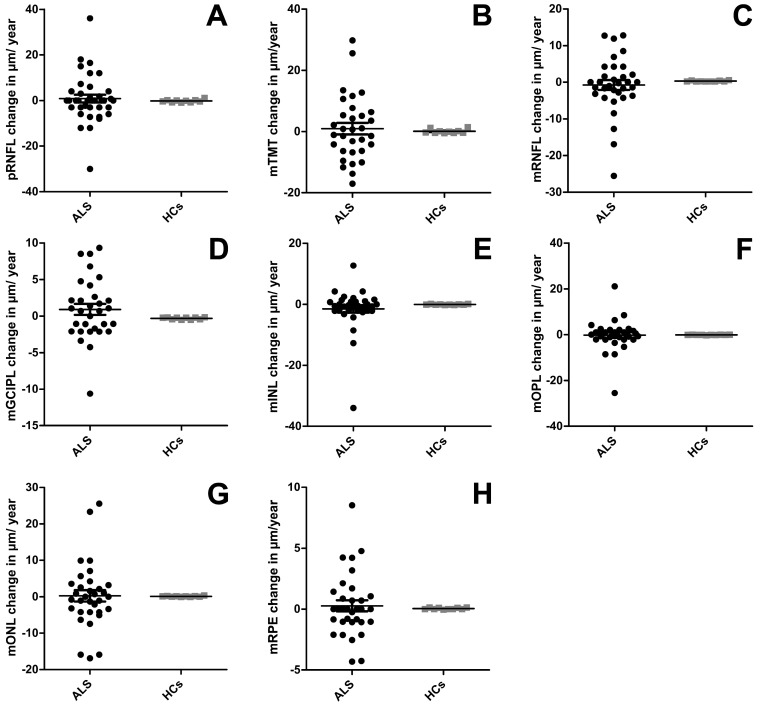 Figure 3
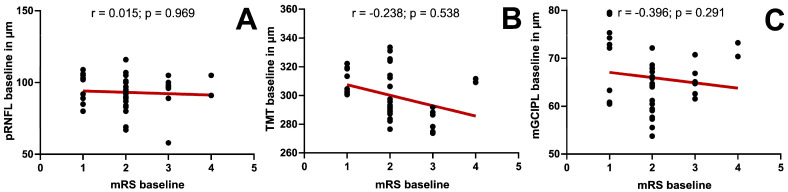 Figure 4
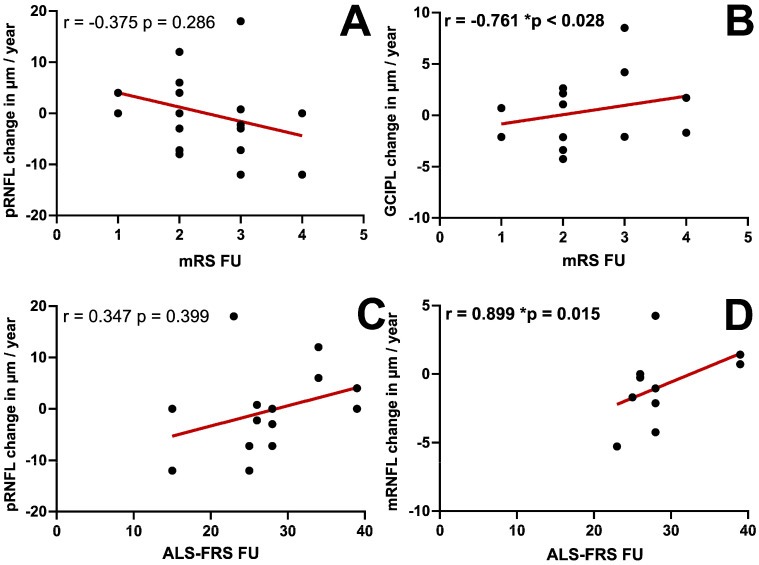 Figure 5
Peer Reviews
No public reviews on file for this paper yet. If you reviewed it on a platform where reviews are public (OpenReview, ICLR, NeurIPS, ICML), you can paste yours below so the community can read it here.
Videos
No videos yet. Explain this paper in a talk, walkthrough, or lecture? Add one.
Taxonomy
TopicsAmyotrophic Lateral Sclerosis Research · Multiple Sclerosis Research Studies · Cerebrospinal fluid and hydrocephalus
1. Introduction
Amyotrophic lateral sclerosis (ALS) is a degenerative disease of the upper and lower motoneurons with a rapidly progressive course often leading to death within two to five years [1]. It combines symptoms of an upper motoneuron loss, such as spasticity and a positive Babinski’s reflex, and symptoms of a lower motoneuron damage, including limb paresis and muscle atrophy [2]. Most patients also show signs of bulbar involvement, such as dysarthria and dysphagia [3]. Increasing evidence from clinical and pathological studies suggests a variety of non-motor symptoms as frontotemporal dementia, visual impairment [4], or fatigue [5]. Recently, a new algorithm for diagnosis of ALS has been developed [6]. The clinical status of patients with ALS can be assessed using different scores: the modified Rankin scale (mRS) describes mental and physical limitations in a seven-step scale. It was developed to describe the outcome of stroke patients and can also be used to describe patients with ALS [7]. The Barthel index (BI) describes limitations in activities of daily life [8]. Disease-specific limitations can be assessed using the ALS-Functional Rating Scale (ALS-FRS) [9], with lower points describing a more severe handicap. The ALS-FRS is also used as a progression parameter over the course of the disease in clinical trials [10,11,12]. Negative prognostic markers are a bulbar onset, weight loss, executive dysfunction, and older age at onset [13,14]. Specific biomarkers or surrogate parameters assessing neurodegeneration in ALS are still lacking. Optical coherence tomography (OCT) detected retinal thickness changes in multiple sclerosis [15] and neurodegenerative disorders such as Alzheimer’s [16] and Parkinson’s [17] disease. In a previous cross-sectional study, we described a reduced thickness of the macular retinal nerve fiber layer (mRNFL), inner nuclear layer (INL), and total macular thickness (TMT) in patients with ALS [18]. In this longitudinal study, we aimed to investigate the relationship between retinal layer thickness changes using OCT imaging and the change in the clinical status of patients with ALS. Possible relations might be used as a biomarker for clinical studies in the future.
2. Materials and Methods
In this retrospective longitudinal study, possible changes in the retinal layers were analyzed by comparing OCT datasets of patients diagnosed with ALS with healthy controls (HC). All subjects gave their written and informed consent. Patients with retinopathy, glaucoma, or myopia or hyperopia of more than 5 diopters were excluded from the study. Further exclusion criteria were other neurological, inflammatory, or degenerative diseases in the medical history. Healthy controls were included in the study site, applying the same exclusion criteria. For all patients, clinical scores including the mRS, BI, and ALS-FRS were obtained at baseline and follow-up, if possible.
We report the OCT methodology according to the APOSTEL recommendations [19,20]. All scans were obtained using a SpectralisTM OCT (Heidelberg Engineering, Heidelberg, Germany) device under ambient light conditions without dilation of the pupil. Using vertical high-resolution volume scans after centering in the middle of the fovea, the total macular thickness and the mRNFL thickness could be detected using the segmentation algorithm of the OCT device. In a second high-resolution volume scan, the volume of the inner and outer retinal layers (complex of ganglion cell and inner plexiform layer = GCIPL; inner nuclear layer = INL; outer plexiform layer = OPL; outer nuclear layer = ONL; retinal pigment epithelium = RPE) was detected. Macular volume scans were analyzed using the automatic segmentation by Heidelberg Eye ExplorerTM (Software version V6.16.2), and obvious errors were corrected manually afterwards (see Figure 1). Using the 1, 3, and 6 mm Early Treatment Diabetic Retinopathy Study (EDTRS) grid, the mean macular thickness was calculated for each layer. The peripapillary RNFL (pRNFL) thickness was obtained using a peripapillary ring scan with a diameter of 3.5 mm (100 A-scans). The examiner positioned the circle around the optic nerve head manually. All scans fulfilled the OSCAR-IB-Criteria [21].
Statistical analysis was performed using Microsoft Excel and SPSS Statistics (26.0) or GraphPad Prism (8.00). Primary outcome parameters were differences in baseline thickness and annualized changes in the pRNFL and the macular retinal layers. OCT data were obtained at baseline and on the follow-up visit. Baseline demographic data were compared between patients and healthy controls, and age was tested using a two-tailed t-test and sex using a chi-squared test. Baseline retinal thicknesses were compared between the patients with ALS and healthy controls using a generalized estimation equation (GEE) model with an exchangeable intercorrelation matrix accounting for within-subject inter-eye correlations and correcting for sex. Annualized thickness change rates were calculated from longitudinal data by linear regression analysis, and group comparison was performed using the Mann–Whitney U test. Using the same GEE model as before, follow-up thickness was compared to baseline for each layer for patients with ALS. Because of small numbers in HCs, longitudinal analysis was performed using the Wilcoxon test, comparing the mean of both eyes. A subanalysis controlling for disease duration in patients with ALS was added. A possible change in the clinical scores (mRS, BI, and ALS-FRS) between baseline and follow-up visit was analyzed using the Wilcoxon test. Using Spearman’s Rho correlations, the relation between retinal thickness layers and the clinical scores (mRS, BI, and ALS-FRS) at baseline was analyzed. The same analysis was performed for the relationship between annual retinal thickness change rates and the clinical scores at follow-up.
3. Results
3.1. Demographics
In this retrospective longitudinal study, we identified 22 patients diagnosed with ALS and 21 healthy controls (HCs), who were analyzed at baseline. All patients with ALS and 5 of the HCs received longitudinal OCT measurements. The baseline and follow-up visits were 5.4 ± 0.5 months (mean ± SEM) apart for patients with ALS (median 5.0 months) and 87.4 ± 4.8 months for healthy controls (median 91 months) (U = 0.0; Z = −4.943; p < 0.001, Mann–Whitney U test). The age of patients with ALS and HCs did not differ (63 ± 2 vs. 60 ± 1 years, U = 712, z = −1.835, p = 0.067, Mann–Whitney U test; age was not normally distributed in patients with ALS: patients with ALS p < 0.001, HCs p = 0.075). Sex distribution was reversed between both groups, with 18% female patients with ALS and 48% female HCs (p = 0.004, chi-square test). The GEE model was, therefore, adjusted for sex. Disease duration at baseline was obtained for 20 patients with ALS, with a mean of 5.15 ± 21.4 months. We did not have any information on genetic testing of the participants.
3.2. OCT Data
We observed no significant differences between the patients with ALS and HC at baseline. All layers apart from the OPL were slightly thinner in patients with ALS (see Table 1 and Figure 2), but without reaching significance. A subanalysis including disease duration at baseline into the GEE model did not change the results of the main analysis; the disease duration had no significant influence on any parameter. The longitudinal analysis did not reveal a significant thinning between baseline and follow-up visit in patients with ALS (see Table 1) when using the GEE model. After calculating the annual change rate of all retinal layers, the group comparison using the Mann–Whitney U-test showed no difference between patients with ALS and HCs (see Table 1 and Figure 3).
3.3. Clinical Scores
The mRS, which describes the physical and mental limitations of the patients, was obtained for all patients at both visits, with a median of 2 points at baseline and 2.5 points at follow-up. We observed a significant deterioration in the mRS between both visits (z = −3.051, p < 0.001, Wilcoxon). The BI was available for 9 patients at baseline (median 100 points) and for 11 patients at follow-up (median 95 points) with no significant difference between both visits (z = −1.342, p = 0.180, Wilcoxon). The ALS-FRS was available for six patients at baseline (median 29 points) and eight patients at follow-up (median 27 points) without a significant change (z = −1.841, p = 0.066, Wilcoxon).
We observed no significant correlations between any of the clinical scores and the inner and/or outer macular retinal layers and the pRNFL (see Figure 4).
After conducting a similar analysis, including the annual change rates of all retinal layers and the clinical scores at the follow-up visit, the mRS showed a significant negative correlation with the annual change rate of the GCIPL (r = <0.761; p = 0.028, Figure 5B). There was no correlation between the BI and any of the annual change rates (Table 2). The ALS-RFS correlated significantly with the annual change rate of the mRNFL (r = 0.899; p = 0.015, Figure 5D) (see Table 2 for detailed information).
4. Discussion
Even though other studies have shown differences in change rates of retinal layer thickness compared to controls measured by OCT, our study could not detect longitudinal thickness changes in patients with ALS. Our baseline data is in line with some previous studies. A large cross-sectional study found neither any difference in macular layer thicknesses nor a correlation to disease severity [22]. Rojas et al. described a significantly increased TMT only in the inferior and temporal inner macular ring segment of the EDTRS grid at baseline in patients with ALS compared to HCs, while the cube average thickness of the macula, like in our study, showed no difference (p = 1.00) [23]. At the follow-up visit after six months in that study, TMT was significantly thinner only for the inner and the outer inferior macular ring segment in the patients with ALS when compared to baseline [23]. Rohani et al. examined the peripapillary RNFL and found that the average pRNFL thickness was significantly lower in patients with ALS compared to controls [24]. Contrasting our current findings, in a previous cross-sectional study, we observed a subtly but significantly thinner macular and peripapillary RNFL and the INL in patients with ALS compared to HCs [18]. A metanalysis performed by Nepal et al. [25] also reported no differences in retinal nerve fiber layer thickness, but a significantly thinner inner nuclear layer thickness in patients with ALS. The reasons for the difference in cross-sectional data between our study from 2014 and the current investigation may be explained by the shorter disease duration in our study (5.15 ± 21.4 months vs. 22.3 ± 22.57 months in 2014). Considering all studies, we believe that differences in retinal morphology between patients with ALS and age-matched HCs are likely to be very small or negligible. However, a histological examination of patients with ALS and transgenic ALS/dementia mice demonstrated intraretinal deposits and loss of ganglion cell axons, respectively [26], which might explain a retinal thickness increase at some point in the clinical course of ALS. Their OCT analysis described a thinner TMT and peripapillary RNFL in comparison to HCs and an inverse correlation with disease duration for both parameters. Mean disease duration was longer compared to our data set, with a mean of 42 ± 34 months, but a range of 7 to 166 months, while Roth et al. (10.80 ± 5.5 months) and we (5.15 ± 21.4 months) included patients in an earlier stage of the disease. Retinal thickness changes might mainly occur in the later course of the disease and might not appear in longitudinal analyses with short intervals or early in the disease.
In this study, we observed no significant correlation between the clinical scores and baseline retinal layer thicknesses. The mRS was the only clinical score assessed for all patients at both visits, thus enabling a reliable correlation analysis. This longitudinal analysis revealed a negative correlation between the mRS and GCIPL thickness change. Correlation analyses for the BI and ALS-RFS should not lead to any interpretation, as they were applicable to only very few of our patients. Rojas et al., on the other hand, reported a reverse correlation between the peripapillary RNFL and the ALS-FRS, with a lower RNFL being associated with a higher score in the ALS-FRS and thus lower disability of the patients. This contrasts our findings with the mRS and is, interestingly, also not consistent with the suggested loss of retinal nerve fibers as a sign of retinal neurodegeneration and a possible progression marker [23]. Of note, in that study, only for half of the patients was the ALS-FRS available and could be included in the follow-up analysis [23].
The small study population in our and other studies [18,22,23] might be a relevant factor for the inconsistent and in some cases contradictory results in the literature. Restrictive inclusion criteria and the rapid progressive course of the disease limit eligible participants. OCT measurement, for example, cannot be performed on patients who are not able to sit upright or in need of intensive care or ventilation. This might also influence the high rates of loss to follow-up and limited availability of longitudinal data in this and other studies. The short follow-up intervals in most studies also limit the power, as one might rather expect changes in OCT in a neurodegenerative disease after two to three years.
Rojas et al. and Rohani et al. used the CIRRUS® (Carl Zeiss Meditec AG, Jena, Germany), while Roth et al. [22] and we used the SPECTRALIS® device (Heidelberg Engineering GmbH). The evaluated grids differed in all studies, rendering comparisons difficult.
Heterogeneity of the involvement of different neurological systems might also play a role in the ophthalmological outcomes. A more detailed clinical differentiation and stratification of patients by symptoms in future analyses might be purposeful.
The above-mentioned small study cohort and short follow-up period are the main limitations of this study. We do, however, believe that despite these limitations, our data is still important and adds to the literature: Our study supports the notion of those studies reporting no differences in retinal layer thickness between patients with early ALS and HCs. The missing significant thickness changes in our longitudinal data suggest that longitudinal measurements may not be suitable for the monitoring of disease progression, especially over a limited period of time (up to 6 months). At the same time, longer monitoring intervals might be impractical due to loss to follow-up.
The role of OCT measurements in detecting disease progression in patients with ALS remains unclear, as we detected no relevant progression of retinal layer thinning. Longitudinal analysis over several years proves to be difficult because of the rapid progression and poor prognosis in some patients. With progress in genetic science and increased availability of genetic testing, new stratifications of cohorts and earlier diagnosis, resulting in longer follow-up times, may become possible. Thickness changes in pRNFL and mINL might prove themselves as a biomarker for early diagnosis or prodromic ALS. Data on monogenetic familial ALS might add more insight into the potency of OCT as a potential biomarker.
The reference list from the paper itself. Each links out to its DOI / PubMed record.
- 1Goutman S.A. Hardiman O. Al-Chalabi A. ChióA. Savelieff M.G. Kiernan M.C. Feldman E.L. Recent advances in the diagnosis and prognosis of amyotrophic lateral sclerosis Lancet Neurol.20222148049310.1016/S 1474-4422(21)00465-835334233 PMC 9513753 · doi ↗ · pubmed ↗
- 2Brown R.H. Al-Chalabi A. Amyotrophic Lateral Sclerosis N. Engl. J. Med.201737716217210.1056/NEJ Mra 160347128700839 · doi ↗ · pubmed ↗
- 3Fujimura-Kiyono C. Kimura F. Ishida S. Nakajima H. Hosokawa T. Sugino M. Hanafusa T. Onset and spreading patterns of lower motor neuron involvements predict survival in sporadic amyotrophic lateral sclerosis J. Neurol. Neurosurg. Psychiatry 2011821244124910.1136/jnnp-2011-30014121921087 · doi ↗ · pubmed ↗
- 4Moss H.E. Mc Cluskey L. Elman L. Hoskins K. Talman L. Grossman M. Balcer L.J. Galetta S.L. Liu G.T. Cross-sectional evaluation of clinical neuro-ophthalmic abnormalities in an amyotrophic lateral sclerosis population J. Neurol. Sci.20123149710110.1016/j.jns.2011.10.01622192877 PMC 3441141 · doi ↗ · pubmed ↗
- 5Nash Y. Sitty M. Non-Motor Symptoms of Amyotrophic Lateral Sclerosis: A Multi-Faceted Disorder J. Neuromuscul. Dis.2021869971310.3233/JND-21063234024773 · doi ↗ · pubmed ↗
- 6Turner M.R. Diagnosing ALS: The Gold Coast criteria and the role of EMG Pract. Neurol.20222217617810.1136/practneurol-2021-00325634992096 PMC 9120398 · doi ↗ · pubmed ↗
- 7Rankin J. Cerebral vascular accidents in patients over the age of 60: II. Prognosis Scott. Med. J.1957220021510.1177/00369330570020050413432835 · doi ↗ · pubmed ↗
- 8Sulter G. Steen C. de Keyser J. Use of the Barthel index and modified Rankin scale in acute stroke trials Stroke 1999301538154110.1161/01.STR.30.8.153810436097 · doi ↗ · pubmed ↗