Challenges in the Classification of Cardiac Arrhythmias and Ischemia Using End-to-End Deep Learning and the Electrocardiogram: A Systematic Review
Edgard Oporto, David Mauricio, Nelson Maculan, Giuliana Uribe

TL;DR
This paper reviews challenges in using deep learning with ECGs to detect heart rhythm and blood flow issues, highlighting gaps in current methods and suggesting areas for improvement.
Contribution
The study systematically identifies 18 new challenges in ECG-based deep learning for cardiac classification, including novel issues in preprocessing, metrics, and explainability.
Findings
Fifty-three challenges were identified in ECG classification using deep learning, spanning preprocessing, models, and evaluation.
Eighteen new issues were discovered, including limitations in explainability metrics and model confidence assessment.
Key challenges include complex ECG patterns, comorbidities, and multi-lead data handling.
Abstract
Background: Cardiac arrhythmias and ischemia are increasingly problematic worldwide because of their frequency, as well as the economic burden they confer. Methods: This research presents a systematic literature review (SLR), based on the PRISMA 2020 statement, that looks into the difficulties in their classification using end-to-end deep learning (DL) techniques and the electrocardiogram (ECG) from 2019 to 2025. A total of 121 relevant studies were identified from Scopus, Web of Science, and IEEE Xplore, and an inventory was created, categorized into six facets that researchers apply in DL studies: preprocessing, DL architectures, databases, evaluation metrics, pathologies, and explainability techniques. Results: Fifty-three challenges were reported, divided between end-to-end DL techniques (15), databases (18), pathologies (9), preprocessing (2), explainability (8), and evaluation…
Genes, proteins, chemicals, diseases, species, mutations and cell lines named across the full text — each resolved to its canonical identifier and authoritative record.
Click any figure to enlarge with its caption.
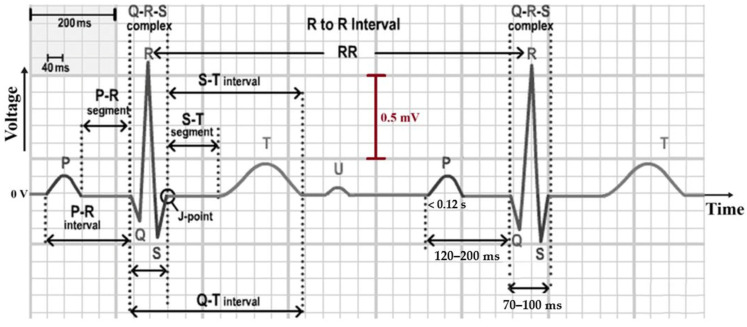 Figure 1
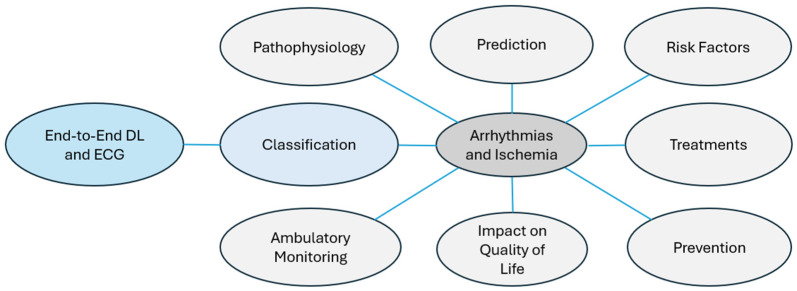 Figure 2
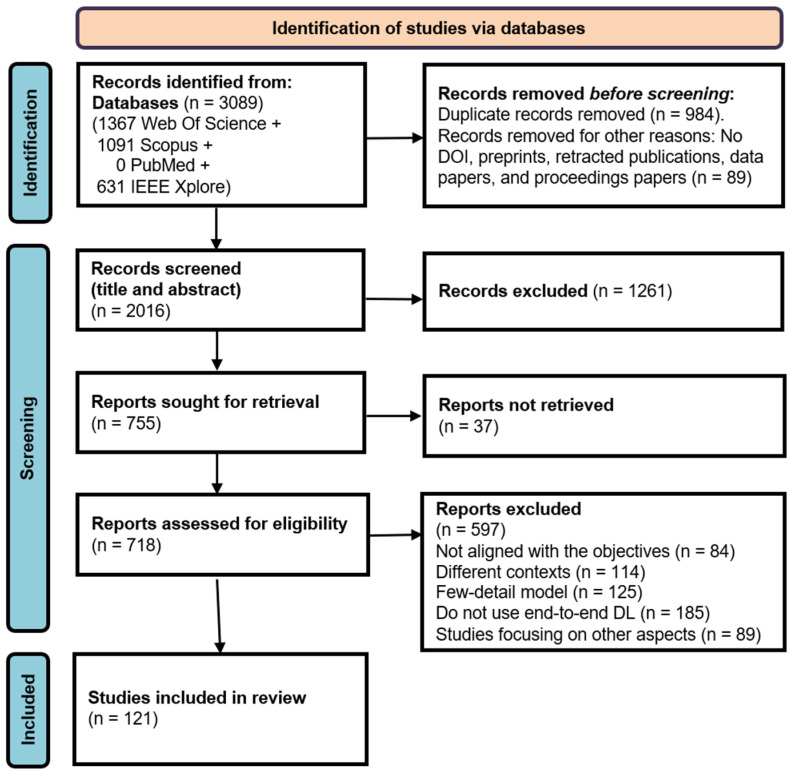 Figure 3
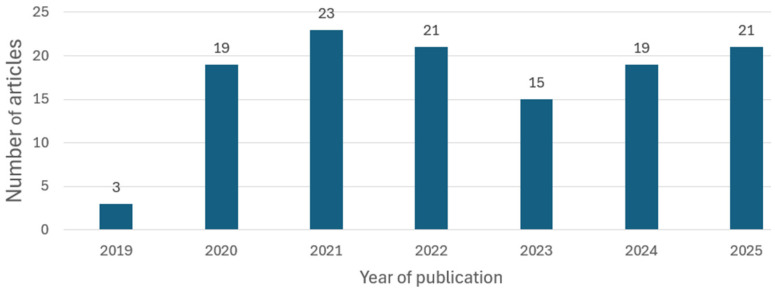 Figure 4
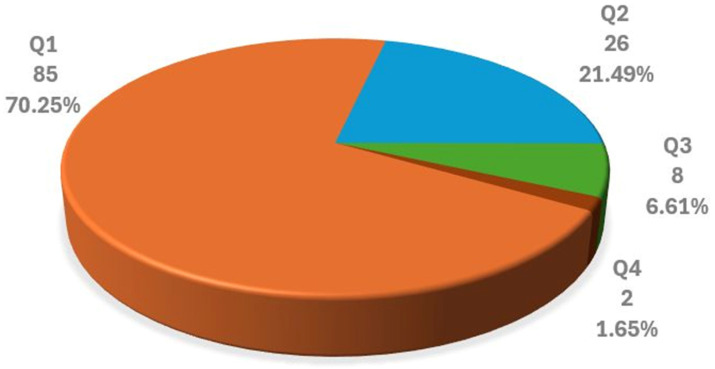 Figure 5
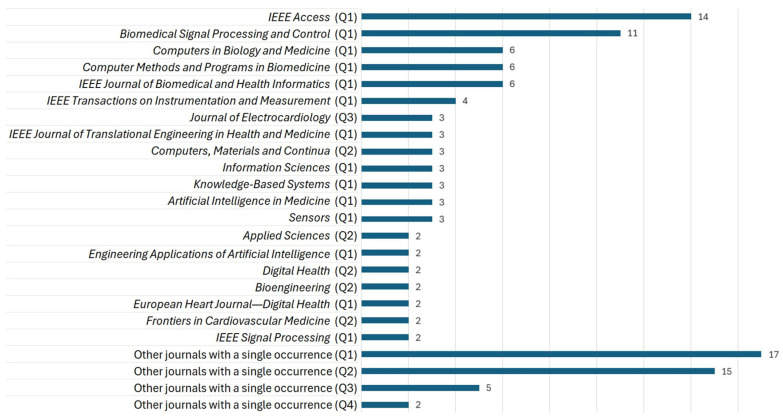 Figure 6
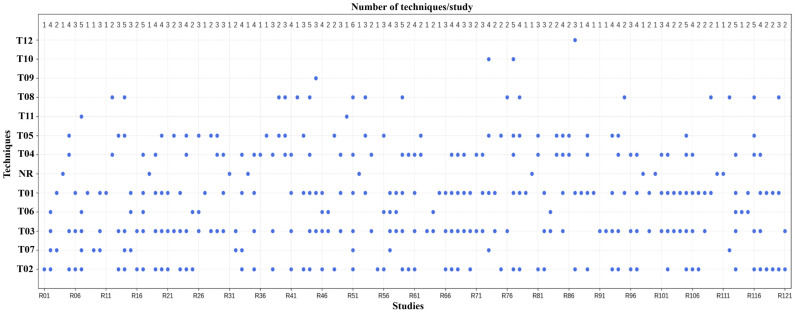 Figure 7
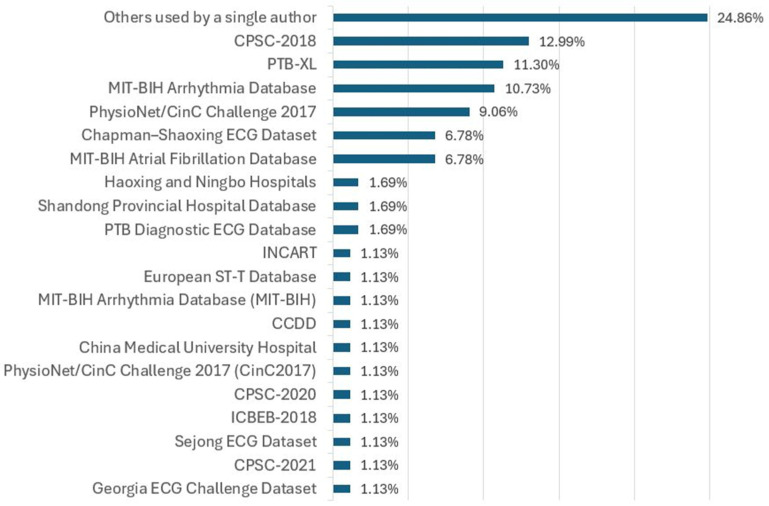 Figure 8
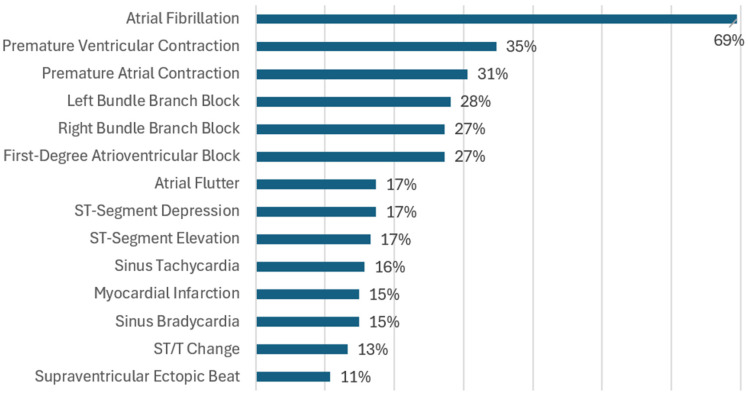 Figure 9
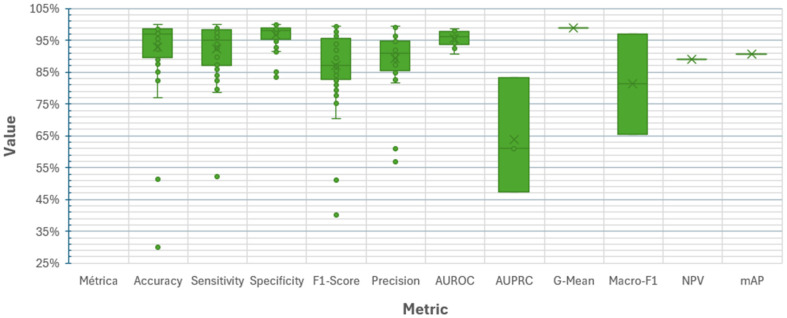 Figure 10
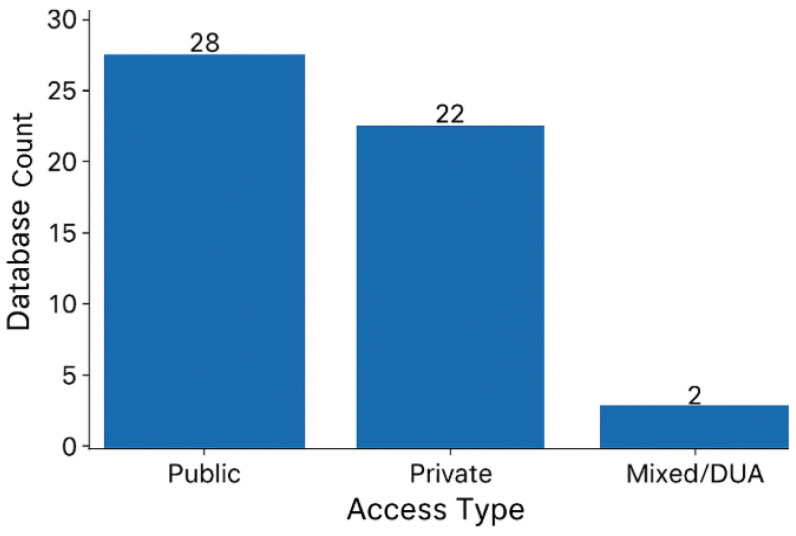 Figure 11
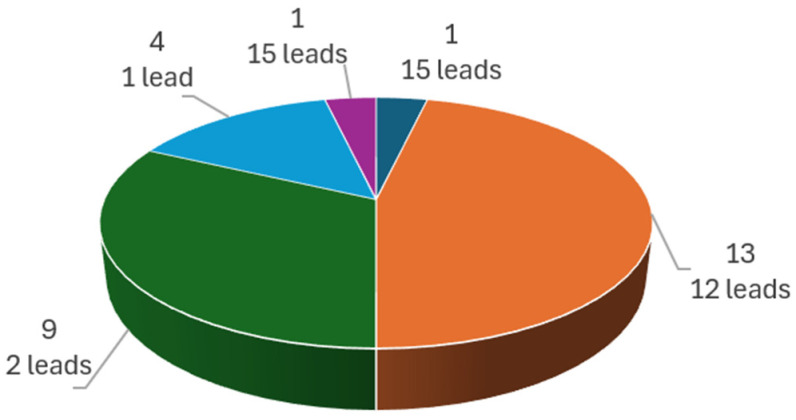 Figure 12
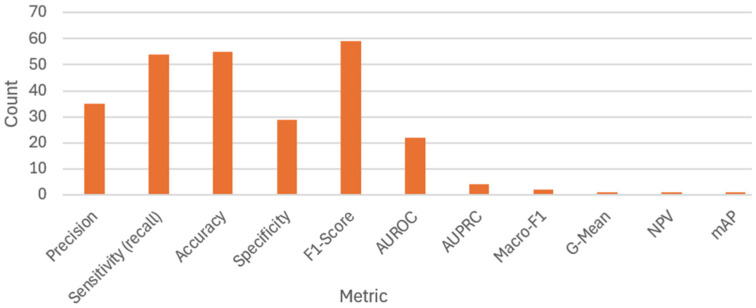 Figure 13
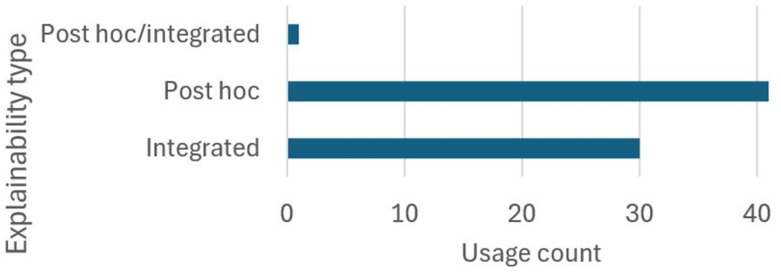 Figure 14
| ID | Difficulty | Effects | References |
|---|---|---|---|
| D16 | Lack of large, well-annotated databases for portable devices | Limits generalization of models trained on standard clinical ECGs. Makes it difficult to capture artifacts specific to ambulatory use. | [ |
| D17 | Imbalance between positive classes or between positive and negative classes | Biases the model toward the majority class and reduces performance for clinically important conditions. | [ |
| D18 | Scarcity of sufficiently large, diverse, and annotated databases | Weakens robustness and generalization to new clinical contexts. Leads to overfitting and hinders training of large or complex models. | [ |
| D19 | Lack of data standardization or quality | Requires more diverse and labor-intensive preprocessing due to incompatibilities. Complicates cross-validation and benchmarking. | [ |
| D20 | Underrepresentation of diverse populations | Introduces bias and limits applicability to generalized clinical use. | [ |
| D21 | Restricted access and privacy issues | Complicates data collection, sharing, and use. Prevents external validation and reproducibility. | [ |
| D22 | Different sampling rates across databases | Causes loss of information or signal distortion from resampling. | [ |
| D23 | Data from a single source or device | Produces bias toward the source device, excessive dependence on calibration, and poor generalization to other datasets. Overestimates model capability and reduces external validity. | [ |
| D24 | Variability among acquisition devices | Creates dependence on specific recording systems, degrades multicenter performance, and hinders cross-validation and benchmarking. | [ |
| D25 | Limited metadata: age, sex, weight, ethnic origin and population diversity, comorbidities, etc. | Compromises interpretability, fairness, and adaptability of the model to subgroups or vulnerable populations. | [ |
| D26 | Limited availability of databases with concurrent pathologies | Prevents training of robust multi-label models and restricts the design of clinically useful models. | [ |
| D27 | Inconsistent or automated labeling | Leads the model to learn incorrect associations and reduces performance. | [ |
| D28 | Absence of standardized protocols for acquisition, annotation, and structuring of records in ECG databases | Reduces interoperability between datasets and limits model generalization, transferability, and comparability. | [ |
| D29 | Variability in the number of ECG leads | Reduces model comparability, introduces differences in spatial information, and prevents transfer to devices using different leads. | [ |
| D30 | Dataset coverage restricted to a single pathology | Limits clinical evaluation and prevents training or testing of multi-class and multi-label models. | [ |
| D31 | Inter-database variability in ECG recording duration and quality | Complicates model architecture and joint training, leading to uneven or biased learning. | [ |
| D32 | Fine-tuning | Requires large, high-quality clinical datasets. | [ |
| D33 | Different recording durations across databases | Increases computational complexity and training difficulty. Performs poorly on long signals where rare or transient events may occur. | [ |
| ID | Difficulty | Effects | References |
|---|---|---|---|
| D34 | Pathology similarity | Makes it difficult to extract discriminative features, reducing accuracy in multi-class classification and increasing diagnostic errors. Requires clinically diverse data, precise labeling, and greater model capacity. | [ |
| D35 | Comorbidities or multiple concurrent cardiac pathologies | Introduce diagnostic difficulty because one pathology may mask or distort another. Requires well-annotated multi-level databases and more sophisticated architectures capable of learning multiple patterns. | [ |
| D36 | Intra-patient and inter-patient variability | Reduces generalization by blurring physiological and pathological variability. Lowers performance in external cross-validation and limits transferability to new patients. | [ |
| D37 | Ambiguity in the patterns of certain pathologies | Reduces diagnostic specificity due to inter-class overlap. | [ |
| D38 | Pathologies with episodic or paroxysmal occurrence | Require long recordings or sequential models; sensitivity is reduced when using short windows. | [ |
| D39 | Subtypes of pathologies | Demand specialized models and finer expert-labeled annotations, increasing complexity and the risk of diagnostic errors. | [ |
| D40 | Complex patterns | Require more sophisticated models and larger volumes of annotated data. | [ |
| D41 | Subtle morphological changes in various pathologies | Make detection difficult and require complex models with high resolution or higher sampling rates. | [ |
| D42 | Redundancy of information in the 12-lead ECG | Limits usefulness in deep models, where combinations can be learned automatically, and reduces suitability for portable devices. | [ |
| ID | Difficulty | Effects | References |
|---|---|---|---|
| D43 | Presence of excessive or unaccounted noise and artifacts | Increases the risk of losing critical information and reduces model performance in real-world settings. | [ |
| D44 | Unrealistic generation of synthetic data | May cause the model to capture non-real features, leading to poor generalization and reduced explainability. | [ |
| D45 | Absence of standardized metrics for evaluation | Hinders comparison across models; the use of inadequate metrics may obscure poor performance in critical classes. | [ |
| ID | Technique | Difficulty | Effects | References |
|---|---|---|---|---|
| D46 | T02 | Regions highlighted by attention maps do not always match clinically relevant or expected features. | The use of clinical tests has limited acceptance in medical circles as they are neither very useful nor unambiguous. | [ |
| D47 | T03 | Does not allow complete reconstruction of the decision-making process; limited in scenarios with high signal variability. | Restricts transparency; the lack of full traceability of the model’s reasoning hinders acceptance and validation in clinical settings. | [ |
| D48 | T07 | Significant overlap of feature maps; generated maps may not display clinically understandable, relevant, or complete patterns | A reduction in visual clarity and difficulty in identifying the ECG areas influencing the results can lead to ambiguity and low clinical trustworthiness. | [ |
| D49 | T09 | Explanations can show which areas are important to the model but do not always show areas that the clinician would find important for diagnosis. | Creates misalignment between model logic and clinical reasoning; hinders expert validation and reduces trust in automated decisions. | [ |
| D50 | T11 | Incorrect assignment of relevance to noisy regions. | Produces false conclusions about ECG regions driving predictions; omits significant features, which may mislead analysts and reduce model reliability. | [ |
| D51 | T13 | It is not possible to trace the complete reasoning of the model using these means. | Prevents full causal understanding of decisions; reduces transparency and limits reliability in clinical validation. | [ |
| D52 | T17 | Highlights important regions for the decision without explaining why those regions are relevant. | Obscures the decision-making mechanism, reducing usefulness for clinical analysis or expert validation. | [ |
| D53 | T18 | Identifies important ECG regions without establishing correlation with clinical criteria or validating medical relevance. | Limits interpretability; highlighted regions may be technically relevant but not clinically meaningful, reducing their reliability for practitioners. | [ |
| ID | Aspect | Unaddressed Difficulties | Justification of the Affected Activity or Feature |
|---|---|---|---|
| D54 | Preprocessing | Lack of dynamic normalization adapted to changing clinical contexts | Limits real-time processing of signals that vary due to physiological, technical, clinical, or temporal factors. |
| D55 | Preprocessing | Absence of standards for preprocessing multichannel signals from different devices | Creates compatibility and robustness issues due to technical differences between sources. |
| D56 | Preprocessing | Absence of automatic quality control of signals in real-world environments | Models trained on diagnostic-quality signals fail to generalize to uncontrolled environments. |
| D57 | Preprocessing | Fixed windows misaligned with clinical events | Windows that do not follow physiological or diagnostic boundaries lead to missed detection of brief events. |
| D58 | DL end-to-end techniques | Lack of automatic hyperparameter tuning mechanisms for deep architectures | Reduces efficiency and slows model experimentation and optimization. |
| D59 | DL end-to-end techniques | Integration of self-supervised techniques to pretrain models with limited data | Self-supervised pretraining reduces dependence on large annotated databases. |
| D60 | DL end-to-end techniques | Lack of real-time adaptation to patient changes during prolonged monitoring | Prevents models from adjusting parameters to individual physiological changes, reducing performance. |
| D61 | Database | Creation of synthetic databases to balance minority classes without compromising quality | Rare patterns should be included without degrading model performance. |
| D62 | Cardiac pathologies | Limited consideration of dynamic changes in pathologies | Hampers classification when pathologies evolve dynamically during prolonged monitoring. |
| D63 | Metrics | Limitations of metrics for evaluating explainability and confidence in model decisions | Undermines adoption in medical contexts where explainability is critical. |
| D64 | Metrics | Lack of correlation between computational metrics and clinical outcomes | Disconnect between metrics and clinical decision-making fails to account for clinical risk, diagnostic urgency, or therapeutic utility, hindering objective comparisons. |
| D65 | Metrics | Metrics with limitations for evaluating temporal sequences and real-time performance | Fail to capture event timing or latency, persistence, or continuity. Short events go undetected, and real-time inference cannot be evaluated. |
| D66 | Metrics | Metrics for multi-class classification | Conceal poor performance in minority classes and fail to reflect differences in clinical risk between classes. |
| D67 | Explainability techniques | Lack of visual tools to interpret decisions on long signals (e.g., Holter recordings) | Prevents reliable interpretation of extended ECG records. |
| D68 | Explainability techniques | Lack of explainability adapted to each pathological class | Current techniques do not distinguish between classes with different clinical criteria; an explanation valid for one class may be inadequate for another. |
| D69 | Explainability techniques | Limitations of explanations in multi-label and multi-lead contexts | Visual techniques merge explanatory information, preventing separation of influences by class or ECG lead. |
| D70 | Explainability techniques | Lack of standardized evaluations to assess agreement with expected clinical findings | Reduces the reliability of techniques and prevents comparability across studies. |
| D71 | Explainability techniques | Misalignment between the explanation’s scale and the clinical event’s scale | Explanations highlight very small regions without clinical correlation in duration. |
Peer Reviews
No public reviews on file for this paper yet. If you reviewed it on a platform where reviews are public (OpenReview, ICLR, NeurIPS, ICML), you can paste yours below so the community can read it here.
Videos
No videos yet. Explain this paper in a talk, walkthrough, or lecture? Add one.
Taxonomy
TopicsECG Monitoring and Analysis · Cardiac electrophysiology and arrhythmias · Atrial Fibrillation Management and Outcomes
1. Introduction
Cardiovascular diseases (CVDs) cause the most deaths and disabilities worldwide [1]; CVD-related fatalities have increased, going up from 12.3 to 19.4 million between 1990 and 2021, and in the U.S., someone dies of CVD every 34 s—a situation that is extremely alarming, totaling about 2580 per day [2]. Thus, they are an overwhelming burden on the health system, with estimates showing that deaths caused by CVDs will reach 20.5 million in 2025 and 35.6 million in 2050 [3]. There are several causes behind this high incidence of the condition, with the most important being hypertension, high low-density lipoprotein cholesterol, and hyperglycemia [4]. Unhealthy diet and smoking as behavioral risk factors, and overweight and obesity, which afflict 59% of adults across the globe, worsen the scenario [5,6]. Air pollution with fine particulate matter is among the environmental risk factors contributing most to the disease burden [7]. In addition, a critical shortage of specialists hampers timely diagnosis and appropriate treatment. Some of the most common diseases linked to CVDs are cardiomyopathies, heart failure, coronary heart disease, and arrhythmias [8]. They are all serious conditions and require accurate diagnosis and effective clinical management [9]. This research is going to study the last two pathologies due to their healthcare relevance and challenge of classification using the DL models.
Cardiac arrhythmias represent disturbances of the regular heart rhythm, and cover an extensive range of pathologies. Atrial fibrillation (AF) is the most predominant arrhythmia among adults, constituting a serious threat that causes significant morbidity and mortality [10], with AF now considered a global epidemic [11]. AF affects approximately one in three to five people after the age of 45, with a lifetime risk from that age onward. The current burden of AF increased from 34 to 59 million cases between 2010 and 2019, with 0.34 million deaths in 2021 [12]. Age is the leading factor for AF, where cases rise significantly after age 65 [11]. Ischemic heart disease, on the other hand, is a group of conditions resulting from partial or complete blockage of coronary blood flow, caused by the accumulation of plaques of fatty materials and cholesterol in the arterial walls. Coronary ischemia continues to be the predominant cause of mortality globally [4], with cases increasing from 5.37 million in 1990 to 8.99 million in 2021; furthermore, current projections suggest it will dominate mortality statistics until 2050 [2,3]. Myocardial damage is irreversible if ischemic heart disease is permitted to develop or continue; thus, effective management of underlying risk factors is essential not only to reduce the incidence of myocardial infarction but also to improve long-term prognosis.
Cardiac arrhythmia and ischemia classification (CAIC) based on analysis of the electrocardiogram (ECG) is not straightforward given the complicated waveform and highly dynamic behavior of the ECG. Classic machine learning techniques require considerable preprocessing and feature engineering by hand. As a result, they are not suitable for scaling, capturing complex patterns, and reproducibility, to name a few. Meanwhile, end-to-end DL methods can allow the raw signal to be directly analyzed, or with minimum preprocessing, and automatically extract features, thereby facilitating automation; in addition, they also aid in handling huge amounts of data. As a result, diagnosis and early detection are improved as well as treatment [13]. Research has revealed the potential of DL models in portable devices and telehealth, helping to improve timely diagnostic access in rural regions and making the spectrum of healthcare more equitable [14,15,16]. Accordingly, end-to-end DL techniques are examined as they can automate the full classification with great potential.
Among the studies on CAIC using ECG and end-to-end DL, ref. [17] employed an end-to-end CNN–Improved Bidirectional LSTM network for arrhythmia classification with the MIT-BIH Arrhythmia Database and the MIT-BIH Atrial Fibrillation Database, achieving 97.85% accuracy and a 97.95% sensitivity. Ref. [18] applied ResNet with an attention mechanism to detect six arrhythmias, reporting an F1-score of 88% and a specificity of 97%. Ref. [19] used a CNN combined with GRU for myocardial infarction detection with the PTB-XL Database, achieving both an accuracy and sensitivity of 99.1%. Ref. [20] utilized CNN, Bi-LSTM, and Bi-GRU in an end-to-end approach to categorize multiple arrhythmias, obtaining an accuracy of 98.55% and a recall of 0.9831. Finally, ref. [21] developed a CNN–Transformer model with dual-view and an external attention mechanism, end-to-end, using the CPSC-2018 database to detect six arrhythmias and ST-segment changes, reaching an 0.85 F1-score and an 0.863 accuracy rate.
CAIC through DL techniques and ECG still faces significant challenges, including low data quality, high variability in ECG signals, lack of model explainability, the contamination of the signals with noise and several artifacts, and the underrepresentation of certain pathologies in training datasets [13]. The widespread use of end-to-end DL architectures in the healthcare domain faces limitations because of the above problems. But this raises an important question. What difficulties does CAIC encounter when using end-to-end DL? In-depth knowledge behind every challenge is key to building novel algorithms or enhancing existing algorithms to improve performance and implementations, which will ultimately help with trust and user uptake [18].
Since 2019, multiple systematic reviews have examined the use of artificial intelligence for cardiac pathology classification with the ECG; however, these reviews typically address a broad spectrum of techniques, including traditional machine learning. To date, few systematic reviews have provided a comprehensive analysis of end-to-end DL pipelines, nor highlighted the specific challenges they face in classifying arrhythmias and ischemia using a rigorous methodology approach.
Because studies on the classification of arrhythmias and ischemia with end-to-end DL pipelines reflect difficulties across various aspects and methodologies, a systematic review becomes necessary to integrate these findings, identify patterns, and assess their impact on the models.
Unlike previous systematic literature reviews, this study focuses only on end-to-end DL architectures and the critical systematization of the difficulties they face in classifying arrhythmias and ischemia. By applying this particular perspective to the literature published between 2019 and 2025, our work provides a complementary and more focused contribution than existing reviews.
The primary goal of this review is to ascertain and scrutinize the techno-methodological barriers to the use of end-to-end DL models with ECG. Accordingly, several articles published from 2019 to 2025 formed the basis of this systematic literature review (SLR). Clinicians, biomedical companies, and researchers can use the findings to refine current algorithms, implement them into clinical practice, and develop more optimized and reliable medical applications. These findings also hint at new avenues of research.
This research aims (a) to provide an overview of heart functioning as well as cardiac arrhythmias and ischemia with respect to their causes, classification, diagnosis, and aspects of study; (b) to present an inventory of CAIC research with end-to-end DL and ECG with respect to their preprocessing approaches, end-to-end DL models, databases, cardiac pathologies, evaluation metrics, and explainability approaches; and (c) to provide an inventory of challenges in CAIC with end-to-end DL and ECG with respect to those already reported in the literature and those not reported yet.
This study is structured into five sections, described below. Section 2 contains a tutorial on cardiac function, as well as characteristics and patterns defining cardiac arrhythmias and ischemia on the ECG waveforms. Section 3, Section 4 and Section 5 contains a systematic review of CAIC using end-to-end DL architectures and the ECG. The challenges of utilizing end-to-end DL models for CAIC are discussed in Section 6. Section 7 interprets the results. Lastly, Section 8 is dedicated to the conclusions.
2. Background
2.1. Electrical Control of Heart Pumping
The heart sends oxygenated blood to the body and deoxygenated blood to the lungs. In terms of structure, it has four chambers (i.e., two atria and two ventricles), valves, arteries, veins, and myocardium [22]. The heart goes through diastole, the period where the heart muscle relaxes and receives blood, and systole, which is when the heart contracts and pushes blood to the lungs and body. The cardiac conduction system controls these phases. The electrical impulses start in the sinoatrial node, travel through the atria where the electrical activity is delayed for a short time at the atrioventricular node, and then are transmitted through the bundle of His (AV bundle) and Purkinje fibers, causing the contraction of the ventricles [23].
2.2. The ECG and Its Leads
ECG signals are recorded using cutaneous electrodes and include waves, segments, and intervals [24]. The P wave refers to atrial depolarization, the QRS complex is for ventricular activation, while the T wave is for ventricular repolarization. The typical value of signal span is 2 mV, and the duration of a cardiac cycle is about 1 s. This varies in different individuals and conditions [22,25]. A typical ECG waveform is presented in Figure 1. Moreover, the standard 12-lead ECG records the heart’s bioelectrical activity through bipolar limb leads (I–III), precordial leads (V1–V6), and augmented unipolar limb leads (aVR, aVL, and aVF). Each lead provides a distinct view on cardiac regions, and signals from aVR, aVL, and aVF are derived algebraically from leads I, II, and III [26].
2.3. Arrhythmias: Causes and Classification
Arrhythmias are disturbances in the heart’s electrical activity that manifest as irregularities in rhythm, rate, or waveform; their causes range from underlying cardiac disease to stress, drug exposure, or genetic predisposition [28]. They are commonly classified by the site of origin—ventricular, supraventricular, atrioventricular junction, or sinoatrial node—and by the mechanism, which involves either abnormal impulse formation or impaired conduction. Disorders of impulse formation may result from triggered activity or irregular automaticity, producing conditions such as sinus tachycardia, bradycardia, ectopic rhythms, pauses, torsades de pointes, or digitalis-induced arrhythmias [24]. Conduction abnormalities, in turn, involve blocks or delays in propagation, and are divided into non-reentrant conduction blocks—including sinoatrial, atrioventricular, and bundle branch blocks—as well as aberrant supraventricular complexes and reentrant mechanisms, which underlie sinus reentrant tachycardia, atrial and nodal reentrant tachycardias, atrioventricular reentrant tachycardias with accessory pathways, atrial flutter, atrial fibrillation, and ventricular tachycardia or fibrillation [26].
2.4. Ischemia: Causes and Consequences
Cardiac ischemia arises from reduced myocardial perfusion caused by partial or complete obstruction of the coronary arteries. Prolonged ischemia causes tissue necrosis, whereas transient episodes can produce reversible lesions with variable outcomes [29]. The characteristics of myocardial injury depend on the affected artery, and ECG leads provide spatial information to localize the compromised region [23].
2.5. Related Research
Several systematic reviews have addressed denoising techniques for cardiovascular signal analysis. Ref. [30] examined 198 studies published between 2017 and 2023, emphasizing database availability and the classification of eight cardiovascular disease types. Ref. [31] focused on 112 studies from 2020 to 2024, highlighting advanced denoising methods for personalized ECG diagnosis and the challenges of inter-patient variability. Ref. [32], in a review of 368 articles up to 2022, identified major trends and research opportunities in arrhythmia classification, with particular attention to databases and commonly used denoising models. Ref. [13] provided an overview of 78 studies from 2017 to 2023, categorizing deep learning architectures that achieved over 96% accuracy in arrhythmia detection, while also offering medical background and methodological guidance. The systematic reviews together represent the course of evolution of denoising techniques, the role of databases, and the diversity of methodologies in the classification of arrhythmias.
Beyond those systematic reviews, several more general studies have looked at deep learning and artificial intelligence in cardiology. According to [33], randomized controlled trials were reviewed to evaluate clinical effectiveness and the applications across arrhythmias, and ischemia and structural heart disease were examined; the authors argued that trained DL strategies show promise in controlled settings, yet noted that real-world implementation will face challenges owing to commonly seen variations in datasets, a lack of standardization, and the need for multicenter validation. In a comprehensive overview of the literature, that is the study [34] which analyzed 200 studies published from 2020 to 2024, we find the use of AI in cardiology. This covers general clinical practice, including the prevention and intervention for arrhythmias, ischemia, and valvular disease. Ref. [35] concentrated on ECG analysis with AI, especially deep learning applied to arrhythmia detection and prediction, myocardial infarction, and other cardiac conditions; the research also raised ethical issues and problems around lack of interpretability. These reviews highlight the clinical potential, as well as the methodological and ethical challenges, of the use of AI in cardiology.
Extending this perspective, ref. [36] surveyed journal and conference articles published between 2019 and 2024, focusing on transformer-based and large language model methodologies for ECG diagnosis. The study provides a hierarchical classification of the reviewed methods, compares categories of approaches, and highlights research gaps along with future directions.
2.6. Aspects of Study
This study focuses on end-to-end DL techniques for automated CAIC using the ECG; however, various other aspects of cardiac arrhythmias and ischemia exist, which are shown in Figure 2 and described below.
Pathophysiology: The study of biological processes that alter heart rhythm or blood flow. For example, an imbalance between the sympathetic and parasympathetic systems can lead to arrhythmias [37].Classification: Techniques for identifying cardiac arrhythmias and ischemia, may or may not be ECG-based. Visual inspection [29], echocardiography [38], end-to-end DL [17], and conventional machine learning [39] are some examples.Ambulatory Monitoring: Continuous tracking with portable devices to detect cardiac events in real time, such as Holter monitors integrated with IoT technology [40].Risk Factors: Identification of conditions that predispose individuals to cardiac diseases. For instance, obesity increases the risk of AF [41].Prevention: Measures aimed at minimizing cardiac arrhythmias or ischemia through modification of lifestyle or early intervention. For example, regular physical activity minimizes the risk of cardiac infarction [42].Treatments: Therapies designed to avoid or control arrhythmias and ischemia; for example, catheter ablation, which eliminates tachycardia [43].Impact on Quality of Life: Assessment of how heart disease affects emotional, physical, and social well-being. For example, patients recently diagnosed with ischemia may suffer from chronic anxiety [44].Prediction: Use of sophisticated algorithms to anticipate the occurrence of critical conditions. For example, ref. [45] proposed a fuzzy DL model to predict cardiac arrhythmias at their outset.
3. Materials and Methods
This section presents an SLR on CAIC through end-to-end DL as per the methodology and for planning, execution, results, and analysis. This study uses stringent inclusion criteria to focus exclusively on end-to-end deep learning architectures, in contrast to previous reviews. Furthermore, we conduct a systematic analysis of the methodological challenges in 6 essential components, namely, preprocessing, databases, pathologies, end-to-end DL models, evaluation metrics, and explainability. This methodological perspective is applied to the literature published in the period from 2019 to 2025. It highlights the scope of our SLR. Furthermore, it differentiates our SLR from existing SLRs.
3.1. Methodology
The 2020 PRISMA Statement [46] defines the article selection procedure for this SLR to ensure transparency and rigor (see Supplementary Materials, Tables S10 and S11). This strategy is consistent with recent systematic reviews; for instance, refs. [47,48] supply detailed surveys of the uses of artificial intelligence in cardiovascular disease diagnosis using the ECG. The specifications proposed by [49] for software engineering studies have been adopted as well. According to guidelines, the four phases used for SLRs on DL for CAICs, like [32,50,51], are explained below.
Planning: At this stage of the research protocol, investigators write draft a research protocol that contains the research questions and article search and selection procedure. This includes journal source selection, date selection, search strings, and inclusion and exclusion criteria.Execution: The protocol is utilized to select relevant articles addressing the formulated research questions and answering them.Results: Determination and presentation of statistics on the selected articles, including trends, quality, and distribution.Analysis: The researchers will be required to analyze the research questions formulated at the planning stage.
3.2. Planning
To answer the research question on the difficulties of CAIC with end-to-end DL and ECG, the guiding question was as follows: how is CAIC performed with end-to-end DL and ECG? To answer this, a search for journal publications was conducted in the Scopus, Web of Science, IEEE Xplore, and PubMed databases, covering the period from 2019 to 2025. The search string used was as follows: [(diagnosis OR algorithm OR detection OR classification) AND (“cardiovascular diseases” OR “coronary events” OR arrhythmia OR cardiac OR “heart attack” OR “myocardial infarction” OR ischemia OR “atrial fibrillation”) AND (ecg OR electrocardiogram) AND (“deep learning” OR cnn OR rnn OR lstm OR gru OR transformer OR autoencoder)]. This string was applied to “Title–Abs–Key” in Scopus, “Topic” in Web of Science, and “Title–Abstract” in PubMed. After identifying the scientific articles, the selection criteria summarized in Table 1 were applied to determine the eligible studies.
3.3. Execution
After applying the search strategies, 3089 studies were selected. Next, we systematically reviewed these studies; the screening and selection process is summarized in Figure 3 and was conducted using the inclusion–exclusion criteria shown in Table 1. An Excel file was employed for the exercise to record the selected studies and capture important data like title, author, journal, DOI, and so on.
Initially, a total of 1073 studies were eliminated, including duplicates and other removals, resulting in 2016 articles. During stage two, titles and abstracts were screened, and 1261 studies that failed to satisfy the eligibility criteria were discarded, leaving 755 studies. In stage three, 718 full-text articles were retrieved. In the final stage, a full-text reading of articles was performed to find out those whose contribution is relevant to this review, resulting in 121 articles. Finally, these studies were rigorously analyzed, avoiding subjective interpretations, to find answers to the research question.
4. Results
4.1. Potential Articles
In total, 2016 potential articles were identified, and 121 were ultimately selected, accounting for 6% of the total (see Table 2). Although no articles were retrieved, PubMed was included in the search strategy given its relevance as a leading clinical database. Additionally, its inclusion ensured comprehensiveness and avoided potential bias due to a limited selection of sources.
4.2. Publication Trends
Figure 4 presents the distribution of the selected articles for the period 2019–2025. A significant increase in research output is observed starting in 2020, which corresponds to the emergence of the first relevant end-to-end deep learning (DL) studies in ECG around 2018, with pioneering contributions of [155]. The volume of publications remained relatively consistent through 2025. This trend reflects sustained activity in this field.
4.3. Selected Articles by Journal Quality Factor
Regarding journal quality, 70.25% (n = 85) of the selected articles were published in Q1 journals and 21.49% (n = 26) in Q2 journals. In total, 91.74% (n = 111) of the 121 selected articles appeared in the top two quartiles, underscoring their quality (see Figure 5).
4.4. Selected Articles by Journal
Figure 6 presents the distribution of the chosen articles by journal; those with only one article are grouped under “Other journals with a single occurrence”.
5. Analysis
This section responds to the research question outlined in Section 3.2 through the following sub-questions:
- RQ1: What preprocessing techniques are applied to ECG signals?
- RQ2: What end-to-end DL techniques are employed for feature extraction and CAIC from ECG?
- RQ3: Which databases are used to train and validate end-to-end DL algorithms?
- RQ4: What types of cardiac arrhythmias and ischemia are classified by the algorithms?
- RQ5: What metrics are used to evaluate the effectiveness of end-to-end DL algorithms?
- RQ6: Which techniques are used to explain the results of ECG-based CAIC using end-to-end DL?
5.1. RQ1
Twelve types of techniques were identified for preprocessing ECG signals prior to their use in end-to-end DL models (see Table 3). Among these, the most recurrent during the training, validation, and inference phases were segmentation, amplitude normalization, and noise and artifact removal, owing to their direct impact on data quality and model stability. By contrast, techniques such as resampling, structural data adjustment, class balancing, and advanced cleaning were less frequently employed (see Figure 7). These were primarily applied during the model construction phase to obtain suitable data because the final model generally operated on signals that already conformed to the required input format and did not require further modification or class-distribution adjustment.
Figure 7 illustrates the distribution of preprocessing techniques across the studies. The left axis shows the techniques’ identifiers, while the top axis shows how many techniques are employed in each study.
Having outlined the overall distribution and relevance of preprocessing techniques (Table 3, Figure 7), we now describe each category and specific techniques in detail (see Table 4). Additional information can be found in Supplementary Tables S7–S9.
Techniques T01: Noise and Artifact RemovalThe methods used in this category are used for preprocessing the ECG signals in order to improve their quality. Wavelet-based methods rely on multi-resolution decomposition to separate waves and suppress noise components. Digital filters (Butterworth, band-pass, and notch) are used to suppress other frequencies, such as baseline wander and power-line noise. LOESS, moving average, and Non-Local Means (NLM) smoothing are statistical methods that use local signal similarity to suppress noise. To minimize amplitude changes, normalization methods are applied (sliding window). Furthermore, to discard residual noise, a thresholding strategy is employed (such as a hard threshold or wavelet threshold), discarding coefficients that went below a defined level. The purposes of artifact removal, baseline wander correction, high-frequency noise suppression, and residual noise removal represent complementary approaches to the common objective of enhancing ECG signal quality. In their studies, authors have labeled the techniques differently, but they are all aimed at solving the same noise and distortion problems in ECG preprocessing. In our corpus, 42 studies used some processing for noise or artifact removal.Techniques T02–05To ensure uniformity of the ECG signal amplitude, segmentation of the temporal structure on the recordings, and the harmonizing of sampling rates of the various datasets, preprocessing techniques T02–T04 were implemented. Normalization methods (T02) include Z-score scaling, Min–Max scaling, and unit variance adjustment to avoid varied amplitude ranges in the model. Windowing approaches (T03) segment signals into fixed-length segments of size 1.5–60 s using either a single window or multiple windows, with or without overlap, for local analysis and feature extraction. Resampling techniques (T04) modify the temporal resolution of a signal through downsampling or upsampling, aiming to create uniform sampling frequency data aligned in time and to process heterogeneous sources. These techniques enhance signal comparability and model compatibility, and were reported across a wide range of studies.The techniques under T05 deal with forcing identical signal duration and identical structure prior to the model input. The techniques used include zero-padding, cropping, trimming, replication, segmentation, and resampling. These methods were applied to obtain fixed-length signals of length 2.5 s to 2 min and sample length 4096 and 9000, respectively. Short recordings are padded or duplicated, while long recordings are cropped or split into overlapping recordings. These adaptations ensure that model architectures can leverage batch processing, allowing consistent feature extraction from various datasets. While the techniques vary across studies, they all attempt to bring the length and format of definitions to a more acceptable level to facilitate feature extraction and model training. According to Table S8, these approaches were analyzed in 25 papers.Techniques T06–T12In total, 41 techniques were identified in categories T06–T12, reported across 34 studies: 14 techniques in T06, 11 in T07, 11 in T08, 2 in T12, and 1 each in T09–T11.Techniques to balance classes (T06) are shown in Table 4; oversampling methods such as SMOTE and GAN, as well as downsampling and replication, are countermeasures to improve class balance. Techniques of data cleaning (T07) are used to remove redundant and missing values, noise, indistinct segments, duplicate values, and anomalous signal parts to add accuracy to the input. The techniques of augmentation (T08) apply operations such as cropping, jittering, warping, and noise insertion to diversify data and limit overfitting. Several less-often-reported categories serve specialized preprocessing roles. Overall, the objective of these techniques is to improve data quality, balance classes, and increase variability.
5.2. RQ2
The classification of 121 DL techniques into seven families is shown in Table 5. The seven families put forward complementary techniques that should achieve optimal results on ECG data. Also, we can see the trend in use of each technique family. CNN models prevail in the literature, owing to their ability to extract morphological features from complex ECG signals across one or more leads. RNN-based modeling may be rare when compared to the above-mentioned models, but have their uses too. They can model the rhythm of a sequential dependence quite well. Hybrid CNN-RNN frameworks combine CNNs and RNNs that enable the use of spatial and temporal representations. Despite being less so, the transformer-based model introduces scalability and parallelization indicating a promising way forward in long-range dependencies. Increasingly adopted models with enhanced attentional abilities emphasize the importance of interpretability and the dynamic weighting of features in clinical applications. Generative and contrastive methods are useful for representation learning and improving data use efficiency, especially when labels are scarce. Last but not least, the custom/ensemble/NAS models show the architectural optimization and deployment efficiency pursuit.
As a whole, these families exemplify methodological diversification: CNNs remain the backbone, but attention mechanisms, generative paradigms, and automated design search are becoming increasingly important. This comparative lens not only highlights contributions of different families but also their interplay to shape end-to-end ECG analysis. Supplementary Table S1 includes a full list of all 121 techniques plus references for complete transparency and traceability.
5.3. RQ3
To assess the 52 databases referenced in the studies reviewed, we must first assign standard abbreviations to the cardiac conditions that cause arrhythmic and ischemic effects since each database states which condition it will cover. Supplementary Table S2 contains the full list of abbreviations. The databases serve multiple functions in model development and evaluation, such as training, validation, testing, and inference. Most of the reviewed studies relied on more than one data source because a single database rarely provides sufficient diversity in terms of pathological classes, patient age ranges, recording devices, or annotation quality. The 17 databases most frequently used across studies—together with the cardiac conditions they cover and the studies in which they were applied—are detailed in Supplementary Table S3, while the 35 databases used in a single study are listed in Supplementary Table S4.
Figure 8 presents the statistics on the use of the 52 databases across the selected studies. In total, these databases were used 163 times. The six most-often-employed databases—CPSC-2018, MIT-BIH, PTB-XL, CinC2017, AFDB, and Chapman–Shaoxing ECG Dataset—account for 57.64% of all instances of use. By contrast, the 35 databases used only once represent 21.47% of the total usage.
Table 6 complements the information in Supplementary Tables S3 and S4 by detailing the key characteristics of the 52 identified databases. Supplementary Table S5 provides download links for the 28 public databases.
5.4. RQ4
In total, 163 types of cardiac arrhythmias and ischemia were identified; these are listed and abbreviated in Table 6. Supplementary Tables S3 and S4 indicate the databases and studies in which they appear. Figure 9 illustrates the percentage of studies addressing the 14 most-often-investigated cardiac pathologies out of the total selected studies. Among them, AF was the most studied, appearing in 84 of the 121 studies (69%). It should be noted that some studies included more than one pathology.
The articles corresponding to the pathologies shown in Figure 9 were identified from Tables S3 and S4 and are summarized in Supplementary Table S6 according to usage count and references.
5.5. RQ5
Table 7 presents the 11 metrics employed in the studies analyzed in this review. Each metric is accompanied by a precise definition and the recommended scenario for its application.
Figure 10 presents the distribution of results by performance metric for the 121 end-to-end DL models for CAIC analyzed in this review. These results of each metric are not necessarily comparable because the studies relied on different databases that vary in the number of classes, the degree of class imbalance, and the allocation of data for training, validation, or testing. The F1-score, precision, accuracy, and sensitivity metrics show high values (above 95%) but with dispersion. AUROC and specificity also achieve high values, though with low dispersion. By contrast, AUPRC and Macro-F1 show more scattered values, generally below 90%. Finally, G-Mean, NPV, and mAP were each reported in only one study, with values around 95%.
5.6. RQ6
Interpretability is the inherent ability of a model to be understood, both in terms of its internal logic and the way it generates results. This is characteristic of so-called white-box models, like Support Vector Machines or Linear Regression, whose structure and operation are transparent. Unlike ML models, DL models can be seen as black boxes. This is due to their complex architectures that have thousands or millions of trainable parameters between any two layers. As such, it is difficult to ascertain the logic behind the inference made by DL models. Incorporating explainability mechanisms helps uncover or clarify the decision-making of the models. Explainability can be applied post hoc, that is, externally after training, using techniques such as weighted activation maps (Grad-CAM). Alternatively, it can be embedded directly into the model’s design, as in architectures based on attention mechanisms. In either case, the explanations do not fully eliminate the opacity of DL models but instead provide a partial—yet valuable—approximation of the reasoning behind their outputs.
Table 8 presents the 23 explainability techniques identified across 43 selected studies, along with brief descriptions and their type of explainability.
6. Challenges of CAIC End-to-End DL and the ECG
The challenges discussed in this section refer to the barriers and limitations that hinder the development of CAIC through end-to-end DL techniques and the use of ECG signals, as well as their integration into hospital systems. These challenges were identified using the method described in Section 6.1, with its execution detailed in Section 6.2, and the results—which outline the specific challenges—presented in Section 6.3.
6.1. Method
The method used to identify challenges in CAIC through end-to-end DL and ECG comprised five phases:
- Phase 1. Study Inventory: Relevant information on CAIC using end-to-end DL and ECG was collected from the specialized literature.
- Phase 2. Determination of the Purpose of each Analysis Aspect: The purpose of each analysis aspect was derived from its definition.
- Phase 3. Inventory of Challenges in the Analysis Aspects: A comprehensive review of the challenges reported in the collected studies was conducted for each analysis aspect.
- Phase 4. Identification of Unaddressed Challenges: Gaps not addressed in the literature were determined by comparing the inventory of challenges with the stated purposes of the analysis aspects.
- Phase 5. Discussion of Findings: The challenges identified in the previous phases were discussed, highlighting their implications for future research and the development of CAIC solutions. This phase is presented in Section 5.
6.2. Development
In Phase 1, described in Section 3, 121 relevant studies on CAIC using end-to-end DL and ECG were identified. These studies formed the basis for compiling inventories across the following aspects: preprocessing techniques, end-to-end DL methods, databases used, cardiac pathologies studied, evaluation metrics, and explainability approaches. These aspects constitute the analytical dimensions of this review. Because challenges in these areas directly affect the development and implementation of end-to-end DL models for CAIC with ECG, Phase 2 established the purposes of each aspect, which are presented in Table 9.
In Phase 3, fifteen difficulties were identified for end-to-end DL techniques, as reported in 53 of the selected studies (Table 10). Additionally, Table 11, Table 12, Table 13, Table 14 and Table 15 detail the difficulties associated with each of the remaining five analysis aspects.
Eighteen database-related challenges were identified, explicitly reported in 72 of the selected studies (Table 11). The effects of these challenges on DL model performance are also detailed.
Table 12 presents the 10 difficulties related to pathologies identified across 48 selected studies, together with their effects on model performance.
Two difficulties were identified in preprocessing techniques (D43 and D44), reported in 33 of the selected studies, and one difficulty (D45) in the metrics used. Table 13 presents these difficulties along with their effects on model performance evaluation.
Finally, Table 14 presents the eight difficulties related to explainability techniques, identified in 16 of the selected studies. Each difficulty is associated with a specific explainability method.
6.3. Unaddressed Difficulties
In Phase 4, the difficulties reported in the selected studies (Table 10, Table 11, Table 12, Table 13 and Table 14) were cross-referenced with the objectives of the analysis aspects defined in Table 15. This process allowed the identification of 17 difficulties not yet addressed in the literature, which are presented in Table 15.
7. Discussion
7.1. About Preprocessing
Though end-to-end DL models seek to minimize human intervention when conducting ECG analysis, evidence from the 121 reviewed studies shows that preprocessing remains both unavoidable and highly heterogeneous (Table 3 and Table 4). Specifically, 86.7% of the papers used between 1 and 4 of the 12 reported techniques, while 6.7% used no preprocessing at all. This pattern indicates a continuing lack of standardization, which hampers comparability. Segmentation (T03) and length normalization (T05) dominate the landscape, as seen in Figure 7, owing to the technical necessity of fixed-length inputs [155]. The fixed-window segmentation [61] is simpler to deal with than beat-based segmentation [84,91]. However, the first approach might not align with the clinical events of interest. The second approach will align with the clinical events and is more precise but it requires the use of manual feature engineering from the original signals, which is error-prone. This dichotomy indicates the trade-off between automation and clinician fidelity. The absence of a standard protocol is further reflected in amplitude normalization (T02), using Z-score mostly and Min–Max infrequently; this situation makes reproducibility difficult (D19). In the same way, noise and artifact removal (T01) is performed by digital bandpass filters having various cut-off frequencies, indicating different filtering criteria. Resampling (T04) introduces another source of variation because the sampling frequency is not agreed upon; it is commonly downsampled, resulting in a loss of resolution. Additional techniques, including the initial cleaning of data (T07) [75,110], are generally performed manually and considered optional. This highlights concerns about the robustness of the model under real-world inference. In the same way, the data balancing class (T06, T08) is hardly used, which indicates that there were no efforts taken to prevent the establishment of bias or to improve generalizability. Thus, while end-to-end DL models are oriented towards minimal and automatic preprocessing, it is nevertheless an essential component. It is even more important that the varied parameters and configurations used across studies diminish comparability and prevent meaningful conclusions. The evidence suggests that the field is still in flux: aiming for end-to-end automation but being foiled by the absence of standardized preprocessing pipelines.
The surveyed literature identified the aforementioned two vital difficulties in preprocessing that could influence the performance and generalizability of the models (Table 13). The first one refers to the high level of noise and artifacts, which were not taken into consideration during training (D43). Although this approach helps with this issue, misclassification still occurs in the presence of huge noise [78]. This indicates that clinically oriented models should include a separate noise class along with a normal and a pathological class to reject highly corrupted signals. The second problem concerns the unrealistic generation of the synthetic data (D44), leading to fake patterns [128]. When balancing techniques are used, synthetic data can reproduce biases from the original clinical datasets (such as population composition, acquisition protocols, or labeling practices) [170]. As a result, this decreases generalization or explainability. Beyond these challenges discussed, there are more limitations left unaddressed (Table 15). One of the most paramount challenges is the lack of automatic signal quality control in real life (D56), not only for excessive noise but also for loss of signal, saturation, and baseline drift. Another major problem is the lack of a common standard for mapping out the multichannel preprocessing across heterogeneous acquisition devices (D55). Interoperability problems and data approach issues limit models’ applicability in different clinical settings. The results of these findings, taken together, require the automated preprocessing strategies used to be adaptive and robust to a wide range of scenarios [74] and fully integrated in the pipeline for real-world use [18]. Preprocessing is essential; however, it continues to be diverse, subjective, and human-driven. These factors hamper reproducibility and limit the generalization of DL models to uncontrolled clinical scenarios.
7.2. About End-to-End DL Techniques
The wide variety of end-to-end DL models for ECG-based CAIC (Table 5) suggests a rapidly evolving field. Hybrid CNN-based techniques like CNN–BiLSTM and CNN–BiGRU, along with DenseNet, ShuffleNet, and SqueezeNet [20,21,83,85], continue to dominate with the dual purpose of capturing temporal information and spatial representation [84]. Despite this, there is a growing interest in newer architectures, namely, transformers and attention networks, which learn to model global dependencies and can scale better. Apart from the architecture, the increasing maturity of methodological innovations include contrastive learning [73], multitask and continuous learning [55], transfer learning, autoencoders, and knowledge distillation [68]. In summary, these approaches indicate a growing interest in autonomous and generalizable models as a way to tackle the issues of multi-derivation, multi-class, and multi-label classification. Emerging paradigms are suggesting that the convergence of hybrid CNNs is signaling a turning point in the field, with solutions based on systems rather than incremental improvements aimed at efficiency, adaptability, and clinical relevance.
Despite enhancements, end-to-end deep learning techniques continue to encounter significant obstacles for deployment in hospitals (Table 10, D14). The hurdle for the architectures (D02), which entails their complexity, poses the largest trouble and includes problems related to large annotated datasets, hardware requirements, and fine-tuning. This constraint limits portability (D08) and implementation in low-resource contexts. Utilizing several leads (D03) heightens the complexity of the model, which may result in increased overfitting risk when data are scarce or imbalanced [73]. Similarly, long-sequence (D01) analysis has yielded hybrid CNN designs that capture temporal dependencies of higher complexity. Biases in methodology still exist, and the lack of external cross-validation (D15) has a debilitating effect on robustness, as many models fail when their use is extended over different equipment, environments, or patients [18]. The issue is broader: end-to-end DL models are sensitive to the bias of the training data and perform worse on out-of-distribution and out-of-typical-distribution scenarios with comorbidities. Undefined challenges (Table 15) aggravate these constraints. Despite the existence of sophisticated optimizers [59], D58 hyperparameter optimization is still mostly manual. The use of semi-supervised learning (D59), like contrastive learning [40,73], to make better use of unlabeled data could be a great solution. Similarly, the limited diagnostic capacity of the algorithms is due to their lack of real-time adaptability (D54); continuous learning [55] can overcome this limitation and enable models to incorporate new expressions of cardiac diseases while retaining acquired knowledge. Overall, both the explicit and the overlooked challenges call for the need for efficient strategies and personalization mechanisms. End-to-end deep learning models require strengthening of validity, generalizability, and robustness in order to go from proof-of-concept to reliable tools for clinical use.
7.3. About Databases
The inventory revealed the use of 52 different ECG databases (see Table 6 and Table 7) but with significant variability with respect to class definitions, sampling frequency, number of records, number of leads, duration of recording, and availability of datasets. The presence of this heterogeneity indicates a severe lack of standardization (D19) that undermines model transferability and comparability critically [171]. Only 17 databases were reused across studies (Table S3), while 35 appeared only once (Table S4). The reuse of such few resources signifies the cleft benchmarking practices witnessed across the NLG domain. Figure 8 also shows that seven databases—CPSC-2018, PTB-XL, MIT-BIH, AFDB, CinC2017, Chapman–Shaoxing, and MIT-BIH—together account for 82.6% of the usage. An excessive reliance on any single dataset, mainly for fine-tuning a model, can incur domain bias and restrict inter-dataset generalization (D23) [16]. While a model may perform convincingly on a single source, it may not necessarily extend its range of efficiency to other sources [29]. These worries are echoed in Figure 11 and Figure 12. As illustrated in Figure 11, nearly half of the databases, out of the 52, are private. Furthermore, the other 28 are solely publicly accessible. Finally, two come under restricted Data Use Agreements. According to Table 6, 46.15% of databases have no public access (D21), obstructing transparency, reproducibility, and collaborative advancement. Of the public datasets, only 13 contain 12-lead recordings, the distribution of lead diversity is illustrated in Figure 12. Others offer far fewer leads, such as one, two, or fifteen. This makes it difficult to generalize our model to other acquisition setups. The majority of the 31 databases, supporting 12 derivations and 16 multi-labels (most of which also use 12 leads), have similar technical characteristics. However, the technical richness is not evenly distributed and is often restricted to the most reused datasets. Consequently, a relative wealth of resources is available but researchers tend to use an unrepresentative subset due to access limits and benchmarking bias. In order to address the above limitations, it has been argued that future research should use a multiplicity of data and report results over databases not used for the training [59,71]. This would make a broader validation of the results possible and reduce the risk of becoming too specific to the dataset.
The studies in Table 11 that discuss the reported issues reveal major shortcomings that clearly affect robustness, generalizability, and clinical relevance. Class imbalance (D17) is one of the issues that biases the model in favor of the majority class, with performance losses for all other clinically important conditions. Another common issue is the lack of large, diverse, and well-annotated datasets (D18), which poses challenges for adequate training. Besides these stated impediments, there is an unraised challenge: the development of databases with synthetic signals (D61) to introduce difficult-to-capture rare or paroxysmal patterns resembling real signals in order to incorporate events of rare occurrence [88]. The task overlaps with D44 (unrealistic synthetic data generation), where the model may learn the non-existent and, thus, result in a lack of generalizability and explainability [85]. As such, synthetic data should be sufficiently faithful to the complex form and change patterns in varied pathology (D40, D41). In this paper’s subsection, we will expand on the challenge posed by D61, as well as the significance of overcoming it in allowing end-to-end DL techniques to lessen the dependence on costly expert annotation (D18) and improve class equity by better representing minority classes. All these challenges, taken together, indicate that databases are not just a collection of data [84], but rather they are the cause of several serious limitations; databases should not just be accessible but also diverse, standardized, and clinically supported in order to enable building robust high-performing models in common clinical settings [172].
7.4. About Cardiac Pathologies: Cardiac Arrhythmias and Ischemia
The cardiac pathologies inventory (Tables S3 and S4) suggests that the studies tackled a very high number of pathologies, i.e., 153 pathologies (not merely conditions). However, the said data are inequitably represented in the studies, exhibiting a bias in focus. According to Figure 9, only a handful of cardiac conditions have been mainly researched since 69% of studies covered atrial fibrillation. Further, the other major studies also involve PVC and PAC. Diseases that are rarer or more complex than others receive less attention. This trend illustrates the long-tail issue [107,173], which constrains their clinical applicability and diagnostic value for the variety of diseases less often covered in research; this is also true for other models.
Cardiac conditions pose intrinsic challenges (Table 12) due to their dynamic physiology and definition in ECG expression (D40) [55], which often leads to misclassification. The subtle differences between arrhythmias such as AF and AFL (D34) create complications for multi-class tasks, while high intra- and inter-patient variability (D36) impedes generalization. It is observed clinically that comorbidities (D35) are quite common; however, this area is poorly studied [71,113,174]. Episodic conditions such as paroxysmal AF [153] need long recordings (such as Holter and patches) [92,110]. On the other hand, persistent rhythm scenarios were focused on models. One critical gap is neglecting the former expression for dynamic pathology changes (D62). Existing models use fixed windows [101], failing to account for the evolution of other disease like infarction progression or AF transition. The utility in a clinical context is, therefore, reliant on classifications made at a given moment in time as well as on tracking the evolution through time [110]. In conclusion, these limitations thus advocate for the need to build more adaptive and robust DL models to cope with the variability and complexity of cardiac diseases.
7.5. About Evaluation Metrics
The metrics used in the studies reviewed, both per class and aggregated, included 11 different metrics (Table 7). The three most commonly used metrics were recall, accuracy, and F1-score. The F1-score is the harmonic mean of precision (M01) and sensitivity (M02), and is especially useful for unbalanced datasets [94]. However, accuracy, by itself, is a misleading metric since it may be inflated by true negatives or dominating classes like normal rhythm. Figure 13 establishes the trend. The usage of F1-score, recall, and accuracy by far dominates in usage. As for the specialized metrics AUPRC, NPV, G-Mean, and mAP, they are rarely applied. AUROC, specificity, and precision exhibited an average value of (about) 95 percent with low dispersion, but they are still biased toward describing the majority class performance. It is worth noting that only four studies [76,175] made use of AUPRC, which is the more useful metric for rare events, whereas Macro-F1 (M08) and mAP (M11) occurred in just two and one studies, respectively. The performance of minority classes is often underreported to mask the weaknesses of the clinical applicability of the method. Using global metrics because they are widely accepted instead of the more class-conscious ones indicates a benchmarking bias that undermines evaluations of long-tail pathologies. To improve robustness and fairness, future studies should aim to use metrics that look at performance across all classes, particularly in uneven and multi-label situations.
While traditional metrics are still commonly used, there is no standardization in their use (D45). This causes a problem as comparing studies becomes impossible. One of the unaddressed issues (see Table 13) concerns the low usage of metrics that evaluate either explanation quality or confidence (D63), which is important for the clinical uptake [172]. In addition, the metric selected is often driven by statistical convenience rather than medical relevance (D64), and the potential impact of a false negative is often overlooked; in the case of arrhythmia, this could be a delayed diagnosis. Accuracy, for example, does not reflect these clinical consequences [107]. The described failings relate to problems of explainability, such as the inability to retrace reasoning (D51), the lack of validation of highlighted regions (D53), or uncertainty that visualizations (e.g., Grad-CAM) are consistent with cardiological knowledge (D49). Without solid evaluation, we do not trust the “black box” (D02). In summary, the data suggest that a standardized evaluation framework aligned with clinical goals is necessary to validate models technically and medically.
7.6. About Explainability Techniques
The clinical adoption of DL models is hampered due to limited model explainability [76,78]. Of the 121 studies reviewed, only 59 of the studies used at least 1 of the 23 techniques (Table 8), indicating low priority. There are two kinds of interpretability techniques: post hoc (like Grad-CAM, salience maps, SHAP, and t-SNE) and integrated (like attention and NBET). As shown in Figure 14, post hoc methods are the most used methods among interpreters. Both techniques Grad-CAM and t-SNE are the most used post hoc techniques, whereby Grad-CAM was the technique most commonly encountered in 18 studies as a visualization tool for indicating important ECG regions. Out of the 18 studies analyzed, attention mechanisms are the most common integrated approach [108] for improved training transparency. Overall, the real impact of integrated means (especially spatial and temporal attention (TE02 and TE08)) is not effective explainability. The limited use of hybrid or post hoc/integrated approaches indicates a failed attempt to align interpretability with complexity. The evidence indicates that explainability is viewed as important, but implementation is sporadic and often superficial, limiting trust and clinical uptake.
In spite of certain accomplishments, the clinical utility of current capabilities is limited by eight reported shortcomings. Attention mechanisms in ECG signal processing may fixate on unrelated areas (D46), while the Grad-CAM maps may share too much overlap (D48), thus leaving attributing the model prediction open to interpretation. The clinical applicability is further constrained by five more challenges (Table 15) that have not been addressed. Customized visual tools are lacking with respect to long-term recordings such as Holter data (D67). This makes it difficult to find episodic or late-onset events (D71). The visual techniques also face challenges in a multi-label or multi-lead context (D69). This is because merged explanations do not indicate which class or lead contributes to which output (D68). For instance, myocardial infarction (MI) relies on careful analysis of the ST segment and the T wave, while atrial fibrillation (AF) relies on the rhythm and the absence of any P waves [107]; without validation specific to pathology, explainability will lose its clinical relevance. Another significant disparity is the unavailability of reference metrics to gauge concordance with clinical expectations (D70). Without tools for response evaluation (D63), we cannot quantify how much we may trust a model. Consequently, these limitations show that current techniques may improve transparency, but do not yet suffice for deployment in the clinic [176]. There is an urgent need for temporally sensitive explainability methods, pathology-adapted and compatible with long-term multi-channel recordings for reliable automated diagnosis [177].
7.7. Limitations
This study has some limitations. First, the analysis focused exclusively on six key aspects of CAIC with ECG and end-to-end DL, neglecting other relevant dimensions such as ethical and regulatory issues, implementation in portable or embedded hardware, and integration into clinical settings. Clinical validation of this study was not conducted; thus, this study may be limited from a medical point of view. In the end, although the new challenges identified in this study did not appear in the articles we reviewed, the need to validate them remains an important task for the near future to decide if they may hamper the development of robust and clinically useful DL models.
8. Conclusions
The aim of this review was to investigate CAIC with ECG and end-to-end DL techniques. This article examined the key challenges associated with them. The challenges are in the aspects of preprocessing, DL techniques, databases, cardiac pathologies, evaluation metrics, and explainability techniques. The results include extensive inventories for these six areas based on relevant, impactful studies, as well as technical barriers that limit CAIC performance and clinical implementation. Collectively, this provides a systematic overview of the current state of the field. Unlike other CAIC with DL and ECG reviews, this study only focused on end-to-end DL, where 71 challenges were identified, which are as follows: 53 found in the literature, and 18 that are still not addressed. We should consider these latter challenges to close the gap toward high-performing models. This paper indicates that preprocessing conducted at the end-to-end level of DL models is minimal, transparent, and automated to improve performance while adding no unnecessary complexity. Despite the encouraging results obtained using these architectures, the issues of generalizability and training complexity persist. In addition, there are increasing calls for databases that are more diverse and better balanced between classes, particularly for pathologies with similar morphologies, such as AF and AFL, that make the problem more complicated. There is a need for performance evaluation metrics aligned with clinical practice, as well as for more robust and explainable techniques applicable to a wider range of clinical situations. This study offers a firm basis for designing more generalizable, robust, and clinically useful solutions.
As future work, we propose conducting studies to address the identified difficulties and to accelerate the advancement of CAIC through ECG and end-to-end DL. Additionally, we recommend creating a comprehensive framework for restoring and maintaining normal heart rhythm through the classification, prediction, explanation, treatment, and simulation of arrhythmias and cardiac ischemia—an approach similar to that employed by [178]—to maximize survival in pediatric congenital heart surgery.
The reference list from the paper itself. Each links out to its DOI / PubMed record.
- 1Joseph P. Lanas F. Roth G. Lopez-Jaramillo P. Lonn E. Miller V. Mente A. Leong D. Schwalm J.-D. Yusuf S. Cardiovascular Disease in the Americas: The Epidemiology of Cardiovascular Disease and Its Risk Factors Lancet Reg. Health-Am.20254210096010.1016/j.lana.2024.10096040034110 PMC 11873637 · doi ↗ · pubmed ↗
- 2Martin S.S. Aday A.W. Allen N.B. Almarzooq Z.I. Anderson C.A.M. Arora P. Avery C.L. Baker-Smith C.M. Bansal N. Beaton A.Z. 2025 Heart Disease and Stroke Statistics: A Report of US and Global Data from the American Heart Association Circulation 2025151 e 41e 66010.1161/CIR.000000000000130339866113 PMC 12256702 · doi ↗ · pubmed ↗
- 3Chong B. Jayabaskaran J. Jauhari S.M. Chan S.P. Goh R. Kueh M.T.W. Li H. Chin Y.H. Kong G. Anand V.V. Global Burden of Cardiovascular Diseases: Projections from 2025 to 2050 Eur. J. Prev. Cardiol.2025321001101510.1093/eurjpc/zwae 28139270739 · doi ↗ · pubmed ↗
- 4Yang L. Zheng B. Gong Y. Global, Regional and National Burden of Ischemic Heart Disease and Its Attributable Risk Factors from 1990 to 2021: A Systematic Analysis of the Global Burden of Disease Study 2021 BMC Cardiovasc. Disord.20252562510.1186/s 12872-025-05022-x 40841929 PMC 12372306 · doi ↗ · pubmed ↗
- 5Reed J.L. Zaman D. Betancourt M.T. Robitaille C. Majoni M. Blanchard C. O’Neill C.D. Prince S.A. Physical Activity, Sedentary Behaviour, and Cardiovascular Disease Risk Factors in Canadians Living with and Without Cardiovascular Disease Can. J. Cardiol.20254150751810.1016/j.cjca.2024.12.02939742964 · doi ↗ · pubmed ↗
- 6Tan S.C.W. Zheng B.-B. Tang M.-L. Chu H. Zhao Y.-T. Weng C. Global Burden of Cardiovascular Diseases and Its Risk Factors, 1990–2021: A Systematic Analysis for the Global Burden of Disease Study 2021 QJM Int. J. Med.202511841142210.1093/qjmed/hcaf 02239847534 · doi ↗ · pubmed ↗
- 7Zhou J.-X. Zheng Z.-Y. Peng Z.-X. Ni H.-G. Global Impact of PM 2.5 on Cardiovascular Disease: Causal Evidence and Health Inequities across Region from 1990 to 2021 J. Environ. Manag.202537412416810.1016/j.jenvman.2025.12416839837142 · doi ↗ · pubmed ↗
- 8Roth G.A. Mensah G.A. Johnson C.O. Addolorato G. Ammirati E. Baddour L.M. Barengo N.C. Beaton A.Z. Benjamin E.J. Benziger C.P. Global Burden of Cardiovascular Diseases and Risk Factors, 1990–2019 J. Am. Coll. Cardiol.2020762982302110.1016/j.jacc.2020.11.01033309175 PMC 7755038 · doi ↗ · pubmed ↗