NLRP3 Inflammasome as Potential Predictor of Non-Responsiveness to Immunosuppressive Treatment in Lupus Nephritis
Camila Barbosa Lyra de Oliveira, Werbson Lima Guaraná, Gisele Vajgel, Braziliano Miguel da Silva Júnior, Camilla Albertina Dantas Lima, Stanley de Almeida Araújo, Fabrício Oliveira Souto, Denise Maria do Nascimento Costa, Lucila Maria Valente, Paula Sandrin-Garcia

TL;DR
This study shows that the NLRP3 inflammasome and IL1B levels may predict poor response to treatment in lupus nephritis patients.
Contribution
The study identifies NLRP3 inflammasome and IL1B as potential biomarkers for non-response to immunosuppressive treatment in lupus nephritis.
Findings
Higher NLRP3 IHC staining was associated with no PERR in lupus nephritis patients.
IL1B gene expression and IL-1β levels increased significantly in non-responders over 12 months.
Non-responders had higher IL-1β levels compared to responders at 12 months.
Abstract
Lupus nephritis (LN) can affect up to 60% of patients with systemic lupus erythematosus (SLE). The NLRP3 inflammasome has been implicated in the pathogenesis of LN. This study aimed to evaluate the role of the NLRP3 inflammasome as a predictor of response to immunosuppressive treatment in patients with active LN. A prospective cohort study was conducted with 20 adult patients with active LN, classes III, IV, and V, from January 2021 to September 2023. Patients were followed up at biopsy (T0) and 6 months (T6) and 12 months (T12) after treatment and classified according to the primary efficacy renal response (PERR) at 12 months. Gene expression of NLRP3, CARD8, CASP1, IL1B, and IL18 was evaluated by RT-qPCR in PBMCs. Immunohistochemistry (IHC) for NLRP3 was performed on kidney tissue. The concentration of cytokine IL-1β was measured using the BD™ Cytometric Bead Array (CBA). The mean age…
Genes, proteins, chemicals, diseases, species, mutations and cell lines named across the full text — each resolved to its canonical identifier and authoritative record.
Click any figure to enlarge with its caption.
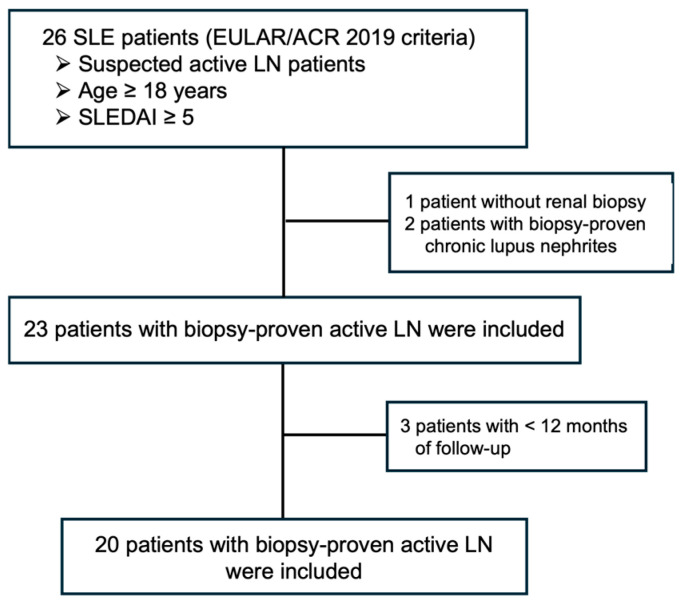 Figure 1
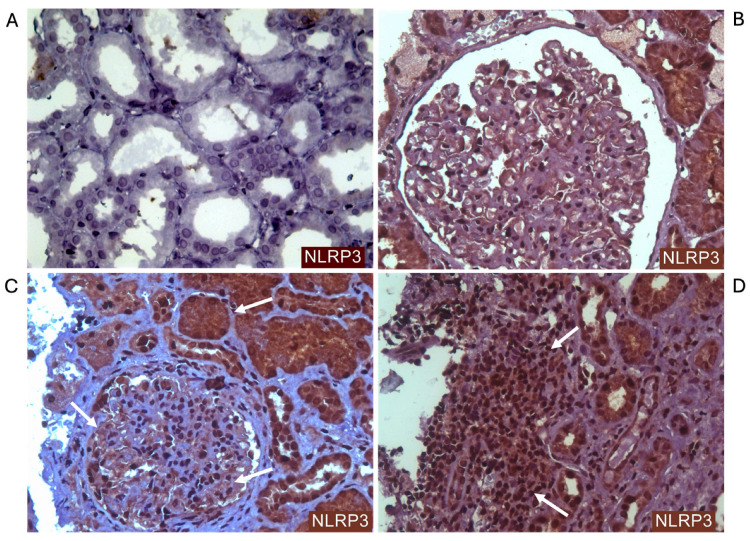 Figure 2
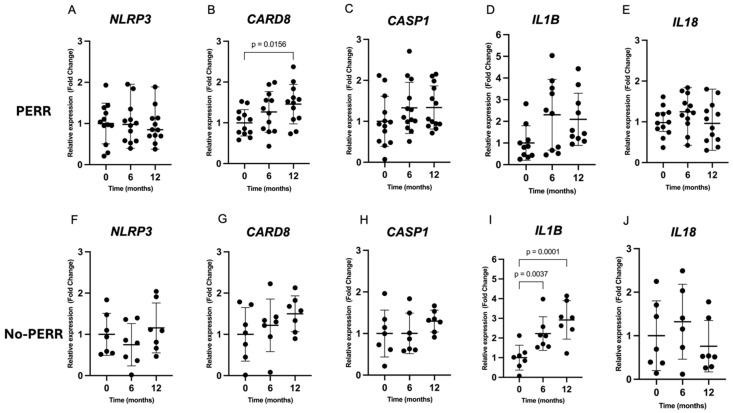 Figure 3
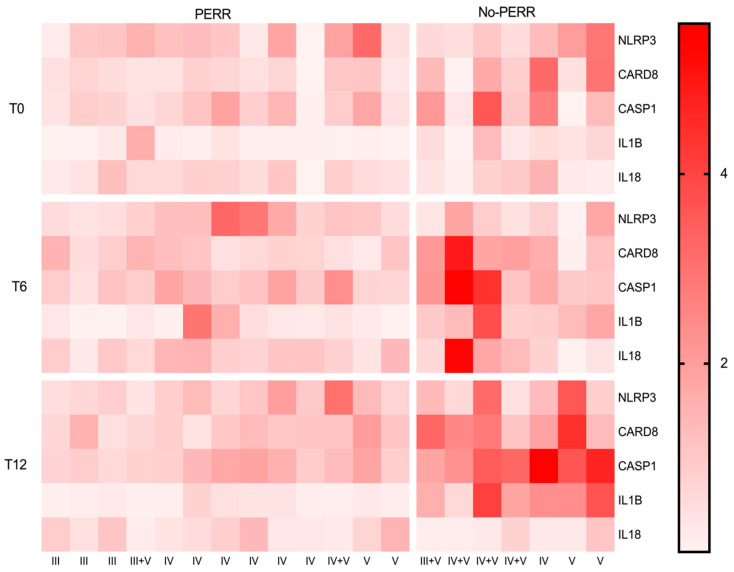 Figure 4
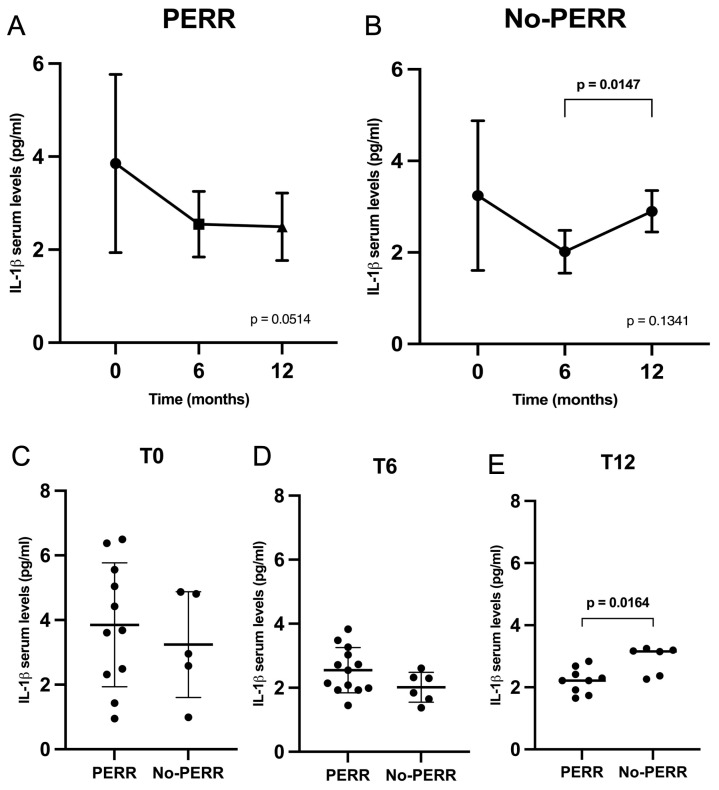 Figure 5
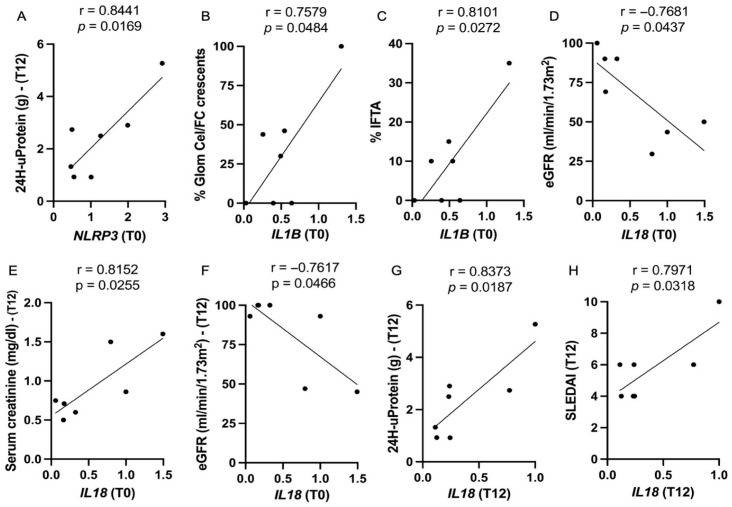 Figure 6
- —Conselho Nacional de Pesquisa (CNPq)
- —Coordenação de Aperfeiçoamento de Pessoal de Nível Superior-Brasil (CAPES)
- —Fundação de Amparo à Ciência e Tecnologia do Estado de Pernambuco (FACEPE)
Peer Reviews
No public reviews on file for this paper yet. If you reviewed it on a platform where reviews are public (OpenReview, ICLR, NeurIPS, ICML), you can paste yours below so the community can read it here.
Videos
No videos yet. Explain this paper in a talk, walkthrough, or lecture? Add one.
Taxonomy
TopicsSystemic Lupus Erythematosus Research · Inflammasome and immune disorders · Renal Diseases and Glomerulopathies
1. Introduction
Lupus nephritis (LN) is a common and severe complication of systemic lupus erythematosus (SLE), affecting up to 60% of patients and leading to significant morbidity and mortality [1,2,3,4]. Despite advances in the knowledge of LN pathogenesis, the prognosis of LN patients remains poor, with a high risk of end-stage kidney disease and death [1]. LN is characterized by complex immune deposition and kidney inflammation, leading to kidney damage. The inflammasome, a multiprotein complex that plays a crucial role in the innate immune response, has been implicated in the pathogenesis of LN [5,6,7,8,9]. Among the various inflammasome complexes, NLRP3 has emerged as a key player in LN, with its activation contributing to the development of proteinuria, podocyte injury, tubular damage, and renal fibrosis [10,11,12,13].
The NLRP3 inflammasome comprises a pattern recognition receptor (PRR), an adaptor protein, and an effector protein. The nucleotide-binding and oligomerization domain (NOD)-like receptor family pyrin domain containing 3 (NLRP3) is an intracellular PRR activated in response to pathogen-associated molecular patterns (PAMPs) and/or damage-associated molecular patterns (DAMPs). When activated, NLRP3 recruits the adaptor protein ASC (apoptosis-associated speck-like protein containing a CARD) and pro-caspase, comprising the inflammasome complex [14].
This multiprotein complex activates caspase-1, an enzyme responsible for the cleavage of the pro-inflammatory cytokines pro-IL-1β and pro-IL18 into their active forms (IL-1β and IL18) [15,16]. Caspase-1 can also activate gasdermin D, a protein responsible for forming pores in the cell membrane and disrupting the cell membrane integrity. This process results in cell lysis and the release of cytoplasmic contents, including inflammatory cytokines, a process known as pyroptosis [17]. This mechanism is responsible for amplifying the inflammatory response, recruiting and activating additional immune cells, and causing further inflammation and greater damage [18].
Previous studies have established an association between NLRP3 gain-of-function polymorphisms and increased susceptibility to developing SLE and LN [19,20,21,22]. Functional studies have demonstrated a correlation between elevated levels of the NLRP3 inflammasome and tissue damage in animal and human models [7,9,23]. Additionally, several studies have been conducted using NLRP3 inflammasome inhibitors in animal models to evaluate the effect of blocking this pathway on kidney tissue. These studies revealed a reduction in inflammasome activation, decreased expression of IL1B, IL18, and CASP1, a reduction in glomerular inflammation, and a reduction in proteinuria following the use of inflammasome inhibitors [24,25,26,27,28].
Given the increasing evidence, the NLRP3 inflammasome has been demonstrated to play an essential role in LN pathophysiology. Once activated, the NLRP3 inflammasome enhances inflammatory response, leading to significant kidney damage in both human and animal models. Despite these findings, the expression of the NLRP3 inflammasome during immunosuppressive treatment remains poorly established. This study aimed to evaluate the contribution of the NLRP3 inflammasome as a predictor of treatment response in active LN patients.
2. Results
2.1. Clinical and Laboratory Characteristics
Twenty-six patients were selected for evaluation during the period with suspected active lupus nephritis. Three patients failed to meet the inclusion criteria: one patient did not undergo kidney biopsy due to the severity of hematological manifestations (thrombocytopenia and anemia) and two patients did not have active lupus nephritis lesions in their kidney biopsy. Three patients were excluded due to having a follow-up period of less than 12 months (Figure 1). A total of 20 active LN patients were followed up for 12 months of immunosuppressive treatment.
The mean age was 31.9 ± 8.3 years, with 19 females and 1 male. Laboratory evaluation showed a median serum creatinine (sCr) of 0.8mg/dL (0.7–1.3), a median estimated glomerular filtration rate (eGFR) of 103 mL/min/1.73m^2^ (54–119), and a median 24-h urine protein level of 3.3g (1.7–4.9). The mean systemic lupus erythematosus disease activity index (SLEDAI) score was 14.6 ± 4.4, and 95% of patients had complement C3 consumption (mean C3 57.2 ± 22.6 mg/dL). Class IV was the most frequent histological pattern, occurring in 11 (55%) patients (7 patients—LN class IV; 4 patients—LN IV + V). LN class III was observed in 5 (25%) patients (3 patients—LN class III; 2 patients—LN III + V), while pure class V was present in 4 (20%) patients. Twelve (60%) patients received intravenous cyclophosphamide (CYC) as initial treatment, and eight (40%) patients received MMF. All patients received mycophenolate mofetil (MMF) for maintenance treatment.
After 12 months of immunosuppressive treatment, 13 (65%) patients achieved primary efficacy renal response (PERR). In this way, the patients were divided into two groups according to treatment response (PERR and no PERR). Clinical, laboratory, and treatment characteristics were compared between the groups at baseline (Table 1). Patients with no PERR had a longer duration of LN compared to the PERR group (p = 0.0115).
2.2. Histopathological Findings
Histopathological characteristics, the International Society of Nephrology/Renal Pathology Society (ISN/RPS) 2004 classification [31,32], activity index (AI), chronicity Index (CI) [33], and immunohistochemistry (IHC) data from baseline kidney biopsies were also compared based on treatment response (Table 2). The most common LN classification was class IV ± V, which was present in the majority of patients from both groups. LN class V, whether pure or in association with class III or IV, was more frequent in the no-PERR group (85.7%) compared to the PERR group (30.8%), although this difference was not statistically significant (p = 0.573). Cellular and fibrocellular crescents were present in nearly 65% of patients in both groups (PERR and no PERR) (p = 0.6514). The groups had a similar distribution of AI, CI, and specific histopathological features, indicating similar active disease and chronic damage at baseline.
IHC staining of NLRP3 from baseline kidney biopsies is listed in Table 3. NLRP3 staining showed significantly different intensities in inflammatory cells between PERR and no-PERR patients (p = 0.0426). Most PERR patients had weak positive (+1) (53.8%) or negative (30.8%) NLRP3 staining in inflammatory cells. In contrast, the majority of the no-PERR group had strong positive (+2) NLRP3 staining in inflammatory cells, with a significant difference compared to the PEER group (57.2% vs. 15.4%, p = 0.0210). Patients with strong positive (+2) NLRP3 staining in the inflammatory cells had a 3 times higher risk of not achieving PERR compared to patients with weak positive (+1) NLRP3 staining (RR 3.0–CI 1.4–10.3; p = 0.0210).
All patients had positive NLRP3 staining in tubular cells, and most patients in both groups had strong staining intensity. There were no statistical differences between groups in NLRP3 staining intensity in tubular cells. Compared with the PERR group, patients in the no-PERR group demonstrated a higher frequency of podocytes with strong (+2) NLRP3 staining (28.6% vs. 7.7%; p = 0.2701), although this difference was not statistically significant. Figure 2 shows IHC staining of NLRP3 in kidney tissue from active LN patients.
2.3. Clinical and Laboratory Characteristics During Follow-Up
The laboratory data were compared across the groups at 6 months and 12 months after kidney biopsy and immunosuppressive treatment (Table 4). After 6 months, the no-PERR group had lower eGFR (p = 0.0165), lower serum albumin (p = 0.0218), and higher levels of proteinuria (p = 0.0037) compared to the PERR group. After 12 months, patients with no PERR had higher SLEDAI scores (p = 0.004) and higher levels of proteinuria compared to patients with PERR. Most patients in both groups received MMF and corticosteroids in similar doses after 6 months of treatment.
2.4. Inflammasome Gene Expression Analysis
Relative gene expression over 12 months in patients with PERR and no PERR is shown in Figure 3. The relative gene expression of NLRP3, CASP1, IL1B, and IL18 did not demonstrate significant changes over 12 months of immunosuppressive treatment in the PERR group. Despite this, CARD8 expression significantly increased over 12 months in the PERR group (FC = 1.45; p = 0.0156) (Figure 3C).
In the no-PERR group, the gene expression of IL1B showed a significant increase after 6 months (FC = 2.22; p = 0.0037) and 12 months (FC = 2.91; p = 0.0001) of treatment compared with the baseline (T0) (Figure 3I). A repeated-measures analysis of variance of IL1B expression revealed a statistically significant difference between 0, 6, and 12 months (p = 0.0002). The gene expression of NLRP3, CARD8, CASP1, and IL18 did not significantly differ over the analyzed period. The comparison of relative gene expression between the PERR and no-PERR groups at baseline, 6 months, and 12 months was evaluated. NLRP3, CARD8, CASP1, and IL18 expression did not differ between the groups over the 12 months of follow-up. However, after 12 months of treatment, IL1B expression was significantly higher in patients with no PERR compared with those with PERR (FC 1.57; p = 0.0477).
Figure 4 presents a heatmap representing the gene expression of NLRP3 inflammasome-related genes (NLRP3, CARD8, CASP1) and cytokine genes (IL1B, IL18) over 12 months of treatment. The data were divided into two groups according to treatment response (PERR and no PERR) at three time points after kidney biopsy and initial immunosuppressive therapy (T0: baseline; T6: 6 months; T12: 12 months). Lighter shades of red represent lower expression levels, and darker shades correspond to higher gene expression levels. At baseline, gene expression levels were generally low for both the PERR and no-PERR groups. Across the time points, the PERR group maintained stable gene expression for most genes. In contrast, the no-PERR group showed an increase in color intensity in months 6 and 12, representing a higher expression of inflammasome genes.
2.5. Serum Levels of IL-1β
The serum levels of IL-1β in the PERR and no-PERR groups over 12 months are represented in Figure 5A,B. The PERR group exhibited a decrease in serum IL-1β within the first 6 months (3.9 ± 1.9 vs. 2.6 ± 0.7—p = 0.1255) and remained stable until 12 months (2.6 ± 0.7 vs. 2.5 ± 0.7—p = 0.9483). In the no-PERR group, IL-1β levels decreased in the first 6 months (3.2 ± 1.6 vs. 2.0 ± 0.5—p = 0.3076) but subsequently increased until 12 months (2.0 ± 0.5 vs. 2.9 ± 0.5—p = 0.0147).
The comparative analyses of serum levels of IL-1β in the PERR and no-PERR groups at baseline, 6 months, and 12 months are demonstrated in Figure 5C–E. No significant differences in IL-1β serum levels were observed at baseline and 6 months. However, LN patients with no PERR had higher serum IL-1β levels compared to patients with PERR at 12 months (2.5 ± 0.7 vs. 2.9 ± 0.5—p = 0.0164).
2.6. Correlation Analysis
The correlations between clinical, laboratory, and histopathological parameters at baseline, 6 months, and 12 months after kidney biopsy and initial immunosuppressive treatment were tested. Evaluating all patients at baseline (PERR and no-PERR groups), NLRP3 expression had a negative correlation with corticosteroid doses (r = 0.5344, p = 0.0184), and CARD8 expression was positively correlated with SLEDAI (r = 0.5084, p = 0.0262). IL18 expression had a positive correlation with fibrocellular/cellular crescents (r = 0.6257, p = 0.0042) and with the CI (r = 0.5834, p = 0.0087). In month 6, IL18 expression correlated positively with serum creatinine (r = 0.5592, p = 0.0128) and with serum IL-1β (r = 0.4760, p = 0.0459).
Evaluating the group with no PERR, baseline NLRP3 expression exhibited a strong positive correlation with 12-month 24 h proteinuria (r = 0.8441, p = 0.0164) (Figure 6A). IL1B expression was positively correlated with cellular/fibrocellular crescents (r = 0.7579, p = 0.0484) and with the extent of interstitial fibrosis and tubular atrophy (r = 0.8101, p = 0.0272), lesions linked to severe histopathological damage (Figure 6B,C).
The analysis of IL18 expression at baseline revealed a strong negative correlation with initial eGFR (r = −0.7681; p = 0.0437) and with 12-month eGFR (r = 0.7617, p = 0.0466), indicating that higher IL18 expression was correlated with lower kidney function at baseline and after 12 months of immunosuppressive treatment (Figure 6D–F). In addition, IL18 expression at 12 months had a strong positive correlation with SLEDAI (r = 0.7971, p = 0.0318) and 24 h proteinuria (r = 0.8373, p = 0.0187) (Figure 6G,H).
3. Discussion
Several studies have demonstrated an upregulation of the NLRP3 inflammasome in the kidney tissue of patients with LN, correlating with tissue damage and disease activity [7,9,23]. Despite these findings, NLRP3 inflammasome expression over the course of immunosuppressive treatment and its potential in predicting the prognosis of LN are not well-established. In our study, we observed a progressive increase in IL1B expression and serum IL-1β levels in the no-PERR group, suggesting a persistent inflammatory state. We also demonstrated that strong NLRP3 staining intensity in renal tissue was associated with no PERR after 12 months of therapy, indicating its potential prognostic value.
At baseline, both groups had similar clinical and laboratory characteristics, except for a longer duration of LN in the no-PERR group. Although this could suggest greater chronicity, the CI and specific chronic lesions did not differ between groups. The trend toward higher baseline creatinine in the no-PERR group (1.0 vs. 0.7; p = 0.0664) may reflect more severe disease, but proteinuria, SLEDAI, and activity index (AI) were comparable, indicating similar baseline disease severity.
NLRP3 immunostaining was positive in the tubular cells of all patients, with strong intensity in over 70% of patients, and this was also observed in podocytes and inflammatory cells in most LN cases. These findings are consistent with previous studies demonstrating NLRP3 inflammasome activation in both immune and intrinsic kidney cells, with associated IL-1β and IL-18 expression [9,28,34,35,36]. Importantly, patients with no PERR exhibited significantly stronger NLRP3 staining in inflammatory cells, which was associated with a threefold higher risk of non-responsiveness. Although strong podocyte staining was more frequent in the no-PERR group, it did not reach statistical significance. Baseline NLRP3 and IL18 expression levels also correlated with key laboratory markers of prognosis, supporting the relevance of NLRP3 activation intensity as a prognostic marker in active LN.
Studies using animal models have demonstrated the contribution of NLRP3 inflammasome activation to kidney inflammation, tubulointerstitial fibrosis, glomerulosclerosis, and progression of chronic kidney disease (CKD) [12,34]. NLRP3 inflammasome activation in immune and intrinsic kidney cells induces IL-1β and IL-18 release, promotes macrophage recruitment, amplifies renal inflammation, and triggers caspase-1-mediated pyroptosis via gasdermin-D cleavage [35,36]. In podocytes, IL-1β has been shown to downregulate nephrin expression, thereby interfering with podocyte structural integrity, promoting podocyte injury, and contributing to the development of proteinuria [37,38,39].
Activation of the NLRP3 inflammasome in tubular epithelial cells induces the release of pro-inflammatory cytokines, particularly IL-1β, which promotes transforming growth factor-β1-mediated fibrogenesis (TGF-β1), extracellular matrix deposition, and tubulointerstitial fibrosis [40,41,42]. These mechanisms contribute to interstitial fibrosis, tubular atrophy, persistent proteinuria, and progressive loss of kidney function [43]. This biological pathway supports our finding that stronger NLRP3 staining is associated with a lower probability of renal response, likely reflecting more intense inflammation, greater tissue damage, and worse clinical outcomes.
In the no-PERR group, higher baseline IL1B expression correlated with greater histopathological severity, including crescents, interstitial fibrosis, and tubular atrophy, while elevated IL18 expression was associated with worse baseline eGFR [43,44,45,46]. These findings indicate that increased NLRP3 inflammasome activation is linked to both acute and chronic kidney injury and impaired renal function, consistent with previous studies [12,47,48]. At 12 months, the no-PERR group exhibited higher IL1B gene expression, increased serum IL-1β levels, greater proteinuria, and higher SLEDAI scores compared to the PERR group. Despite overall low SLEDAI values, these differences indicate a more persistent inflammatory state in the no-PERR group, likely driven by sustained NLRP3 inflammasome activation and associated with poorer renal outcomes.
It is noteworthy that while IL-1β is a general inflammatory cytokine, its specific upregulation pattern—recorded over the duration of immunosuppressive treatment and correlating with renal NLRP3 staining intensity—supports the notion that the NLRP3/IL-1β axis may play a distinct role in mediating treatment resistance in LN, rather than merely reflecting a non-specific systemic inflammatory state. This strengthens the pathway’s potential as a specific therapeutic target and biomarker in lupus nephritis.
Given the increasing relevance of the NLRP3 inflammasome in the pathogenesis of LN, studies evaluating the effect of NLRP3 inflammasome blockers in kidney tissue have increased over the years. In an animal model, treatment with the selective NLRP3 inhibitor MCC950 suppressed NLRP3, caspase-1, and IL-1β activation in podocytes, resulting in reduced proteinuria and significant improvement in histological damage and foot process effacement compared to controls [38,49]. Other studies have shown that different drugs reduce proteinuria and attenuate renal damage, reinforcing the direct pathogenic role of NLRP3 inflammasome activation in kidney inflammation and podocyte injury [50,51,52].
Another relevant finding was the progressive increase in CARD8 expression in the PERR group, accompanied by lower IL-1β levels and reduced proteinuria. This observation could be attributed to the inhibitory effects of caspase recruitment domain-containing protein 8 (CARD8) on the NLRP3 inflammasome [53]. CARD8 has been characterized as an inflammasome sensor associated with anti-inflammatory and anti-apoptotic activities. CARD8 can bind and inhibit caspase-1, resulting in negative regulation of IL-1β activation. CARD8 also interacts with a nuclear factor kappa B (NF-kB) modulator and inhibits NF-κB activity, a key mediator of the priming signal required for the NLRP3 inflammasome. In addition, CARD8 can directly interact with NLRP3, preventing its binding to the adaptor ASC and inhibiting the activation of the NLRP3 inflammasome [54,55].
Gain-of-function mutations in NLRP3 and loss-of-function mutations in CARD8 disrupt their inhibitory interaction, leading to enhanced inflammasome activity and increased IL-1β secretion [55,56]. These mutations may promote a pro-inflammatory phenotype by sustaining NLRP3 inflammasome activation, leading to increased IL1B expression, higher IL-1β levels, and greater proteinuria. Although initially described as an inhibitor, CARD8 can also assemble a functional inflammasome under specific conditions, suggesting a context-dependent dual role [57,58]. In our cohort, increased CARD8 expression in responders may indicate a protective regulatory mechanism limiting inflammation.
This study has some limitations. Although prospectively followed up, the relatively small sample size may reduce the generalizability of the results. Additionally, the single-center design may limit the external validity, as the patient population may not fully reflect the heterogeneity of lupus nephritis in different clinical settings. Our gene expression analysis focused on a core set of NLRP3 inflammasome-related genes in PBMCs. It did not assess the contribution of alternative splice variants or a broader panel of inflammatory mediators, which might provide additional insights. Additionally, the observational and correlational design precludes causal inferences. Future studies with larger cohorts, longer follow-up, and multi-omics approaches are warranted to validate these preliminary findings and to explore the mechanistic links between NLRP3 activation and treatment resistance in lupus nephritis.
In conclusion, our findings suggest that stronger NLRP3 inflammasome staining may help identify patients at risk of no PERR and worse renal prognosis. Furthermore, our data suggest that IL-1β, in combination with clinical and laboratory parameters, could serve as a useful biomarker for monitoring disease activity and treatment response, contributing to more personalized management of LN.
4. Materials and Methods
4.1. Patients
We conducted a prospective cohort study of adult patients with SLE and kidney biopsy-proven active LN from January 2021 to September 2023. The inclusion criteria were age ≥ 18 years; diagnosis of SLE by EULAR/ACR 2019 [29]; SLEDAI ≥ 5; and kidney biopsy with active LN class III, IV, and/or V according to the ISN/RPS classification [31,32]. Exclusion criteria were inconclusive or inadequate biopsies (without glomeruli), follow-up time less than 12 months, patients with other autoimmune diseases, and patients with active infectious diseases.
Clinical characteristics, laboratory results, and treatment data were collected at the time of initial immunosuppressive treatment (T0), after 6 months (T6), and after 12 months (T12). Blood samples for gene expression and cytokine analysis were collected with the same frequency. Laboratory tests included serum creatinine, serum albumin, complement 3, complement component 4, urinalysis, urine protein/creatinine ratio, and 24-h urine protein.
Ethnicity was defined based on self-report and categorized as white and non-white (mixed or black). Disease activity was evaluated by SLEDAI [30]. The eGFR was calculated using the CKD Epidemiology Collaboration (CKD-EPI) equation [59]. Hypertension was defined as having a supine systolic blood pressure of ≥140 mmHg or a diastolic blood pressure of ≥90 mmHg in two consecutive measurements or treatment with antihypertensive drugs. SLE duration was defined as the interval from clinical and laboratory diagnosis to study enrollment [29]. LN duration was defined as the time from laboratory diagnosis (persistent proteinuria ≥ 500 mg/24 h or a protein-to-creatinine ratio ≥ 0.5, with or without urinary sediment abnormalities) to enrollment [60].
4.2. Histopathological Characteristics
The histological diagnoses were performed by an experienced kidney pathologist according to the ISN/RPS classification [31,32]. Glomerular and tubular lesions were evaluated using quantitative analysis. The AI and CI were based on the modified NIH activity and chronicity score system (AI range: 0–24; CI range: 0–12) [33]. Biopsy evaluation included immunofluorescence with staining for IgG, IgA, and IgM isotypes, kappa and lambda light chains, and complement components C3 and C1q.
4.3. Immunohistochemistry of Kidney Biopsy
Serial 4 mm histological sections were obtained from paraffin blocks and subsequently placed on salinized slides. The monoclonal antibodies IgE and NLRP3 were applied. The IHC technique involved the use of an amplified polymer according to the method recommended by the IHC Manual from the Brazilian Society of Pathology, and the slides were processed with diaminobenzidine. The background staining was performed with hematoxylin. Negative controls consisted of the replacement of primary antisera for rabbit or goat immunoglobulins of the same primary antibody class. IHC of NLRP3 was performed using primary antibodies against NLRP3 (AB_2746855; Thermofisher). NLRP3 staining intensity was graded on a scale of 0–2, according to the following assessment: no detectable staining (0), weak positive staining (1+), and strong positive staining (2+).
4.4. Treatment Protocols
The therapeutic regimen followed the standard hospital protocol, and treatment decisions were made exclusively by the attending physicians without any influence from the research team. Initial therapy consisted of high-dose glucocorticoids combined with either intravenous CYC or oral MMF, selected by the physician based on efficacy, safety, quality of life, and patient adherence. Glucocorticoid therapy included methylprednisolone pulses (0.25–0.5 g/day for 1–3 days, depending on disease severity), followed by oral prednisone (0.5–1.0 mg/kg/day).
CYC could be administered using a low-dose regimen (500 mg every 2 weeks for 3 months) or a high-dose regimen (0.5–1.0 g/m^2^ monthly for 6 months). MMF was initiated at 2–3 g/day, targeting a dose of 3 g/day. In cases of insufficient response after 3–6 months, physicians switched therapy from CYC to MMF or vice versa. Patients who responded to initial treatment received maintenance therapy with MMF (1–2 g/day) or azathioprine when MMF was contraindicated.
4.5. Definition of Treatment Response
After 12 months of immunosuppressive treatment, patients were classified according to their response, categorized as having PERR or no PERR. Kidney Disease Improving Global Outcomes (KDIGO) defines PERR as proteinuria ≤ 0.7 g/day and eGFR no worse than 20% below the pre-flare value or at least 60 mL/min/1.73 m^2^ without the use of rescue treatment for treatment failure. PERR has been associated with favorable long-term kidney outcomes in large cohorts, and its use is recommended by LN KDIGO guidelines [60,61,62,63].
4.6. Peripheral Blood Mononuclear Cell Isolation, RNA Extraction, and cDNA Synthesis
Peripheral Blood Mononuclear Cells (PBMCs) were isolated using Ficoll-Paque^®^ PLUS (GE Healthcare, Chicago, IL, USA) from 4 mL of peripheral blood collected in tubes containing EDTA. The RNA was extracted by TRIzol^®^ (Invitrogen, Carlsbad, CA, USA) according to the manufacturer’s instructions. The quantity and purity of total RNA were assessed separately. RNA concentration (quantification) was determined by spectrophotometry Nanodrop (ThermoFisher Scientific, Waltham, MA, USA) by measuring absorbance at 260 nm, and the samples were diluted to a working concentration of 100 ng/μL. Purity was evaluated based on the A260/A280 and A260/230 absorbance ratios, with only samples exhibiting values between 1.8 and 2.1 and greater than 2.0, respectively, being accepted [64]. Additionally, RNA integrity was assessed by electrophoresis on a 1% denaturing agarose gel containing formaldehyde to maintain RNA integrity. The samples were previously mixed with a denaturing loading buffer, heated at 65 °C for 10 min, and cooled on ice before loading. Electrophoresis was carried out at 5 V/cm for approximately 60 min in a submerged system containing 1X TBE buffer. After the run, the gel was visualized under ultraviolet light.
cDNA synthesis was performed with 500 ng of each RNA sample using the GoScript™ Reverse Transcription System (Promega, Madison, WI, USA), following the manufacturer’s instructions.
4.7. Gene Expression Analysis
The gene expression assays were performed with TaqMan^®^ fluorogenic probes to measure the target genes NLRP3, CARD8, CASP1, IL1B, and IL18 (Thermo Fisher, Madison, WI, USA). “The TaqMan assay for NLRP3 (Hs00918082_m1) detects the canonical transcript variant encoding the full-length protein isoform. While multiple splice variants exist, this assay targets the predominant isoform associated with inflammasome activity”. The reference genes ribosomal protein P0 (RPLP0) and elongation factor 1-alpha 1 (EF1A) were used for data normalization. The experiments were performed on the ABI7500 real-time PCR system (Thermo Fisher, Madison, WI, USA).
Relative quantitative expressions were calculated following the fold change (FC) method suggested by Schmittgen and Livak for the assays: FC = 2^−ΔΔCq^ or [65].
4.8. Serum IL-1β Quantification
Serum samples were collected at three time points (T0, T6, and T12) and stored at −80 °C until cytokine quantification was performed. The concentration of cytokine IL-1β was measured using the BD™ Cytometric Bead Array (CBA). The analyses were performed on the Accuri C6 flow cytometer (BD Biosciences, Franklin Lakes, NJ, USA).
4.9. Statistical Analysis
Normal distribution was tested using the Shapiro–Wilk test. Descriptive statistics were presented utilizing the mean ± standard deviation for parametric data and median and interquartile range for non-parametric data. Quantitative differences in paired gene expression samples were evaluated using one-way ANOVA or the Friedman test. Comparisons of continuous variables were conducted using the t-test or the Mann–Whitney test, depending on the normality of the distribution. Categorical variables were compared using Fisher’s exact test. The Pearson or Spearman correlation coefficient was used to evaluate the relationship between gene expression analysis and clinical, laboratory, and histopathological parameters. Statistical significance was defined as a p-value < 0.05. Statistical analysis was performed with GraphPad Prism (version 10.2.3).
The reference list from the paper itself. Each links out to its DOI / PubMed record.
- 1Hanly J.G. O’Keeffe A.G. Su L. Urowitz M.B. Romero-Diaz J. Gordon C. Bae S.-C. Bernatsky S. Clarke A.E. Wallace D.J. The Frequency and Outcome of Lupus Nephritis: Results from an International Inception Cohort Study Rheumatology 20165525226210.1093/rheumatology/kev 31126342222 PMC 4939728 · doi ↗ · pubmed ↗
- 2Lim S.S. Bayakly A.R. Helmick C.G. Gordon C. Easley K.A. Drenkard C. The Incidence and Prevalence of Systemic Lupus Erythematosus, 2002–2004: The Georgia Lupus Registry Arthritis Rheumatol.20146635736810.1002/art.3823924504808 PMC 4617771 · doi ↗ · pubmed ↗
- 3Bastian H.M. Roseman J.M. Mcgwin G. Alarcón G.S. Friedman A.W. Fessler B.J. Baethge B.A. Reveille J.D. Systemic Lupus Erythematosus in Three Ethnic Groups. XII. Risk Factors for Lupus Nephritis after Diagnosis Lupus 20021115216010.1191/0961203302 lu 158oa 12004788 · doi ↗ · pubmed ↗
- 4Cervera R. Khamashta M.A. Font J. Sebastiani G.D. Gil A. Lavilla P. Mejía J.C. Aydintug A.O. Chwalinska-Sadowska H. de Ramón E. Morbidity and Mortality in Systemic Lupus Erythematosus During a 10-Year Period Medicine 20038229930810.1097/01.md.0000091181.93122.5514530779 · doi ↗ · pubmed ↗
- 5Gupta S. Kaplan M.J. Bite of the Wolf: Innate Immune Responses Propagate Autoimmunity in Lupus J. Clin. Investig.2021131141610.1172/JCI 14491833529160 PMC 7843222 · doi ↗ · pubmed ↗
- 6Zhang H. Liu L. Li L. Lentivirus-Mediated Knockdown of FcγRI (CD 64) Attenuated Lupus Nephritis via Inhibition of NF-ΚB Regulating NLRP 3 Inflammasome Activation in MRL/Lpr Mice J. Pharmacol. Sci.201813734234910.1016/j.jphs.2018.05.01230190171 · doi ↗ · pubmed ↗
- 7Ke P.F. Zhu Y.T. Cao S.L. Wang Y. Wu S.T. He Q.Q. Liang L.F. Li J.C. Identification of Pattern Recognition Receptor Genes in Peripheral Blood Mononuclear Cells and Monocytes as Biomarkers for the Diagnosis of Lupus Nephritis Clin. Chim. Acta 202455411778510.1016/j.cca.2024.11778538228224 · doi ↗ · pubmed ↗
- 8Wang Z. Zhang S. Xiao Y. Zhang W. Wu S. Qin T. Yue Y. Qian W. Li L. NLRP 3 Inflammasome and Inflammatory Diseases Oxid. Med. Cell. Longev.20202020406356210.1155/2020/406356232148650 PMC 7049400 · doi ↗ · pubmed ↗