Detection of Expressed Otx mRNA Isoforms in Sea Urchins by Mapping NGS Reads to Single-Gene/Transcript Sequences
Mariia A. Maiorova, Yulia O. Kipryushina, Konstantin V. Yakovlev

TL;DR
This paper shows how mapping NGS reads to single-gene sequences can detect mRNA isoforms in sea urchins, validated by RT-qPCR.
Contribution
A simplified method for detecting mRNA isoforms using single-gene/transcript mapping is proposed and validated.
Findings
Single-gene/transcript mapping can detect multiple Otx mRNA isoforms in sea urchin samples.
RT-qPCR confirmed the presence of Otx mRNA isoforms in related species and developmental stages.
The method works well for genes without overlapping exons and introns, like Otx in sea urchins.
Abstract
Determination of mRNA isoform expression is important for studying tissue-specific gene regulation and the generation of protein diversity. We tested the potential of mapping to a single-gene/transcript for the qualitative examination of mRNA isoform expression produced from the same gene, including cases where several mRNA species are expressed in samples. Using single-gene/transcript mapping, we analyzed expression of the Otx mRNA isoforms in some mRNA libraries of the sea urchin Strongylocentrotus purpuratus available in GenBank. The presence of expressed Otx mRNA isoforms was verified by RT-qPCR in the same tissues and developmental stages of the closely related species Strongylocentrotus intermedius. We found that single-gene/transcript mapping can be easily applied to genes with a simple structure lacking overlapping exons and introns, such as Otx genes in sea urchins. The…
Genes, proteins, chemicals, diseases, species, mutations and cell lines named across the full text — each resolved to its canonical identifier and authoritative record.
Click any figure to enlarge with its caption.
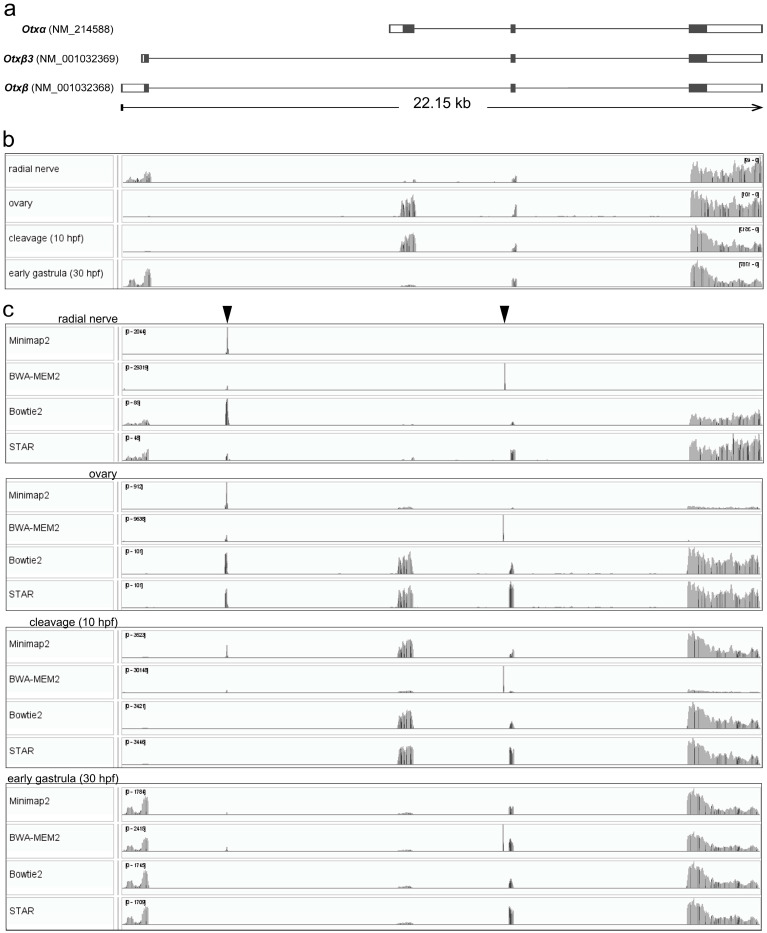 Figure 1
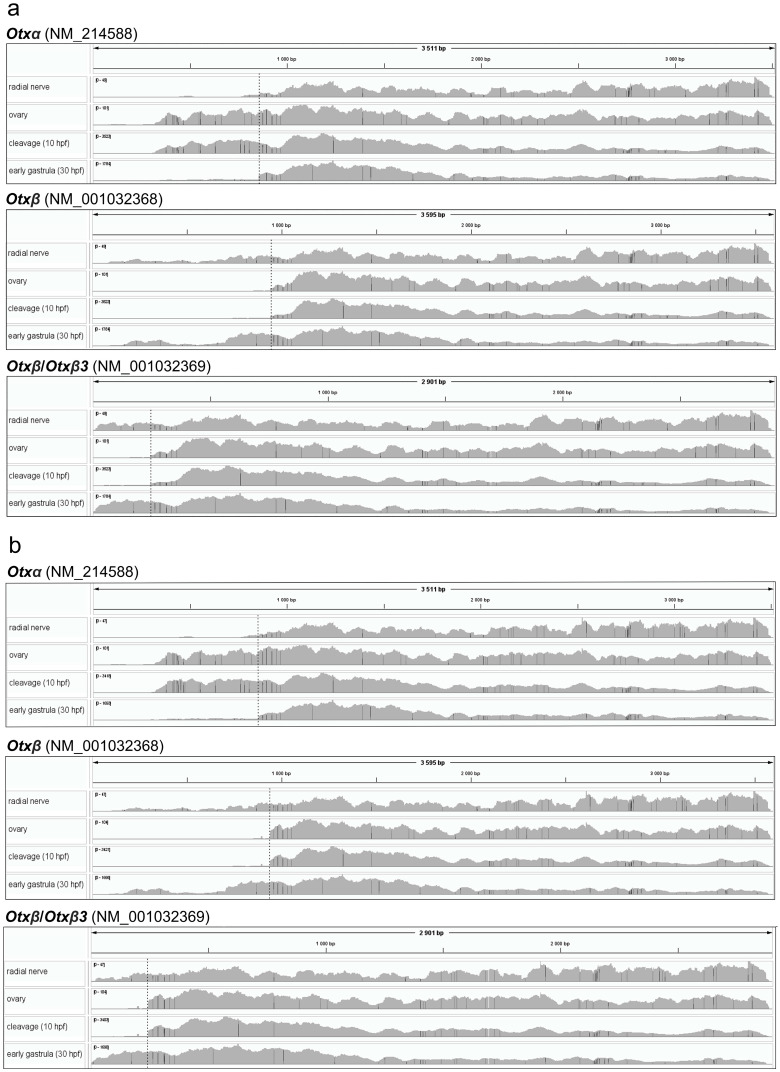 Figure 2
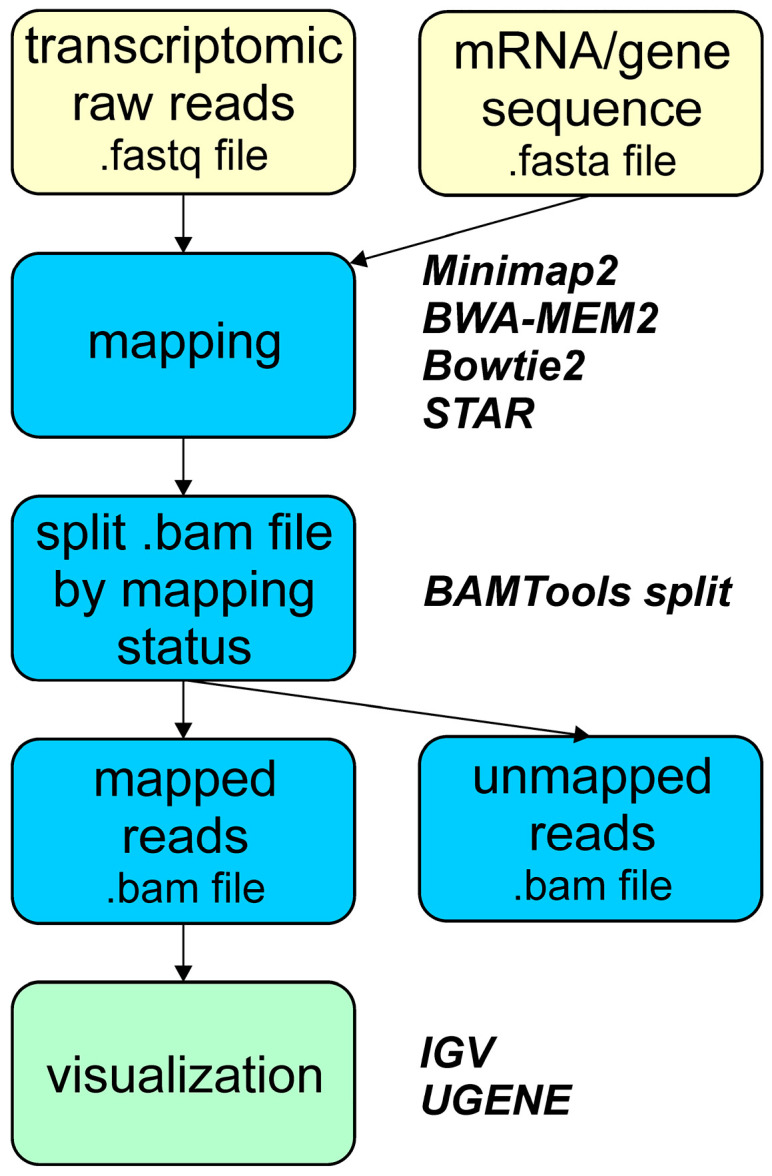 Figure 3
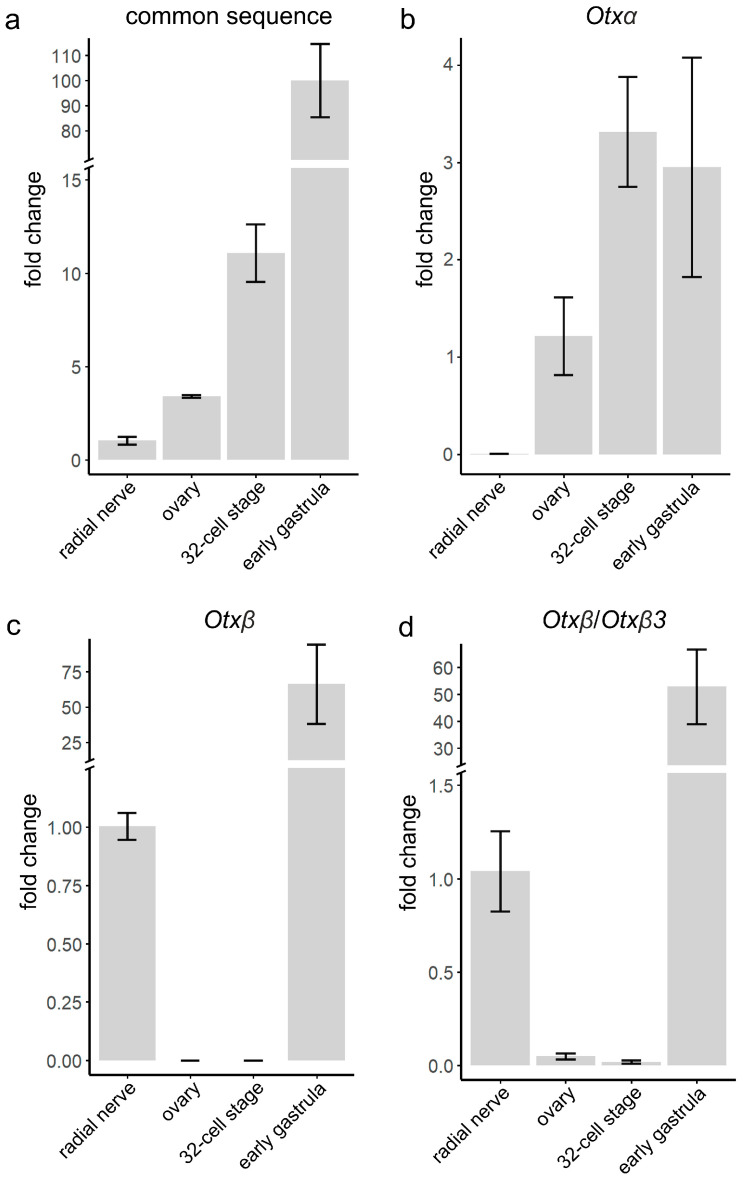 Figure 4
Peer Reviews
No public reviews on file for this paper yet. If you reviewed it on a platform where reviews are public (OpenReview, ICLR, NeurIPS, ICML), you can paste yours below so the community can read it here.
Videos
No videos yet. Explain this paper in a talk, walkthrough, or lecture? Add one.
Taxonomy
TopicsDevelopmental Biology and Gene Regulation · RNA Research and Splicing · Echinoderm biology and ecology
1. Introduction
Many eukaryotic genes have discontinuous structures consisting of exons and introns. Exons form the mRNA sequence during splicing, and introns are removed. Therefore, a single gene can encode different but related mRNA species, which are translated into different proteins called protein isoforms with diverse biological roles [1]. The appearance of different mRNA species is realized through alternative splicing, a process of exon–exon joining with different combinations. mRNA isoforms expressed from one gene can have different promoter regions if they differ in 5’UTR and transcription termination and polyadenylation sites if they have 3’UTR of different lengths [2,3].
To investigate the fine regulation of gene activity, splicing, and functions of different protein products of the same gene, it is necessary to know exactly which mRNA isoforms are expressed in the studied organism. Before the genomic era, mRNA isoforms were determined by sequencing cDNA libraries. Currently, predicted structures of genes and transcript sequences are available for many model organisms with annotated genomes. Information about expression of genes of interest (GOIs) can be found in databases, such as www.flybase.org for Drosophila, www.echinobase.org for several echinoderms, https://zfin.org for zebrafish, www.proteinatlas.org, www.gtexportal.org for human, and others. Although these databases often lack information on isoform expression, the predicted gene structures and encoded mRNA sequences facilitate the determination of specific isoform expression. For example, this can be easily performed by RT-PCR or RT-qPCR using primers that anneal isoform-specific sequences.
Another possible way to find expressed mRNA isoforms is the analysis of transcriptomic data, if they are available in the laboratory or deposited in GenBank by other investigators. Transcriptome analysis using next-generation sequencing (NGS) allows large-scale studies of RNA content. Transcriptomic analysis of mRNAs enables the identification of thousands of eukaryotic protein-coding RNA species and quantification of mRNA isoforms, known as differential isoform expression. Nevertheless, deep transcriptomic analysis at the isoform level requires advanced bioinformatic skills, such as the utilization of specialized software (e.g., DESeq, EdgeR) and expertise in scripting languages (e.g., Python, R).
Several investigators use short NGS reads to assemble and correct mRNA sequences of GOIs without performing full genomic and transcriptomic analyses, although this often goes unreported in publications. In this study, we examined how mapping of short Illumina reads against single-gene and mRNA sequences is applicable when it is necessary to detect the expression of GOI.
Sea urchins are well-known models used in toxicology research and developmental biology. Populations of several sea urchin species are substantial components of coastal ecosystems. Edible species are important in fisheries and aquaculture. The first sea urchin genome of Strongylocentrotus purpuratus was published five years after the first release of the human genome [4,5]. Here, we used two sea urchin species of the genus Strongylocentrotus to test the potential of mapping to a single gene/transcript for the qualitative examination of mRNA isoform expression produced from the same gene, including cases where several mRNA species are expressed in samples. We demonstrated that by using this approach, we can detect the presence of Otx mRNA isoforms in early development and adult tissues of sea urchins. The Otx gene encodes homeobox orthodenticle-related proteins, homeobox-containing transcription factors. Published results and current GenBank data from two sea urchins, S. purpuratus (Gene ID: 373400) and Hemicentrotus pulcherrimus of the Strongylocentridae family, showed a conserved four-exon gene structure within this family [6,7]. In S. purpuratus, three Otx mRNA species, Otxα, Otxβ, and Otxβ3, encoding two Otx proteins, are likely to be generated from the spOtx gene through alternative transcription start site usage (Figure 1a). spOtx is expressed both maternally and zygotically during early sea urchin development and plays multiple roles in embryo patterning [8,9,10,11,12,13,14,15,16,17,18]. Otxα is expressed maternally and zygotically from oogenesis to early gastrula, whereas Otxβ is expressed from the blastula stage. These mRNA species exhibit two distinct temporal and spatial expression patterns [7,17]. At later stages, Otx expression was found in photoreceptor cell types of adult rudiment of Paracentrotus lividus plutei [13]. In addition, Otx was detected in larval nervous system of Holopneustes purpurascens [12].
Known expression of Otx at the mRNA isoform level in early sea urchin development allows the use of Otx as an appropriate model for the detection of gene expression by mapping to single-gene/transcript sequences. In this paper, we employed single-gene/transcript mapping to detect the Otx mRNA species in embryonic and adult tissue mRNA libraries of S. purpuratus available in GenBank. Further, we confirm the presence of the mRNA isoforms by RT-qPCR in the same tissues and developmental stages of the closely related species Strongylocentrotus intermedius. Next, we discuss the pros and cons of single-gene/transcript mapping for the detection of expressed mRNA isoforms and how this approach is feasible for researchers with basic NGS analysis skills.
2. Materials and Methods
2.1. NGS Data Analysis
S. purpuratus SRAs used for mapping are available in GenBank (BioProject PRJNA81157). We used SRR532046 from the radial nerve, SRR531958 from the ovaries, SRR531949 from the cleavage stage (10 h post fertilization (hpf)), and SRR532074 from early gastrula (30 hpf) [19,20]. The libraries were passed FastQC (Version 0.12.1) quality control showed high per-base and per-sequence quality scores.
Illumina mRNA libraries were prepared from total RNA samples from unfertilized S. intermedius eggs. Raw 2 × 100 and 2 × 150 pair-end reads were generated using the Illumina NovaSeq 6000 platform, performed by Macrogen (Seoul, Republic of Korea) and Novogene (Beijing, China), respectively. The libraries were passed FastQC quality control showed high per-base and per-sequence quality scores. SRAs were submitted to GenBank (BioProject PRJNA686841). Otxα sequence was generated from transcript fragments found in the previously published egg transcriptome [21]. Sequence of the Otxβ-specific exon absent in eggs was obtained by alignment of the S. intermedius genomic reads (PRJNA391452) [22] to the S. purpuratus Otx gene using Minimap2 (Version 2.28) [23]. This program was also used for mapping of transcriptomic reads against the S. purpuratus genome. Transcriptomic reads were mapped to the Otx gene using Minimap2, BWA-MEM2 (Version 2.3), Bowtie2 (Version 2.5.4), and STAR (In Galaxy, this program is named RNA STAR. Version 2.7.11b) [23,24,25,26,27]. Mappings against the Otx transcripts were performed by Minimap2 and STAR. Then, reads were sorted by mapping status using BAMTools (Version 2.5.2) [28]. Mapping and sorting of reads were performed in the web-based Galaxy platform (https://usegalaxy.org) with default conditions [29]. Default conditions for each aligner are given in Supplementary Materials (Tables S1–S4). Alignments were visualized using IGV v.2.16.2 [30] and Unipro UGENE v.51.0 [31]. A generalized guide for using Galaxy web platform and visualization is provided in Supplementary Materials (File S1).
2.2. Animals and Sample Preparations
Adult sea urchins S. intermedius more than 4 cm in diameter were collected in different locations of the Peter the Great Bay (Sea of Japan) from 2–5 m depth throughout the year, kept in aquaria with aerated seawater at 15–17 °C, and fed with algae (Ulva fenestrata and Saccharina japonica) at least twice a week. To obtain gametes, we used naturally matured animals collected in April–May and August–September or maturation was induced by keeping sea urchins in aquaria for at least two months with unlimited food. Spawning was stimulated by injecting sea urchins with 0.5 M KCl. Eggs from two or three females were mixed, washed several times with filtered seawater and fertilized. Embryos were raised in climate chamber at 15 °C and collected at 6 hpf (32-cell stage) and 25 hpf (early gastrula). Embryos were frozen and stored at −80 °C. Dissected radial nerves of two–three animals and ovaries at mature stage (one animal) were washed with filtered seawater and Ca^2+^- and Mg^2+^-free salt solution (CMFSS, 12 mM HEPES, pH 7.6–7.8, 385 mM NaCl, 10 mM KCl, 21 mM Na_2_SO_4_, 17 mM glucose) and then frozen at −80 °C.
2.3. RNA Isolation
For NGS analysis, total RNA was extracted from S. intermedius eggs by using PureLink Mini kit (Thermo Fisher Scientific, Waltham, MA, USA). For RT-qPCR, RNA samples were isolated from frozen samples by using TRIzol Reagent (Thermo Fisher Scientific, Waltham, MA, USA) according to the manufacturer’s protocol with one exception. Some pigment content irreversibly bound to RNA in radial nerve samples after alcohol addition, which resulted in pink colored RNA. These pigments inhibited enzymatic reactions, most likely at cDNA synthesis stage. In order to prevent co-precipitation of undesirable pigment content, RNA from radial nerves was precipitated by addition of LiCl to a final concentration of 3 M and then washed with ethanol.
2.4. RT-qPCR
The first strand of cDNA was synthesized by RNAscribe RT (Biolabmix, Novosibirsk, Russia) according to the manufacturer’s protocol. Briefly, the 20 µL reaction contained 600 ng of total RNA and 1 µL of primer mix (mixture of random hexanucleotide and oligo(d)T_16_ primers) was incubated for 10 min at 25 °C and then for 30 at 55 °C. Reaction was stopped by incubation at 85 °C for 5 min and then cDNA was diluted three times to final volume of 60 μL. RT-qPCR was conducted on the CFX96 Touch Real-Time PCR Detection System (Bio-Rad, Hercules, CA, USA) using qPCRmix-HS SYBR master mix (Evrogen, Moscow, Russia). The 25 µL reaction mixture contained 2 μL of diluted template cDNA and 0.25 μM of each primer (Table 1) with the following temperature program: 94 °C for 30 s, 40 cycles of 94 °C for 15 s, 56 °C for 30 s, and 72 °C for 15 s. Each sample was analyzed in at least three technical replicates. The relative expression levels were examined by the ΔΔCt method using Ubb as a reference gene [21,32,33,34,35]. Plots were created using the ggplot2 package in R Statistical Software version 4.1.0.
3. Results
3.1. Application and Visualization of Single-Gene/Transcript Mapping
We used S. purpuratus raw reads available in GenBank from ovaries, cleavage, and early gastrula [19,20]. As Otx is expressed in the larval nervous system, we examined the radial nerve transcriptome of adult S. purpuratus. All transcriptomes were aligned to the S. purpuratus genome (GenBank, GCA_000002235.4) using Minimap2, which showed Otx expression in all cases (Figure 1b). Clear read coverage patterns allowed the recognition of expressed mRNA isoforms. The Otxβ isoform is expressed in the radial nerve. Also, two minor peaks were detectable in the Otxα-specific exon, although the exon coverage was partial, i.e., it had discontinuity. Based on these results, we concluded that Otxα is not expressed in the radial nerves. Otxα is expressed in the ovaries and at the cleavage stage. In the early gastrula, read coverage was detected for both Otxα- and Otxβ-specific exons, demonstrating expression of both isoforms. While Otxβ3 expression is absent in ovaries and at the cleavage stage, its expression in the radial nerve and the early gastrula stage remains undetermined. This uncertainty arises because the Otxβ3 transcript start site lies within the Otxβ-specific exon, which prevents isoform-specific mapping. Employment of a short reference sequence for mapping may lead to increased non-specific coverage depth. To test this statement, we mapped reads to the Otx gene sequence using Minimap2, BWA-MEM2, Bowtie2, and STAR (Figure 1c). Unlike whole-genome alignment, mapping to the Otx gene sequence alone demonstrated a reduced specificity. Many coverage profiles of the alignments to the single-gene reference contained one or two narrow nonspecific peaks within the introns. These peaks were generated in repetitive sequences with approximate lengths of 20 and 76 nucleotides (Figure 1c). In the radial nerve, Minimap2 produced only one non-specific coverage peak of the repetitive intronic sequence. Two non-specific peaks were observed in the ovaries after BWA-MEM2 mapping. Indeed, the exon regions contained mapped reads after Minimap2 and BWA-MEM2 mapping. Exon coverage by raw reads was invisible in the general view of the plots, but could be found in the detailed view of the exon regions (Figure S1). Evidently, specific coverage in these plots is invisible due to automatic scaling of the plots by visualizers based on high non-specific coverage in repetitive sequences. Other alignments contained both non-specific and exon-specific coverage, which results in increased accuracy of the alignment. Only Bowtie2 and STAR showed superior mapping without non-specific peaks at the cleavage and early gastrula stages (Figure 1c). We concluded that among the tested programs, STAR and Bowtie2 showed the best mapping specificity, whereas other mappers revealed less accurate alignments (Table 2).
Single transcript mapping was performed for each Otx mRNA isoform sequence (GenBank Gene ID 373400). We tested Minimap2 and STAR as mapping programs that showed less and more accuracy in alignment to the Otx gene sequence, respectively. Both mappers generated similar coverage plots and were discussed together (Figure 2). Since Otx isoforms differ in their first exons but share identical downstream sequences, we determined expression of the isoforms by coverage of the first exon sequences (Figure 2). According to the mapping data, Otxα is expressed in the ovaries and at the cleavage and early gastrula stages. The first exon of Otxα showed no 5’-end coverage, with aligned reads beginning at the same downstream position across the ovaries, cleavage, and gastrula stages. This indicates that the transcription start site (TSS) for Otxα is located downstream of its position, as given in the Otx gene model. The downstream location of the TSS is supported by the experimental determination of the 5’UTR sequence [7]. Furthermore, an ortholog of Otxα, HpOtxE, and closely related species H. pulcherrimus has a similar position of TSS [6]. The 5’UTR sequence of assembled de novo Otxα of S. intermedius also confirmed the downstream TSS location. Therefore, the S. purpuratus Otx gene model should be revised accordingly. Otxβ is expressed at the early gastrula stage and in the radial nerve. In the latter case, we observed two coverage zones within the Otxα-specific exon, similar to whole-genome alignment. This fragmented coverage provides only limited evidence for Otxα expression. In early gastrula, both Otxα and Otxβ were detected by both single-gene and transcript mapping (Figure 1b,c and Figure 2). The sharp increase in Otxα coverage at the junction between its first specific exon and the common Otx sequence suggests differential expression levels between the isoforms. Potential Otxβ3 expression could be masked by the Otxβ coverage profile in both single-gene and whole-genome alignment approaches.
The implemented mapping pipeline for alignment of raw reads to single-gene/transcript sequences is given in Figure 3. This includes all used mapping transcriptomic reads, the read filtration step, and visualization. Read filtration separates mapped from unmapped reads. While this step may seem, the resulting files containing only mapped reads are smaller in size, facilitating more efficient subsequent analysis and visualization on desktops and laptops.
3.2. RT-qPCR Analysis of Otx Isoforms Expression in S. intermedius Samples
To confirm and extend the Otx isoform expression results based on read mapping, we performed RT-qPCR analysis in S. intermedius, which inhabits the coastal seawater of the Sea of Japan. Due to the restricted distribution of most sea urchin species, we chose S. intermedius as the closest related species to S. purpuratus among sea urchins available to us. Both species are phylogenetically close, should have the same Otx gene structure, and very similar development and anatomy. Based on these facts, we suspect that the expression pattern of the Otx gene in these species would be similar. We examined expression in the same developmental stages and adult tissues analyzed by single-gene/transcript mapping in S. purpuratus. First, we analyzed total Otx expression using oligos annealing to the common sequence (Figure 4a). Otx expression was detected in all samples with the lowest levels in the radial nerve (1) and the highest in the early gastrula (100-fold increase). Next, we used oligos annealing to the sequences of the first isoform-specific exons. Otxα is expressed in the ovaries, at the 32-cell stage, and in the early gastrula. The lowest level was detected for ovaries (1.2) in comparison with 32-cell (3.3) and early gastrula (2.95) stages (Figure 4b). Otxβ is expressed in the radial nerve and early gastrula. In the early gastrula, Otxβ expression level was significantly higher (100-fold increase) than in the radial nerve (Figure 4c). Otxβ3 expression could not be estimated because the sequence of the Otxβ3 first exon is a part of the longer Otxβ-specific exon. Therefore, RT-qPCR allows us to analyze the total expression of both isoforms (Figure 4d). As illustrated in Figure 4b–d, the expression levels of Otxα in radial nerve and Otxβ in ovaries and 32-cell embryos were very low, which we considered as background levels. These faint signals might be a result of little DNA contamination or basal isoform expression. The highest value among faint signals was for Otxβ/Otxβ3 in the ovaries, which was 5% of the expression level in the radial nerve (Figure 4d). In conclusion, RT-qPCR analysis confirms the results of Otx expression on mRNA isoform level obtained by single-gene/transcript mapping.
4. Discussion
Single-gene/transcript mapping requires basic NGS analysis skills, such as basic processing of the NGS read libraries, mapping, and visualization of mappings. This approach can be used to quickly obtain qualitative expression results for RNA isoforms, provided transcriptome raw reads are available. Although mapping to a single gene may be less specific than whole-genome mapping, additional mapping to transcript sequences enables accurate determination of expressed isoforms. Non-specific signals in the coverage profile from single-gene mapping can be disregarded because transcribed exons are visible, allowing for the definition of expressed RNA isoforms. While the runtimes for whole-genome and single-gene mappings are comparable, the results files from mapping to a single gene are smaller. This reduced file size is far more convenient for analysis on desktops and laptops.
Several RT-qPCR variations are often used to determine mRNA isoform expression. In these cases, expression of particular isoforms is estimated by measuring isoform-specific exons or detecting exon–exon junctions [36,37,38]. RT-qPCR allowed us to confirm expression of the Otx isoforms identified by single-gene/transcript mapping in different S. intermedius samples. However, RT-qPCR did not allow the verification of transcription start and end sites. Single-gene/transcript mapping revealed that Otxα possesses TSS downstream of the predicted location in the Otx gene model, which matches the TSS experimentally determined earlier [6,7]. We consider that single-gene/transcript mapping is appropriate for qualitative isoform expression analysis and predicted sequence verification. At the same time, the single-gene mapping method is not suitable for estimating gene expression levels for several reasons: it does not account for background expression levels (most expression quantification methods count all reads and normalize for library size), and some reads may map to multiple transcripts, leading to inflated expression estimates (this issue is often addressed using Expectation–Maximization algorithms).
Time required for the analysis by single-gene/transcript mapping was less than we spent on RT-qPCR. The mapping against the Otx gene and its transcripts using the established scheme took approximately a week. This included downloading available read libraries, checking read quality, mapping using multiple mappers, and visualizing the resulting data. RT-qPCR took us approximately two months. This included obtaining biological material and RNA isolation, primer design and validation, cDNA synthesis, expression analysis in multiple biological replicates, and calculating expression levels and plotting generation. This suggests that the mapping is a faster way to identify expressed isoforms compared to RT-qPCR. However, if quantitative expression results are required, RT-qPCR or differential transcriptome expression analysis at the isoform level should be done.
Single-gene/transcript mapping has some limitations. First, this approach can be employed in cases where an annotated genome is available. Transcriptome data without a known exon-intron structure of the gene do not allow mapping and examining coverage of exon sequences by raw reads. The exon-intron structure of the gene and the expression of different mRNA isoforms can be indirectly confirmed using the same approach we used. We first mapped reads to the Otx sequence of S. purpuratus, a species with an annotated genome, and confirmed the presence of two isoforms in the closely related species S. intermedius, which lacks an annotated genome. However, this approach may not be successful for other genes in other animals.
Next, not all mapping programs are convenient for single-gene mapping. In our analysis, STAR and Bowtie2 were appropriate for gene mapping, whereas BWA-MEM2 and Minimap2 showed significant non-specific coverage of repetitive sequences by reads in introns. This may complicate analysis of the Otx mRNA isoform expression, as non-specific coverage is significantly higher than coverage of exons, which may be invisible in the general view of coverage plots. In these cases, the coverage of exons can be estimated by viewing the exon regions. However, the best option would be the use of mapping programs that provide more accurate coverage depth. As we showed, mapping non-specificity is more pronounced at low Otx expression. According to our results, high non-specific coverage peaks appeared in the radial nerve and ovaries. In these tissues, the highest non-specificity correlates with the lowest Otx expression estimated by RT-qPCR. In the early gastrula, RT-qPCR analysis showed the highest Otx expression, and nonspecific signals were low compared to other samples or invisible, depending on the chosen mapping program. In contrast, Minimap2 showed successful alignment of reads against a single transcript sequence, similar to STAR. However, this fact does not exclude the emergence of non-specific alignment when Minimap2 is used for mapping reads to other genes. Thus, our results show that the appearance and level of non-specific alignments in repetitive sequences depend on the chosen mapping program. Also, non-specific alignment is more pronounced at the lower Otx expression levels, while at the high Otx expression levels, non-specificity is reduced or invisible. Non-specific mapping, particularly on repetitive sequences, may be defined by visually examining the sequences. If a strong signal appears in intronic regions, it is necessary to examine the sequence itself. If it consists of short repeats, the mapping in this region is most likely non-specific. Then, we suggest performing mapping using several programs to compare the results and select mapping coverage plots without or with minimal non-specificity.
Single-gene/transcript mapping against the Otx gene and its transcripts revealed the potential masking of short UTRs by longer ones. In this case, the mapping did not allow differentiation of the presence of the Otxβ3 isoform in the radial nerve and early gastrula. Expression of the Otxβ isoform with the longer 5’UTR leads to the generation of the coverage profiles, which overlay the start of the 5’UTR of Otxβ3. Therefore, single-gene/transcript mapping can detect the longest UTR among isoforms that differ by their UTR lengths. Using methods reliable to estimate the UTR length of each isoform, such as RACE or long-read sequencing, can solve this problem.
Single-gene/transcript mapping is most easily applied to genes with a simple structure lacking overlapping exons and introns, such as Otx genes in sea urchins. The complex structure of genes containing numerous exons and encoding multiple mRNA isoforms generated by alternative splicing can significantly complicate analysis. The kinesin light chain gene of S. purpuratus serves as an illustrative example (Figure S2, Table S5). In this case, it is informative to perform mapping against individual transcript sequences. The resulting alignments should be carefully examined for reads spanning exon–exon junctions. If a specific junction is covered by reads, the analyzed transcript is likely to be expressed (Figures S3–S5). Contrariwise, if the junction is not covered by any reads or if the coverage is low, this may indicate the absence of the corresponding transcript isoform. Furthermore, gaps in the coverage profile, which indicate the lack of expression for part or an entire exon, should be taken into account (Figures S6–S8). Based on this analysis, expressed isoforms of kinesin light chain can be determined. However, additional verification should be made, for example, by RT-PCR or RT-qPCR. However, this analysis will also be a challenging task due to the expression of several isoforms and overlapping exons. Alternatively, long-read sequencing may be used to detect mRNA isoforms [39]. However, the cost of long-read sequencing is too high for analyzing the expression of only one or a few genes.
5. Conclusions
In summary, we showed that the expression of sea urchin Otx mRNA isoforms can be detected by single-gene/transcript mapping. According to our results, single-gene/transcript mapping is a rapid process that can be employed instead of RT-PCR in cases of available annotated genomes and transcriptomic libraries. The mapping results can be confirmed and extended by quantitative analysis, such as RT-qPCR. The sea urchin Otx gene has a simple gene structure consisting of four non-overlapping exons, which allows for easy recognition of exon-specific expression. However, single-gene/transcript mapping did not allow us to differentiate the Otx isoforms that differ by their 5’UTRs. In this case, this approach could only detect the longest 5’UTR. We hypothesize that single-gene/transcript mapping can also be employed for other genes with simple gene structures in any eukaryotic organism with known genome and sequenced transcriptomes. More complex genes with numerous and overlapping exons can complicate the interpretation of mapping results. Therefore, we do not recommend using this approach alone without confirmation by other methods, such as RT-qPCR or long-read sequencing. Despite potential drawbacks, such as non-specific mapping to a single gene and limited software compatibility, the combined use of single-gene and transcript mapping in conjunction with testing different aligners yields relevant and highly informative results that identify the expressed mRNA isoforms.
The reference list from the paper itself. Each links out to its DOI / PubMed record.
- 1Liu Q. Fang L. Wu C. Alternative splicing and isoforms: From mechanisms to diseases Genes 20221340110.3390/genes 1303040135327956 PMC 8951537 · doi ↗ · pubmed ↗
- 2Alfonso-Gonzalez C. Legnini I. Holec S. Arrigoni L. Ozbulut H.C. Mateos F. Koppstein D. Rybak-Wolf A. Bönisch U. Rajewsky N. Sites of transcription initiation drive m RNA isoform selection Cell 202318624382455.e 2210.1016/j.cell.2023.04.01237178687 PMC 10228280 · doi ↗ · pubmed ↗
- 3Tellier M. Maudlin I. Murphy S. Transcription and splicing: A two-way street Wiley Interdiscip. Rev. RNA 202011 e 159310.1002/wrna.159332128990 · doi ↗ · pubmed ↗
- 4Lander E.S. Linton L.M. Birren B. Nusbaum C. Zody M.C. Baldwin J. Devon K. Dewar K. Doyle M. Fitz Hugh W. Initial sequencing and analysis of the human genome Nature 200140986092110.1038/3505706211237011 · doi ↗ · pubmed ↗
- 5Sodergren E. Weinstock G.M. Davidson E.H. Cameron R.A. Gibbs R.A. Angerer R.C. Angerer L.M. Arnone M.I. Burgess D.R. Burke R.D. The genome of the sea urchin Strongylocentrotus purpuratus Science 200631494195210.1126/science.113360917095691 PMC 3159423 · doi ↗ · pubmed ↗
- 6Kiyama T. Akasaka K. Takata K. Mitsunaga-Nakatsubo K. Sakamoto N. Shimada H. Structure and function of a sea urchin orthodenticle-related gene (Hp Otx)Dev. Biol.199819313914510.1006/dbio.1997.88029473319 · doi ↗ · pubmed ↗
- 7Li X. Chuang C.-K. Mao C.-A. Angerer L.M. Klein W.H. Two Otx proteins generated from multiple transcripts of a single gene in Strongylocentrotus purpuratus Dev. Biol.199718725326610.1006/dbio.1997.86109242422 · doi ↗ · pubmed ↗
- 8Angerer L.M. Oleksyn D.W. Levine A.M. Li X. Klein W.H. Angerer R.C. Sea urchin goosecoid function links fate specification along the animal-vegetal and oral-aboral embryonic axes Development 20011284393440410.1242/dev.128.22.439311714666 · doi ↗ · pubmed ↗