Systematic Review and Meta-Analysis of Quality Claims Associated with Fresh Pet Food: Evaluating Scientific Evidence for Additives, Ingredient Quality, and Effects of Processing in Pet Nutrition
Matthew T. Jobe, Kevin M. Downs

TL;DR
This study reviews scientific evidence behind claims made by fresh pet food companies about additives, ingredient quality, and processing effects on pet health.
Contribution
The paper provides a systematic review and meta-analysis of three key quality claims in the fresh pet food market, offering evidence-based insights for consumers and professionals.
Findings
Approved additives and preservatives within regulatory limits do not appear to harm pets.
Processing effects on digestibility and nutrient content depend on ingredient type and method, not just intensity.
Evidence for human-grade ingredients being superior is limited due to methodological issues in studies.
Abstract
Pet owners today face an overwhelming array of dietary options for their companions, from grain-free kibble to fresh-frozen meals and boutique brands, each marketed with claims of superior nutrition and improved health outcomes. Understanding these options and their consequences on pet health is essential for both consumers making purchasing decisions and veterinary professionals recommending dietary formats. Beyond basic nutritional adequacy, consumers must evaluate product-related factors including the presence of additives, preservatives, and fillers; the use of human-grade ingredients; processing temperatures and methods; whole versus processed ingredients; and overall nutrient integrity. This systematic review examined three prevalent quality claims made by leading fresh pet food companies: that additives and preservatives are harmful, that human-grade ingredients offer superior…
Genes, proteins, chemicals, diseases, species, mutations and cell lines named across the full text — each resolved to its canonical identifier and authoritative record.
Click any figure to enlarge with its caption.
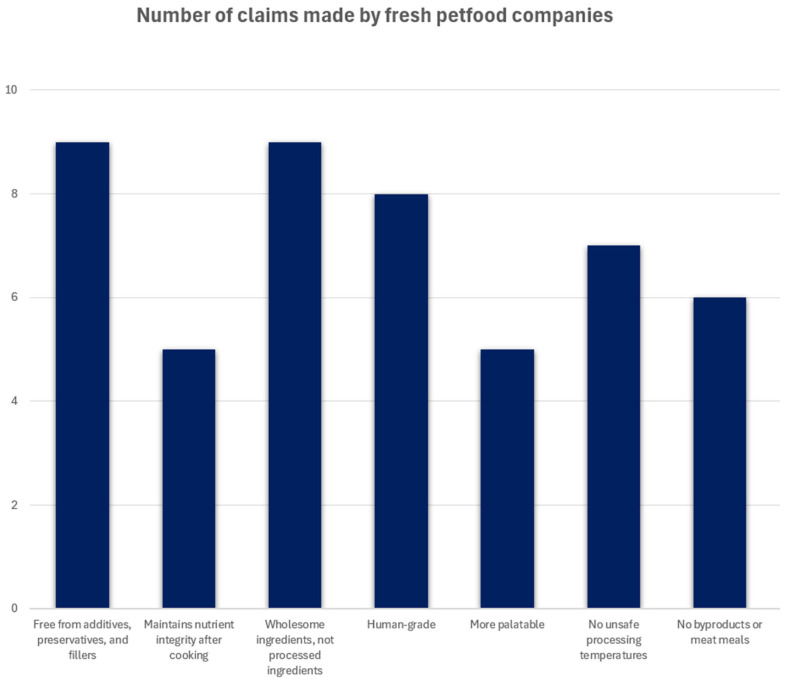 Figure 1
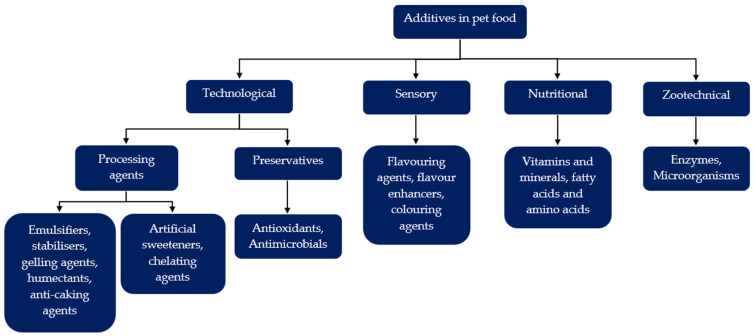 Figure 2
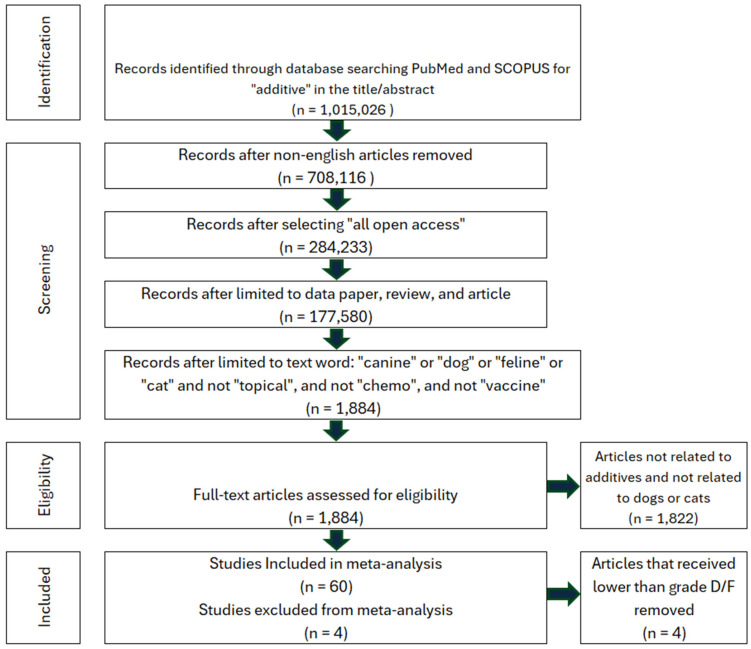 Figure 3
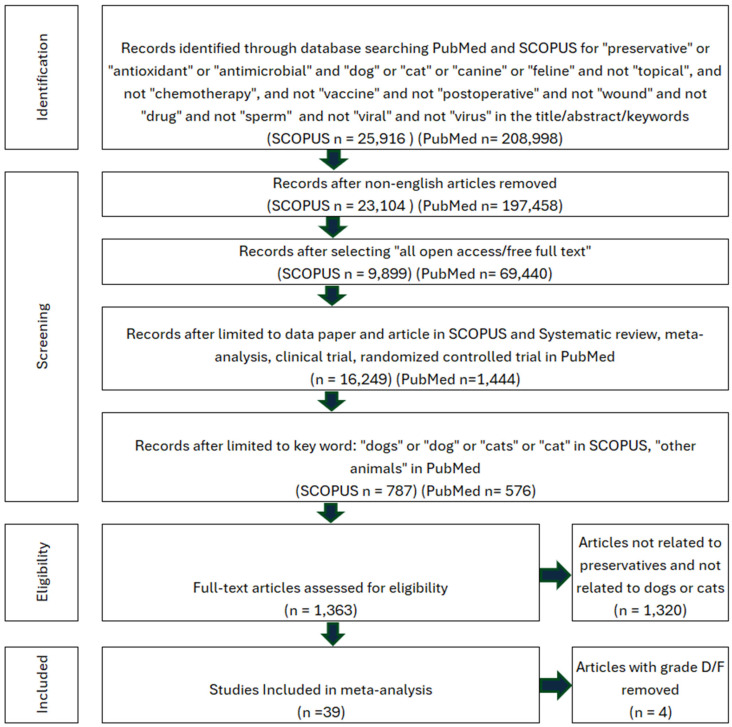 Figure 4
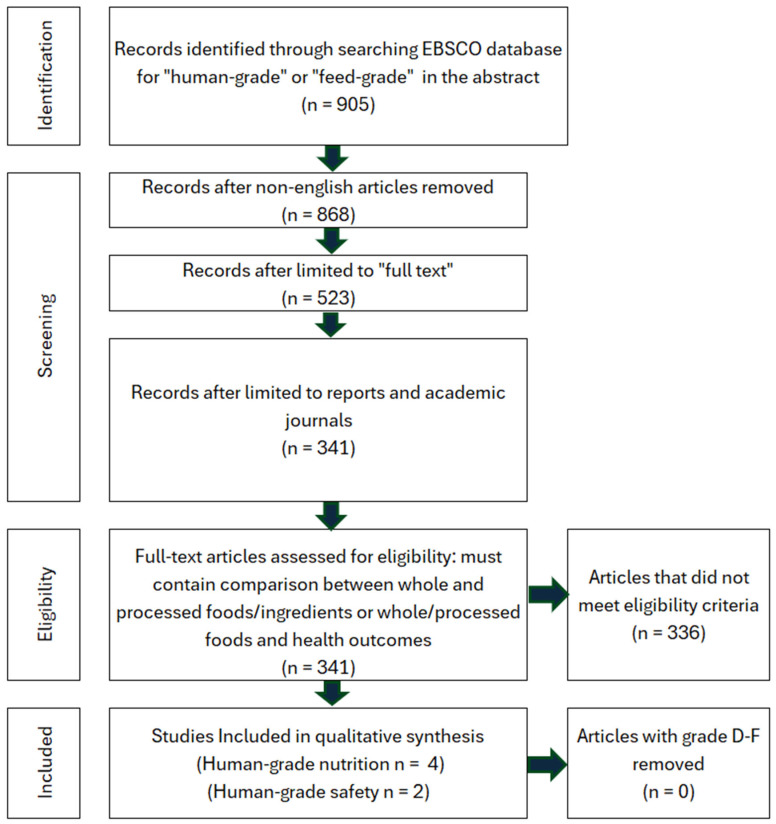 Figure 5
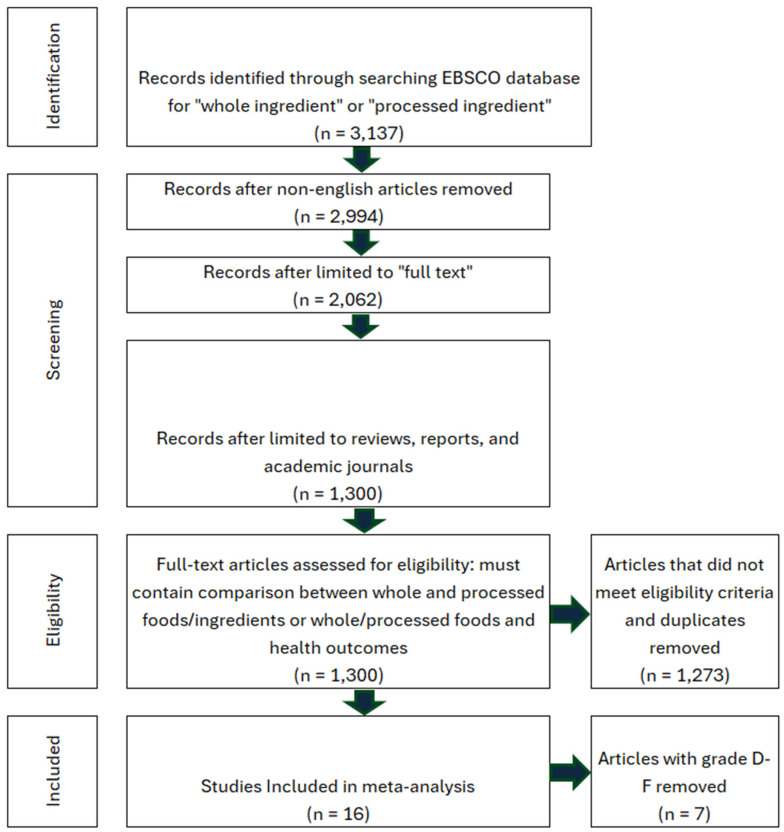 Figure 6
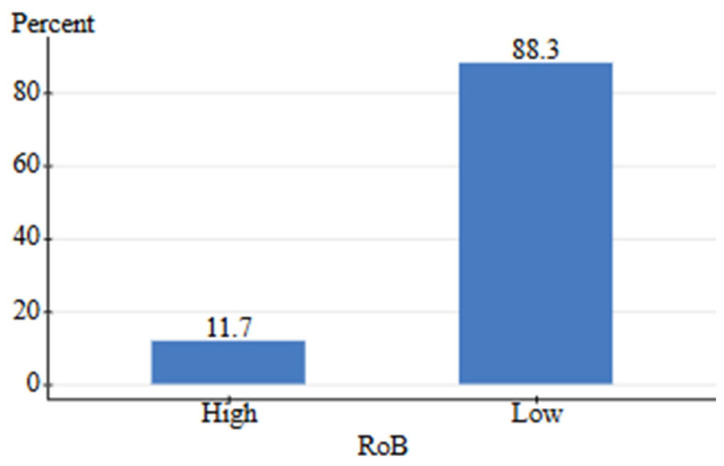 Figure 7
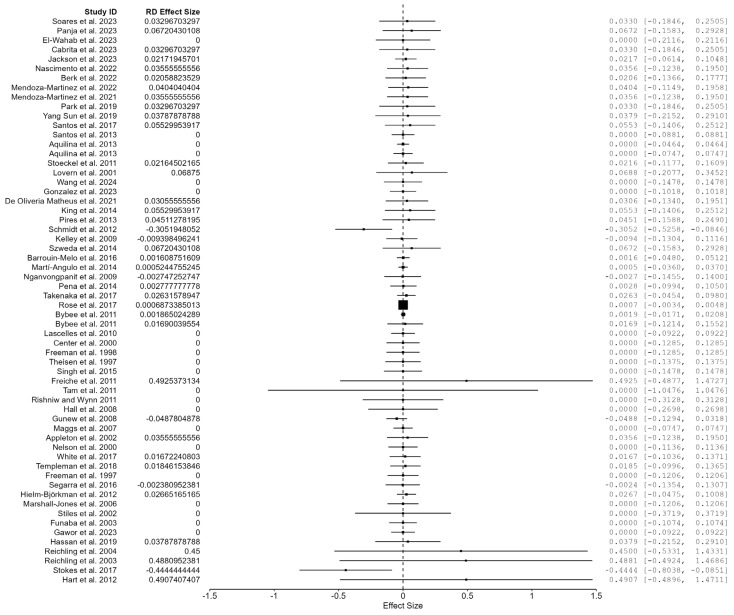 Figure 8
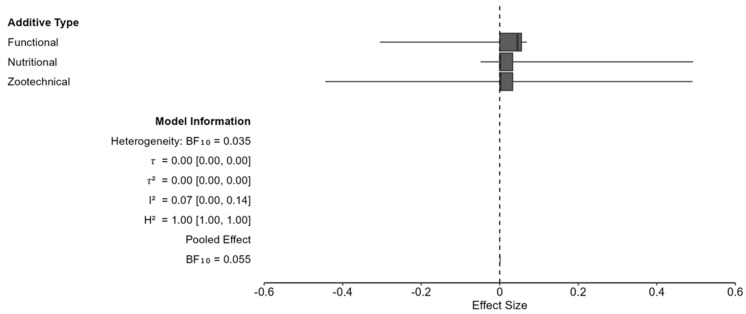 Figure 9
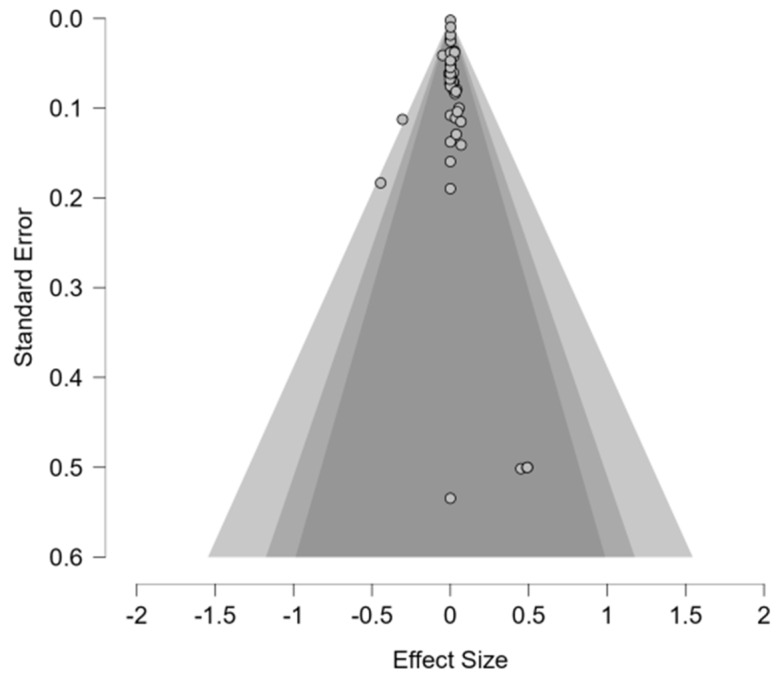 Figure 10
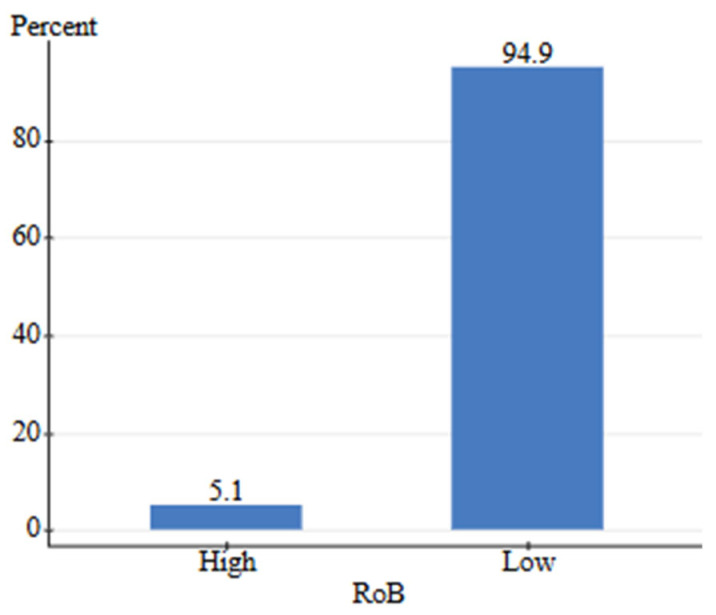 Figure 11
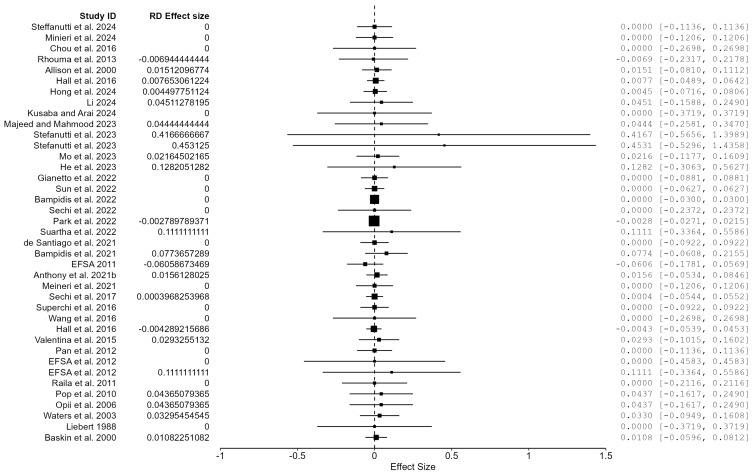 Figure 12
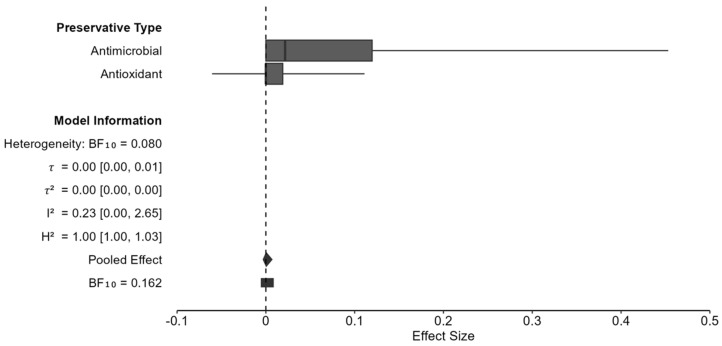 Figure 13
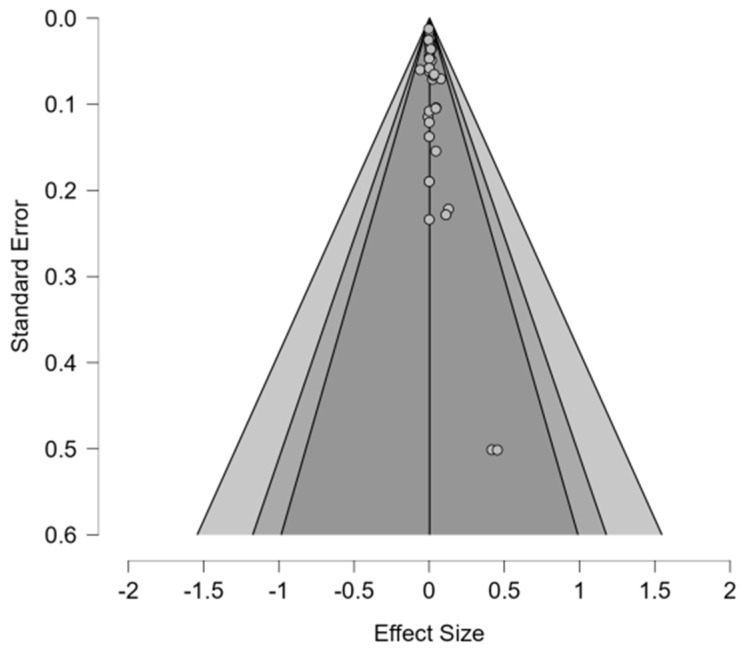 Figure 14
 Figure 15
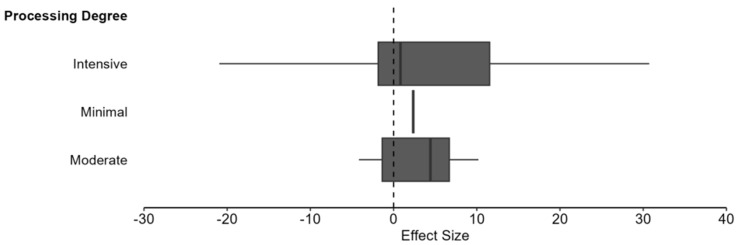 Figure 16
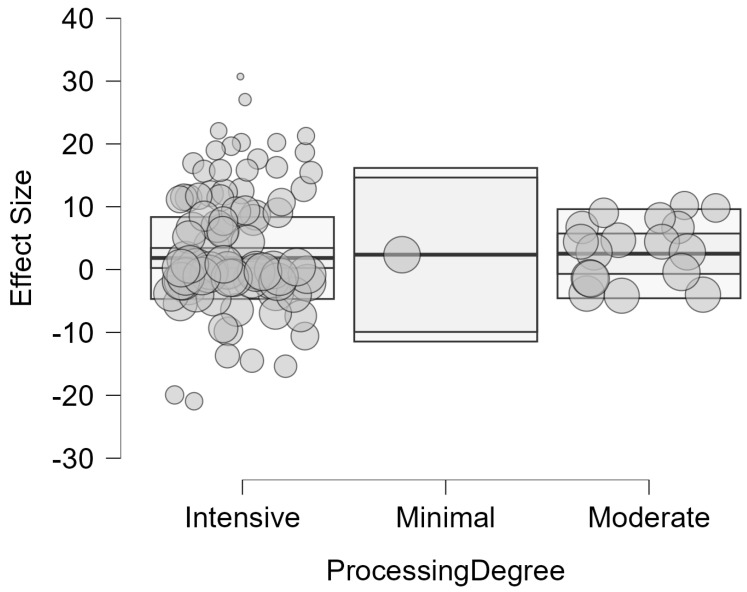 Figure 17
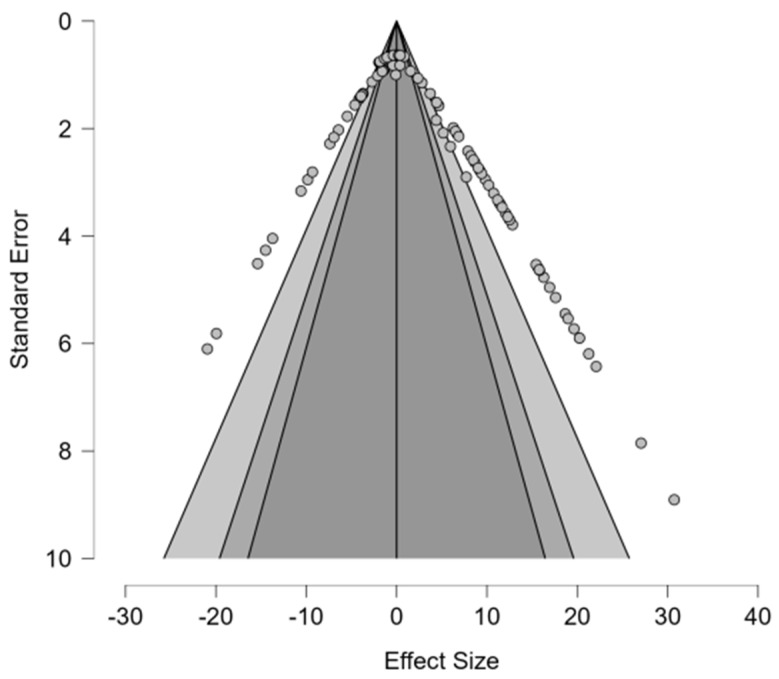 Figure 18
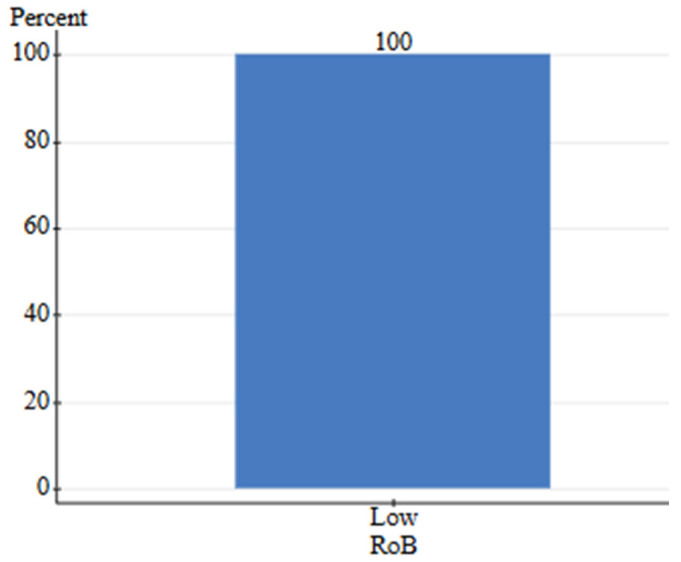 Figure 19
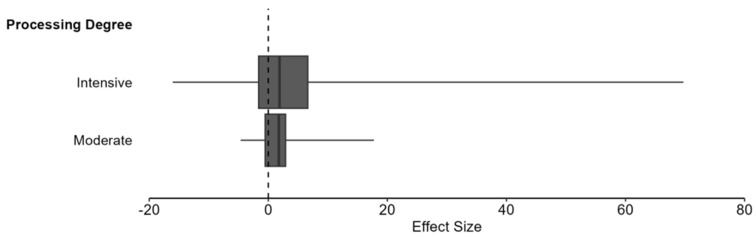 Figure 20
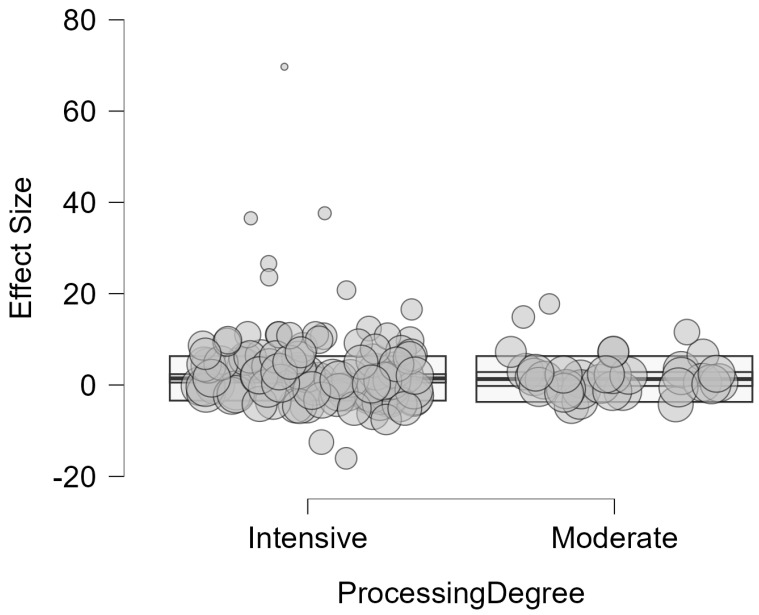 Figure 21
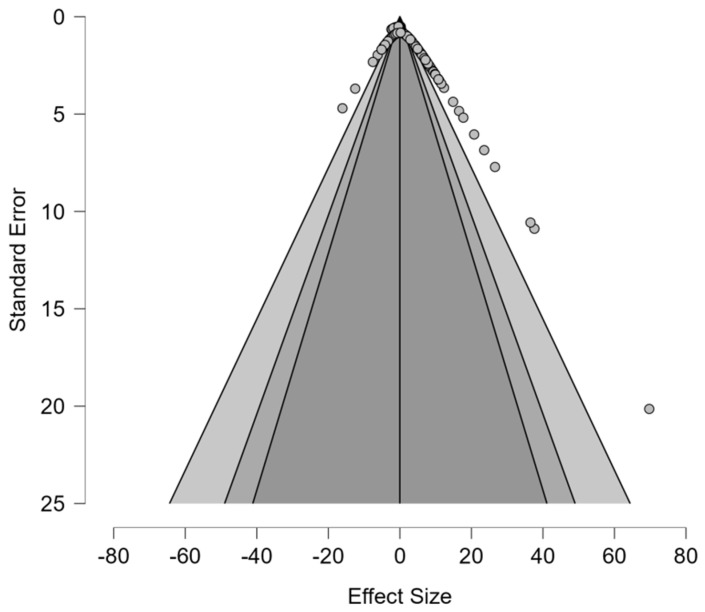 Figure 22
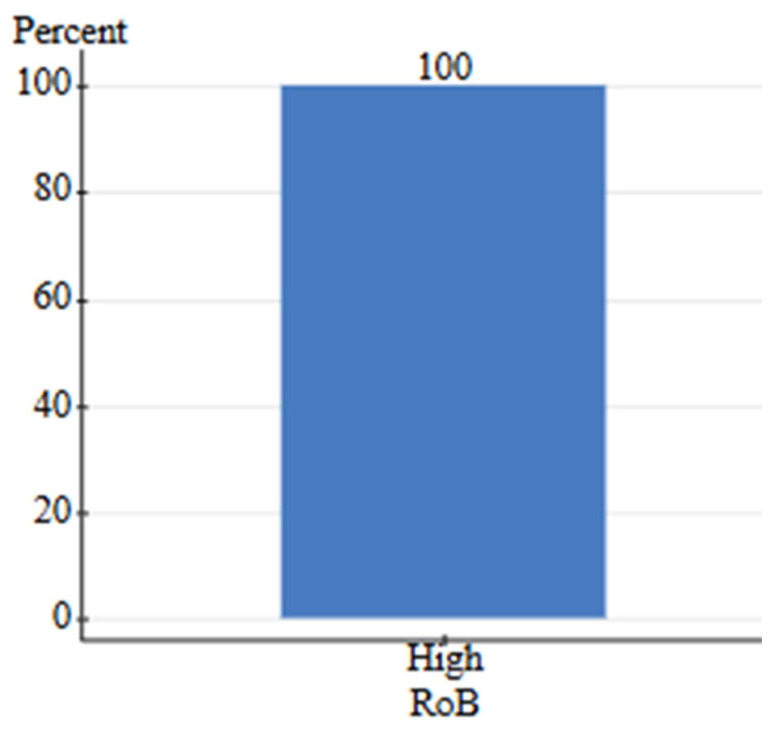 Figure 23
 Figure 24
Peer Reviews
No public reviews on file for this paper yet. If you reviewed it on a platform where reviews are public (OpenReview, ICLR, NeurIPS, ICML), you can paste yours below so the community can read it here.
Videos
No videos yet. Explain this paper in a talk, walkthrough, or lecture? Add one.
Taxonomy
TopicsMeat and Animal Product Quality · Veterinary Medicine and Surgery · Halal products and consumer behavior
1. Introduction
According to an industry analysis, the global pet food market achieved a value of 1.51 billion of this total market share [1,2]. This emergence into the market is not coincidental and portrays the consumer demand for their pets to consume more recognizable food that resembles a human diet. It is apparent that modern pet owners have a higher standard for pet food quality and aim to hold the industry to a higher standard [3]. Previously, pet owners considered home-cooked and human-grade pet foods to be luxury items because of their high cost and complicated manufacturing process. However, improved production efficiency and the rise of direct-to-consumer sales have fundamentally changed this perception. Therefore, there is an increasing demand for fresh pet food. With studies showing the associations between processed food intake and negative health outcomes, consumers are likely deterred from unrecognizable options, such as kibble or canned pet foods [4,5,6]. The quantity of pet food brands, formats, and claims has created difficulties, with 25% of owners feeling overwhelmed and 50% reporting that selecting the right pet food is the hardest part of pet ownership [7].
Before exploring the impact of fresh pet food (FP) on pet health, it was necessary to define the term ‘fresh’ in the context of pet food. With visible chunks of identifiable ingredients and familiar aromas, FP generally resembles human-grade food in preparation and quality. Fresh pet food is typically prepared using minimal processing techniques such as steaming, roasting, and air-drying to preserve nutrients [8,9,10,11,12,13,14,15,16,17,18]. These methods contrast with commercial methods such as sterilization via retort or thermal processing via extrusion and high-temperature drying. These pet foods are commonly stored in refrigerated or frozen conditions due to a lack of additives or preservatives which are known to provide shelf stability at ambient temperatures. The Centers for Disease Control and Prevention (CDC) describe FP as “refrigerated, cooked with fewer or no preservatives, and shorter shelf life” than kibble or canned pet foods [19]. Fresh pet food has no definition from the Association of American Feed Control Officials (AAFCO), requiring a market search to better understand its differentiating qualities from common processed pet food formats such as kibble, loaf, pâté, and chunks in gravy (Section 2.1).
Multiple steps are required to transform pet food ingredients into safe, complete-and-balanced, and palatable final products. Commercial pet food is manufactured using distinct processing pathways which are optimized for the given format. Dry kibble production begins with grinding and sieving, followed by precision mixing, preconditioning, and a thermomechanical extrusion process [20]. The extrusion process typically operates at 140–180 °C with high pressures which force extrudate through a die plate with rotary cutting [20]. The drying process controls moisture to <10% while post-extrusion coating supplies fats and palatants [20]. Wet pet food production utilizes a canning process similar to human food which consists of ingredient preparation, grinding, emulsification, mixing, and filling 14). This product is sealed and placed into a retort at setpoints typically around 116–129 °C for 20–100 min [21]. These production processes allow manufacturers to inhibit microbial growth, mitigate pathogen risks, and ensure food safety parameters throughout production [22]. From an operational standpoint, this reduces food waste, protects businesses from intentional adulteration, and improves financial performance [23]. Many ingredients in typical pet foods are processed to provide a consistent and safe product before arriving at pet food production sites. This could be in the form of grinding to reach the desired particle size, mixing to achieve homogeneity of nutrients, filtering to remove foreign material, dehydration to control water activity, or washing to remove contaminants. To ensure ingredient safety and quality, pet food companies typically require suppliers to meet specific criteria for parameters including proximate analyses (protein, fat, moisture, and ash), pathogens, mycotoxins, heavy metals, foreign material, and vitamin/mineral concentrations. These parameters are commonly verified through additional testing at production facilities to confirm supplier results and ensure compliance with food safety standards throughout transportation and handling. Different pet food categories employ varying degrees of processing to achieve food safety objectives from extensive thermal processing in shelf-stable products to minimal processing approaches in fresh and frozen formats, each with distinct advantages for pathogen control, shelf stability, and nutrient preservation. The processing approach selected influences product characteristics such as shelf life, distribution requirements, storage conditions, and nutritional profile consistency. Ingredient parameter consistency remains important across all product categories to ensure predictable finished product quality and minimize production variability.
The negative connotation surrounding the processing of ingredients likely results from the impact on human health in recent decades. Lane et al. (2024) performed 45 pooled analyses and found that a greater exposure to ultra-processed foods was associated with a higher risk of negative health outcomes such as type 2 diabetes, cancer, cardiovascular disease, and obesity [4]. While most of this is linked to low-nutrient-density, high-fat, and sugary foods, this has likely deterred consumers from processed pet food (PP) to protect their pets, and thus the demand for less processed formats such as FP has increased. There are some elements to processed pet food that consumers may be unaware of, such as dispersion of essential nutrients, increased bioavailability of fibers, and improved digestibility of certain protein sources due to thermal and mechanical energy [24,25,26]. These elements contribute to the “healthiness” of pet food and thus directly affect the pet’s susceptibility to chronic diseases [27,28,29]. The humanization of pets in recent years has also impacted consumers’ choices to feed their pets more human-grade foods, which may present some risks. Firstly, dogs age approximately six to seven times faster than humans, meaning that nutrition-related health effects and disease development occur on a compressed timeline relative to their lifespan [30]. This accelerated timeline means that nutritional deficiencies or imbalances manifest more rapidly in companion animals, emphasizing the importance of complete and balanced formulations at each life stage [31]. Secondly, human diets are reflective of stomach pH, length of the GI tract, and enzyme compositions, which dictate what can be utilized as a substrate for energy or biochemical processes within the body. Canines and felines contain a more variable gastric pH for bone breakdown and a shorter GI tract than humans [32,33]. Enzymatic profiles also differ between species, with dogs and cats lacking active salivary amylase for oral carbohydrate initiation, though dogs possess pancreatic amylase that enables dietary starch utilization [34]. Cats, as obligatory carnivores, have limited pancreatic amylase activity and reduced hepatic glucokinase expression, resulting in lower tolerance for high-carbohydrate diets compared to facultative-omnivores such as the domesticated dog (Canis familiaris) [35]. Dietary decisions for companion animals should prioritize species-appropriate nutrient profiles and bioavailability rather than anthropomorphic preferences based on ingredient format, processing methods, or visual appeal. Humanization of a pet’s diet should be performed in consultation with veterinary professionals to ensure that a pet’s physiological needs are met. However, this should not diminish the expectation that pet food manufacturers will provide fresh, nutritionally sound products. The purpose of this study was to evaluate the most prevalent claims surrounding fresh pet food and to understand their impact on dog and cat health. This was achieved by performing a systematic review of the top three claims to assess whether current scientific evidence provides enough justification to substantiate these claims. Finally, recommendations will be provided to companies and industry professionals that will pinpoint areas for further investigation. This study evaluated whether the current scientific evidence substantiates claims made by fresh pet food manufacturers.
2. Materials and Methods
2.1. Market Search: Most Prevalent Fresh Pet Food Claims
Brands with the highest market share and most reviews were included [36,37,38]. Each brand’s website was searched for claims, which were compiled into a visual representation (see Figure 1). The most prominent claims include the following: “Free from additives, preservatives, and fillers,” “Maintains nutrient integrity after cooking,” “Wholesome ingredients, not processed ingredients,” “Human-grade,” “More palatable,” “No unsafe processing temperatures,” and “No byproducts or meat meals” [8,9,10,11,12,13,14,15,16,17,18]. Amongst those claims, the defining characteristics of FP were the lack of additives, preservatives, fillers; maintaining nutrient integrity after cooking; and the utilization of whole or natural ingredients (see Figure 1). These claims align with pet owners’ desire to provide high-quality and humanized diets for their pets [8,9,10,11,12,13,14,15,16,17,18].
2.2. Population, Intervention, Comparison, and Outcome (PICO)
The PICO approach is used in Cochrane reviews to define the scope of a review question through a detailed and consistent strategy [39]. Below are the PICO statements for each of the performed systematic reviews.
2.2.1. Systematic Review of Additives and Preservatives in Pet Food
Population (P): Dogs and cats of all ages, not limited by health status or geographic location.Intervention (I): Exposure to various additives and preservatives in pet food, including the following:
- Feed additives (e.g., microalgae species, probiotics, herbal compounds, and medium chain triglycerides);
- Preservatives (e.g., antioxidants, antimicrobials, and natural and synthetic preservatives). Comparison (C): Control groups receiving diets without the specific additive or preservative, or baseline measurements before intervention.Outcome (O): Safety outcomes including adverse reactions, symptoms of toxicity, negative phenotypes, acute toxicity, chronic toxicity, gastrointestinal effects (diarrhea, vomiting), aggression, lethargy, weakness, and death.
2.2.2. Systematic Review of Human-Grade vs. Feed-Grade Ingredients in Pet Food
Population (P): Dogs and cats of all ages, not limited by health status or geographic location.Intervention (I): Complete diets formulated entirely or partially with human-grade ingredients that meet FDA and USDA standards for human consumption, including ingredients approved for human food chain, processed in human food facilities.Comparison (C): Complete diets formulated with feed-grade ingredients regulated by the AAFCO and FDA for animal consumption, characterized by different standards for contaminant limits.Outcome (O):
- Primary: Nutrient levels, contaminant levels (mycotoxins, heavy metals, and pathogens), growth, and metabolic parameters.
- Secondary: Digestibility/bioavailability.
- Tertiary: Adverse reactions and performance.
2.2.3. Systematic Review of Whole vs. Processed Ingredients in Pet Food
Population (P): Grains, meat, vegetables, oils/fats, etc.Intervention (I): Diets containing whole or minimally processed ingredients in their natural form.Comparison (C): Diets or ingredients that have undergone various processing methods including the following:
-
Thermal processing (extrusion, cooking, roasting, and steaming);
-
Mechanical processing (milling, grinding, washing, and soaking);
-
Chemical processing (pH adjustments and preservation methods). Outcome (O):
-
Primary: Nutrient levels, contaminant levels (mycotoxins, heavy metals, and pathogens), growth, and metabolic parameters.
-
Secondary: Digestibility/bioavailability.
-
Tertiary: Adverse reactions, performance, antinutrients, bioactive compounds, etc.
2.3. Search Strategy
To properly assess the field of research surrounding each claim, a literature search was conducted on research up to February 2025 across three databases: SCOPUS, PubMed, and EBSCO (MEDLINE/Academic Search ultimate). These databases provide extensive coverage of peer-reviewed studies covering a wide array of fields, including veterinary science, animal health, science, and nutrition. No date restrictions were applied to the search so that both early and recent developments in pet food formulations and pet health could be captured, allowing for a comprehensive understanding of the field. To obtain the most applicable studies, the term related to the claim was searched and the following criteria were applied to the search: all open access articles/full-text, English language only, keywords “canine, feline, dog, cat,” article types limited to “data paper, review, and article.” The following criteria from the Cochrane Handbook for Systematic Reviews of Interventions were utilized to conduct this study: PICO domains, predefined and unambiguous eligibility criteria, justifying choice of study design, inclusion of randomized studies, tabulation of extracted data, synthesis of studies, and unbiased reporting [39].
2.4. Selection of Studies
The title of the study was analyzed for mentions of key terms related to the claims such as “Additive,” “Preservative,” “Filler,” “Whole Ingredient,” “Processed Ingredient,” “Human-grade,” “Feed-grade,” or any mention of a compound and the effect on a food safety outcome (e.g., microalgal species in fecal metabolites). The utilization of truncation enabled each search query to include variations of a given word. Each systematic review was limited to sources that contained an available full text. The source type was also limited to academic journals, reviews, and reports to retrieve the most applicable information regarding each topic.
2.5. Data Extraction
The selected studies were analyzed for relevant information to each PICO statement (Section 2.1). This information was recorded in an excel spreadsheet using the following columns:
- Additives/Preservatives: Study ID, preservative type, exposure level, outcomes, effect direction, key findings, limitations, risk of bias, and quality grade.
- Whole/processed Ingredients: Reference, ingredient, processing step, degree of processing, nutritional effects, digestibility effects, effect direction, outcome hierarchy, risk of bias, quality of evidence, and limitations.
- Human-grade Nutrition Assessment: Reference, diet/ingredients, ingredient type, category, nutritional effects, digestibility effects, outcome hierarchy, effect direction, risk of bias, quality of evidence, limitations/key findings.
- Human-grade Safety Assessment: Reference, ingredient type, outcome, measured level vs. human-grade regulatory limit, safety assessment, outcome hierarchy, effect direction, risk of bias, quality of evidence, and limitations/key findings.
2.6. Quality Assessment
After the data were extracted, each study was assigned a “Quality of evidence” grade on a scale of A, B, C, D, or F, which utilized aspects from the Cochrane GRADE workbook [40] to ensure a causal relationship was present. A quality grade of “A” contained randomization of subjects/inclusion, blinding to the inclusion, a measurable effect, absence of conflicts of interest/bias, and more than one dose of the inclusion to understand the dose–response relationship. If all details were present in the study, a quality grade of “A” was assigned, but with each missing detail, the grade dropped by one level. For instance, a study would receive a quality grade of “B” if it included randomization, blinding, measured food safety parameters, and multiple dosages, but had conflicts of interest—meaning a single methodological limitation resulted in a lower overall grade. The bias was assessed by analyzing the “conflicts of interest” section and thought patterns that did not address both sides of a concept. For example, a study that was funded by a company that could benefit from the findings or which did not address the negative aspects of a compound were deemed as “biased” and the quality of evidence was decreased by one letter grade.
2.6.1. Risk of Bias Assessment
Each study was analyzed for factors that could contribute to study outcomes or study design. Aspects from the Cochrane Risk of Bias (RoB 2) tool were utilized to assess the potential for bias such as missing outcome data; bias in measurement of outcomes; source of funding; lack of proper randomization; and deviations from intended interventions. If any of the biases were detected, the study was classified as “High” likelihood, with a reduction in grade score. Studies with a lack of bias detected were classified as “Low”, with no effect on grade score. Each presence of a potential bias was weighed equally to ensure the consistency of the assessment.
2.6.2. Finding Interpretations
Each study was assigned an effect direction classification based on the integrated assessment of quality grade, risk of bias evaluation, statistical outcomes, and reported biological significance. This classification system was utilized to synthesize heterogeneous outcomes across diverse study designs and facilitate systematic interpretation of findings.
For additives and preservatives, effect direction was determined by analyzing adverse event rates, toxicity indicators, and clinically relevant health outcomes. Studies demonstrating statistically significant increases in adverse events, toxicity markers, or negative health parameters were classified as “harmful”. Studies showing reductions in adverse events, improvements in health markers, or beneficial physiological responses were classified as “beneficial”. Studies with null findings, non-significant differences between treatment and control groups, or conflicting evidence across measured outcomes were classified as “neutral”.
For human-grade versus feed-grade ingredient comparisons, a dual classification approach was integrated to address both the safety and nutritional aspects. Safety assessments utilized regulatory thresholds established by the FDA and USDA for human food safety. Ingredients meeting or exceeding contaminant limits for mycotoxins, heavy metals, pathogens, or biogenic amines relative to human-grade standards were classified as “not suitable for human food”, while those below established thresholds were classified as “suitable for human food”. Nutritional assessments compared macronutrient compositions, micronutrient density, digestibility coefficients, and bioavailability between human-grade and feed-grade formulations, with outcomes reported as directional changes (increase or decrease) relative to the feed-grade baseline values.
For processing effects on ingredients, effect direction was established through analysis of digestibility coefficients, nutrient retention profiles, antinutrient reduction, and bioavailability metrics. Processing interventions resulting in improved digestibility, enhanced nutrient bioavailability, reduced antinutrient content, or increased antioxidant activity were classified as “beneficial”. Interventions which caused nutrient degradation, reduced digestibility, or decreased bioavailability were classified as “harmful”. Studies which reported no significant changes, mixed effects across multiple outcomes, or outcomes dependent on specific contextual variables were classified as “neutral”.
An outcome hierarchy classification was applied to studies examining human-grade ingredients and processing effects to establish the relative strength and applicability of evidence (Section 2.2.2 and Section 2.2.3). Primary outcomes included direct measurements and nutrient levels, contaminant concentrations, growth parameters, and metabolic indicators. Secondary outcomes represented digestibility and bioavailability assessments. Tertiary outcomes encompassed adverse reactions, performance metrics, antinutrient levels, and bioactive compound concentrations. This hierarchical structure allowed for prioritization of outcomes with the greatest clinical and nutritional relevance when synthesizing findings across heterogeneous studies, rather than classifying all outcomes as having equal impacts on overall pet health.
2.7. Processing of Ingredients Subgroup Analyses
In order to address the heterogeneity of processing methods across studies on whole or processed ingredients, a processing intensity classification system was deployed. These studies were categorized into three primary processing groups based on the degree of thermal, chemical, or mechanical modification.
2.7.1. Minimal Processing: Methods Involving Limited Thermal Exposure and Mechanical Alteration
Raw ingredients (no processing);Cold pressing (≤40 °C);Freeze-drying/lyophilization;Air-drying at ambient temperatures;Basic cleaning and washing.
2.7.2. Moderate Processing: Methods Involving Controlled Thermal or Mechanical Treatment
Steam cooking (≤100 °C);Light roasting (≤120 °C);Boiling/steaming (≤100 °C for ≤30 min);Germination and sprouting;Soaking and tempering;Coarse milling and grinding.
2.7.3. Intensive Processing: Methods Involving High Thermal, Mechanical, and/or Chemical Treatment
Extrusion (>120 °C, high pressure);High-temperature roasting (>120 °C);Pressure cooking (>100 °C, high pressure);Fine milling and mechanical disruption;Chemical preservation and pH modification;Retort sterilization.
2.7.4. Effect Direction Categorization
Beneficial effects: Improved digestibility, increased antioxidants, and reduced antinutrients (overall net positive).Neutral effects: No significant changes or mixed effects (harmful + beneficial).Harmful effects: Nutrient losses and reduced digestibility or bioavailability (overall net negative).For processing analysis, grade A studies were allotted 3 points per effect direction, 2 points were allotted for grade B, and 1 point for grade C.
3. Additives and Preservatives Are Harmful to Pets
3.1. Additives vs. Preservatives
This category is broad, as many ingredients can be classified as additives, but this review will distinguish between additives and preservatives because many claims consistently mentioned both. Additives are defined by AAFCO as “An ingredient or combination of ingredients added to the basic feed mix or parts thereof to fulfill a specific need”. It is usually used in microquantities and requires careful handling and mixing [41]. The AAFCO definition of preservatives is “A substance added to protect, prevent, or retard decay, discoloration, or spoilage under conditions of use or spoilage” [41]. The flow chart in Figure 2 depicts the relationship between additives and preservatives within the context of pet food [42].
3.2. Systematic Review of Additives in Pet Food
The number of additives in pet food is vast and the scientific basis for these determinations may be insufficient for ensuring long-term safety [42]. To properly assess the safety of additives, a systematic review was performed on all available literature using the search criteria in Figure 3. The studies were assessed for additives that were deemed harmful to either dogs or cats. Each eligible study was reviewed for acute toxicity, chronic toxicity, or adverse reactions (diarrhea, vomiting, aggression, lethargy, weakness, etc.) which can be seen in Table 1.
3.3. Systematic Review of Preservatives in Pet Food
Preservatives are added to pet foods in order to prevent oxidative rancidity, microbial growth, and degradation of essential nutrients. However, a study found that food containing preservatives received one of the most negative ratings from consumers, with an average score below 3 on a 1–7 scale (M = 2.235, SD = 1.348) [105]. To understand this phenomenon, a systematic review was performed using the search criteria in Figure 4. The studies were assessed for preservatives that were deemed harmful to either dogs or cats. Each eligible study was reviewed for acute toxicity, chronic toxicity, or adverse reactions (diarrhea, vomiting, aggression, lethargy, weakness, etc.) which can be seen in Table 2.
4. Human-Grade Ingredients Are Safer and More Nutritious
The utilization of human-grade ingredients aligns with the humanization of pet food, which is occurring alongside the increase in pet ownership [147]. Human-grade ingredients are produced, handled, and processed in the United States to meet stringent standards set by the Food and Drug Administration (FDA) and U.S. Department of Agriculture (USDA) which mandate specific guidelines for cleanliness, contamination limits, traceability, and processing conditions. This also means that each ingredient in a recipe must be classified as human-grade to meet human consumption standards. Feed-grade ingredients are regulated differently by the AAFCO and FDA, which includes different standards for nutritional composition, contaminant limits, labeling, good manufacturing practices, and regulatory oversight. Human-grade ingredients may offer a higher standard of safety [148], enhanced nutritional value [149], and improved gut health [149,150]. Feed-grade ingredients are not suitable for human consumption due to the inclusion of byproducts and parts from animals that are classified as “dying, disabled, diseased, or deceased [151]”. The search criteria to retrieve human-grade and feed-grade studies can be seen in Figure 5. Study-level assessment for nutritional aspects can be seen in Table 3a, while the safety assessment can be seen in Table 3b.
5. Whole Ingredients Are Healthier than Processed Ingredients
Currently, there is no specific organization that governs “whole ingredient” claims for pet food. Pet food manufacturers would need to ensure that their products are aligned with FDA and State Department of Agriculture regulations, which are typically adopted from AAFCO standards [155,156]. The AAFCO requires “whole grain” claims to be listed in their whole form on the ingredient label such as brown rice or whole wheat. The ingredient must follow “AAFCO officially defined animal feed ingredient” terminology and “No reference to quality or grade of ingredients can be made in the ingredient statement” [157,158]. However, processing these grains to produce pet food yields unrecognizable grains due to the nature of heat, milling, emulsification, and extrusion. This means that consumers have little confirmation that pet foods are supplied with whole ingredients that have not been modified via processing. Alternatively, human-grade pet food diets which claim to utilize whole grains are required to contain at least 8 g of dry, whole grain ingredients per reference amount customarily consumed (RACC) [159]. The FDA also requires that whole grain ingredients contain all parts of the grain (bran, germ, and endosperm) in their natural proportions [160]. Figure 6 provides the search criteria utilized to gather whole vs. processed ingredient studies. The study-level assessment was conducted and displayed in Table 4.
6. Results and Discussion
6.1. Pet Food Additives
6.1.1. Study Selection and Characteristics: Additives
The systematic literature search identified 64 studies examining the effects of pet food additives (zootechnical, nutritional, and functional ingredients) on adverse health outcomes. A total of 60 studies met inclusion criteria and had calculable effect sizes, allowing for complete data utilization without further exclusions (Figure 3). Four studies were removed as these were in vitro or review articles with no extractable data. Risk of bias assessment resulted in a relative frequency of 11.7%, with 7 studies showing high potential for bias (Figure 7).
The 60 included studies contained 33 dog studies (55%) and 27 cat studies (45%), a total of 3218 participants, with 1304 controls, 1914 undergoing treatment (mean = 53 participants). Study durations ranged from 4 to 560 days (mean = 69.6 days, interquartile range = 52.5 days). Additive types included preservatives, probiotics, antioxidants, enzymes, and other functional ingredients. The quality assessment yielded 17 grade A studies (28.3%), 33 grade B studies (55%), and 10 grade C studies (16.7%). Approximately 8 out of 60 studies reported any events, with 86.7% of studies reporting no adverse events in either control or additive groups. The adverse event rate was 2.3% amongst control groups while additive groups had a 2.66% adverse event rate. A primary analysis consisted of a Bayesian risk difference meta-analysis with moderators, Bayesian meta-regression, and a supplemental Peto meta-analysis to estimate heterogeneity without continuity corrections.
6.1.2. Primary Bayesian Meta-Analysis with Risk Difference Effect Size: Additives
The risk difference effects sizes were calculated using adverse event totals for the additive and control groups in each of the 60 studies. Bayesian methodology revealed a pooled risk difference (RD) estimate of 0.0006 (95% CI: −0.190, 0.892), translating to a 0.006% increase in adverse events for additive groups (Table 5). While not statistically significant, the estimation implies a slight increase in adverse event potential in the additive group when compared to the control. This aligns with a 0.36% increase in additive adverse event rates (2.66% vs. 2.3% control). Alongside preservatives, the confidence interval crossed the null value of 0, indicating that the effect was not statistically significant at 95% CI. The BF_10_ showed a null effect of 0.055, providing strong evidence against the presence of meaningful harm and translating to 18:1 odds in favor of the null hypothesis. A sensitivity analysis was performed by excluding “High” RoB studies to understand the effects of bias on estimations, leading to a near-identical BF_10_ = 0.057 (95% CI: 0.447, 0.508). This finding shows a lack of impact from low-quality studies on overall effect size estimates and indicates robustness (Figure 8).
6.1.3. Moderation in Bayesian Risk Difference Meta-Analysis: Additives
Moderation was performed using the Bayesian risk difference model with species listed as subgroups and predictors such as quality grade, duration length, additive type, and RoB. Results displayed weak evidence for effect modifications, with Bayes factors consistently below 1.0 (Table 6). Species differences existed, as cats (BF_10_ = 0.396) showed slightly weaker evidence against moderation when compared to dogs (BF_10_ = 0.119). Duration length provided the strongest evidence for moderation in dogs (BF_10_ = 0.066), with virtually no effect from exposure time to additives. Results for cats showed weaker evidence (BF_10_ = 0.490) but still favored no moderation by duration length. Consistent with previous moderators, quality grade showed weak evidence for inclusion with cats (BF = 0.4410) showing weaker evidence against moderation than dogs (BF = 0.117). The same trend was observed when moderating by risk of bias, implying that methodological quality did not have a significant impact on the null findings (cats BF = 0.552, dogs BF = 0.158). Across all moderator assessments, inclusion Bayes factors ranged from 0.066 to 0.552, meaning moderate evidence was found against the inclusion of moderators. This consistent pattern supports the null findings and confirms the homogeneous effects that additives may have on pet food.
When moderating by additive types such as functional, nutritional, and zootechnical ingredients, the effect sizes portray a cluster located at 0.05. The consistency of the effects is evident, but none reached statistical significance, with all ranges including the null value of 0. The functional additive type provides an opposing effect direction from the nutritional additives, while the zootechnical show bidirectional effects (Figure 9). More research is needed in this area to confirm true effect sizes for each additive type, informing consumers of true risk differences. While not significant, the effect direction is null, and additives appear to have no effect on pet adverse event rates.
6.1.4. Heterogeneity: Classical Peto Meta-Analyses Additives
In order to obtain an accurate assessment of heterogeneity between studies and impact on effect size estimates, a Peto meta-analysis was selected for the ability to handle large quantities of double-zero studies and the observed heterogeneity. Results confirmed this observed heterogeneity with I^2^ = 73.31% and H^2^ = 3.747, with a statistically significant meta-analytic test Q_e_(59) = 18.73 (p = 0.002). The Bayesian analysis methodology was able to successfully handle this heterogeneity with an I^2^ = 0.068% (95% CrI: 0.000 to 0.138) and H^2^ = 1.001 ((95% CrI: 1.000 to 1.001). The BF_10_: 0.035 indicates 29:1 odds against the presence of heterogeneity by focusing heavily on prior distribution for τ, which was <0.01, driving the estimate towards 0. The Peto model provides a stronger heterogeneity estimate as it contains model-free, objective variance decomposition without requiring prior information.
6.1.5. Publication Bias Assessment: Additives
Unlike the Publication Bias Assessment for preservatives, the regression tests yielded converging results. The meta-regression test, z = 0.927, (p = 0.354), and weighted regression test, t(58) = 1.500, (p = 0.139), both provided evidence against significant asymmetry, providing reassurance in the effect estimates. Fail-safe N analysis showed values of 0 across the Rosenthall, General, and Rosenburg tests, while the Orwin test showed that 60 studies are needed to nullify the findings from this study. Overall, the combination of tests was suggestive of low risk of publication bias, and visual inspection of Figure 10 aligns with these results.
6.1.6. Bayesian Model Diagnostics and Convergence: Additives
Upon MCMC convergence assessment, the values delivered strong convergence across all 60 studies with multiple moderators. R-hat values ranged from 1.001 to 1.013, demonstrating strong convergence. Effective sample size values for cats ranged from 8883 to 38,624, while for dogs, they ranged from 1269 to 23,041, indicating higher chain mixing. The wider posterior distributions provide a more efficient exploration of parameter space and MCMC sampling with minimal autocorrelation. MCMC error ranged from 0.005 to 0.011 for cat parameters and 0.007 to 0.028 for dog parameters. MCMC errors consistently below 3% of the posterior standard deviation are indicative of true posterior uncertainty rather than simulation noise. Overall, model convergence was excellent, and ESS metrics provided evidence for well-mixed chains. One exception was zootechnical additives for dogs, which contained a marginally high R-hat = 1.013 and should be further investigated in future research.
6.2. Bayesian Meta-Analysis: Pet Food Preservatives
6.2.1. Study Selection and Characteristics
The systematic literature search identified 43 studies meeting predefined inclusion criteria. Four studies were excluded as they did not contain treatment and control groups with extractable data [134,135,136,137]. The risk of bias assessment yielded a relative frequency of 5.1% for high potential of bias within included studies (Figure 11). Of these, 39 studies with calculable effect sizes were included in the final Bayesian meta-analysis (Figure 12).
The 39 included studies comprised 30 dog studies (77%) and 9 cat studies (23%), with a total of 1613 participants (644 control, 969 treatment). Study durations ranged from 14 to 941 days (median = 60 days, interquartile range = 28–168 days). Grade A studies comprised 13% of studies, with 66% grade B studies and 20% grade C studies. Study duration tended to be longer rather than shorter, with 77% of studies measuring preservatives impact >30 days. Studies with dogs as the primary species accounted for 77% of the dataset, with cats accounting for 23% of dataset. The adverse event rate was approximately 0.15% in the control group and 1% in the preservative group.
6.2.2. Primary Bayesian Meta-Analysis with Risk Difference Effect Size: Preservatives
Effects size computations were calculated using adverse event totals for the preservative and control groups in each of the 39 studies. Bayesian methodology revealed a pooled risk difference (RD) estimate of 0.0003 (95% CI: −0.190, 0.892), corresponding to a 0.03% increase in adverse events for preservative groups (Table 7). While not statistically significant, this estimate suggests that preservatives provide a slight increase in adverse reactions in comparison to the control, matching the 0.85% increase in preservative adverse event rates (0.15% vs. 1% control). However, the confidence interval included the null value of 0, indicating that the effect was not statistically significant at 95% CI. Likewise, these results translate into 6:1 odds in favor of the null hypothesis of no effect for preservatives. The Bayes factor (BF) showed a null effect of 0.162. A sensitivity analysis was conducted to understand the effects of high RoB studies on RD, resulting in 2 excluded studies, with 37 remaining in the analysis. The estimate for RD = 0.0004 (95% CI: −0.004, 0.009) was consistent with the all-studies analysis and was not statistically significant. This result warranted no further subgroup analysis to examine the data for bias as the difference was negligible.
6.2.3. Moderation in Bayesian Risk Difference Meta-Analysis: Preservatives
In order to assess the effect of moderators on risk difference effect size estimates, Bayesian meta-analysis and meta-regression were performed. Species was utilized as a subgroup, with duration length, study quality, RoB, and preservative type assigned as predictors. This yielded weak evidence against the moderation of species, preservative type, duration, quality grade, and RoB (Table 8). Each moderated BF stayed below 0.601, suggesting that no evidence is present that the studied characteristics modify preservative adverse events. Notably, cats exhibited greater uncertainty from higher BF estimates and wider confidence intervals.
Moderation by preservative type showed clear forest plot differences in Figure 13 as antimicrobial preservatives showed greater variability in RD effect sizes and more adverse events when compared to antioxidants. Likewise, the effect direction was slightly negative and warrants further research to elucidate the potential correlations between antimicrobial preservatives and negative effects in pets.
6.2.4. Heterogeneity: Classical Peto Meta-Analysis on Preservatives
In order to understand the heterogeneity of the included studies without continuity corrections or exclusion of double-zero studies, a Peto meta-analysis was conducted using risk difference effect sizes. The results yielded an I^2^ = 75.45%, H^2^ = 4.704, and Q_e_(38) = 4.07 (p = 0.044), proving the presence of statistically significant between-study heterogeneity. On the contrary, Bayesian averaging was able to handle this efficiently with an I^2^ = 0.23 (95% CrI: 0.000 to 2.646) and τ = 4.674 × 10^−4^ (95% CrI: 0.000 to 0.007), indicating most of the posterior probability mass is located at zero heterogeneity (Table 7). BF = 0.08 also provided strong evidence against heterogeneity, likely due to the 0.5 continuity corrections in computing the RD effect size. The authors observed large amounts of heterogeneity in study design, populations, dosing, and outcomes, which aligned more so with the Peto estimate for heterogeneity rather than the Bayesian estimate. When moderating by species, both dogs and cats showed Bayes factors which strongly favored the null model of zero heterogeneity. In other words, the inclusion of dogs (BF = 0.093) and cats (BF = 0.238) showed 11:1 and 4:1 odds against the presence of heterogeneity.
6.2.5. Publication Bias Assessment: Preservatives
Publication bias was assessed via a random-effects methodology with fixed effects under H1, utilizing Bayesian risk difference estimates for each of the 39 studies. Results show no clear signs of asymmetry within the funnel plot (Figure 14). However, regression tests showed conflicting results, as a meta-regression test, z = 1.307 (p = 0.191), suggested non-significant asymmetry, while a weighted regression test, t(37) = 3.789 (p < 0.001), found highly significant asymmetry. The discrepancy between tests can result from smaller studies with null findings or negative findings that are underrepresented. All fail-safe N metrics (Rosenthal, General, and Rosenburg) delivered values of 0 besides Orwin = 39, indicating that 0–39 unpublished studies are required to nullify the observed effects. This result aligns with the null pooled estimate and implies that the meta-analysis is robust. Overall, the combination of conflicting asymmetry tests and zero fail-safe N metrics indicates patterns of potential publication bias which require assessment in future research.
6.2.6. Bayesian Model Diagnostics and Convergence
Bayesian MCMC assessment delivered excellent convergence across both species as subgroups. All R-hat values were ≤1.001 with MCMC error ranges = 0.005–0.010 (<0.05). The effective sample size (ESS) ranged from 10,682 to 33,867, well beyond the recommended 1000 for stable estimates. Estimates for dogs showed ESS = 10,682, R-hat = 1.001, and MCMC error = 0.01. Estimates in cats showed elevated ESS = 15,099, R-hat = 1.0, and MCMC error = 0.006. This assessment indicates that MCMC chains properly explored the posterior distribution without the need for autocorrelation and ensures that estimates are precise, not dominated by simulation noise.
6.3. Meta-Analysis and Meta-Regression: Effect of Processing on Digestion
6.3.1. Dataset Overview and Scope: Impact of Processing on Digestion
A total of five high-quality studies (all grade A) containing 102 effect size comparisons were included in the random-effects meta-analysis, which aimed to quantify the impact of processing on digestibility. This yielded 15 different ingredients across 18 different processing methods, covering 16 distinct outcome categories such as protein, starch, and total tract/ileal digestibility. The studies contained 62.7% intensive, 19.6% intensive/moderate, 16.7% moderate, and 1% minimal degree of processing. Risk of bias assessment showed a relative frequency of 0% for studies with high potential bias (Figure 15).
6.3.2. Overall Effect of Processing on Digestion
Processing delivered mixed effects, with predominantly harmful impacts on digestibility. In 50% of comparisons, digestibility was reduced, while 27.5% showed improvements in digestibility and 22.5% showed no significant change. The effect size magnitude was large, as 88.2% of effects caused substantial changes (Standard Mean Difference > 0.8). Likewise, the pooled Standardized Mean Difference (SMD) was 1.971 (95% CI: 0.567, 3.374, p = 0.005). This result indicates that, across all processing methods, intensities, and ingredients, processing generally improves the digestibility of ingredients by approximately two standard deviations when compared to unprocessed controls. The mean percent change across studies was +51.3%, with direction varying depending on outcome type. A clear dose–response relationship emerged, with increasing processing intensity associated with progressively larger digestibility changes (minimal: +7.8%, moderate: +27.7%, intensive: +75.1%). These differences in processing intensity can be seen in Figure 16.
6.3.3. Meta-Regression: Processing Intensity on Digestibility
The impact of processing intensity on digestibility of ingredients was substantial and statistically significant across the 102 study comparisons. Results showed a pooled SMD = 1.8 (95% CI: 0.139 to 3.462, p = 0.034) for intensive degree of processing, indicating a significantly positive impact on digestibility. Moderate degree of processing showed a clear improvement in digestibility in comparison to intensive methods SMD = 2.631 (95% CI: 0.162 to 5.100, p = 0.038), while the impact of minimal methods could not be calculated due to insufficient data (k < 2). Heterogeneity comparisons between intensive (I^2^ = 97.66%) and moderate (I^2^ = 83.25%) methods revealed more consistency in the results for methods with a moderate degree of processing (Figure 17). However, the degree of processing was not a significant moderator of digestibility outcomes and did not explain the large heterogeneity (QM(1) = 0.34, p = 0.562).
6.3.4. Meta-Regression: Ingredient Type on Digestibility
When moderating by the type of ingredient, the strongest contributor to effect size heterogeneity was discovered (QM(9) = 59.99, p < 0.001). Huge variability was observed between ingredient type effect sizes, suggesting the importance of specifying an ingredient matrix prior to assessing the risk of processing intensity or method. Navy beans demonstrated a large beneficial effect (SMD = 14.095, 95% CI: −69.595, 97.785), alongside yellow peas (SMD = 9.074, 95% CI: −11.909, 30.057) and resistant starches (SMD = 6.10, 95% CI: −0.155, 12.356). Ingredients such as chickpeas (SMD = 0.463, 95% CI: −40.462, 41.388), beef byproducts (SMD = −0.722, 95% CI: −1.256, −0.188), and poultry byproducts (−0.376, 95% CI: −1.013, 0.262) showed null impacts in digestibility. Conversely, whole rice (SMD = −1.325, 95% CI: −4.712, 2.063) demonstrated negative effects from moderate/intensive processing on protein digestibility (Table 9). Overall, ingredient type was responsible for the largest impacts on digestion across all processing methods and intensities. As such, processing recommendations should be tailored to the recipe rather than determined by interpreting the effect size alone.
6.3.5. Meta-Regression: Processing Method on Digestibility
Moderation by processing method yielded strong statistical associations with digestibility outcomes (QM(8) = 38.24, p < 0.001). This means that the method of processing is substantially more important than the degree of processing within that given method. For instance, selecting roasting or extrusion is more explanatory of digestibility outcomes rather than the temperature, pressure, or time used within these processes. Controlled thermal processing revealed a potential dose–response pattern within temperature. At 0.5 h duration, 95 °C produced an SMD = 2.572 (p = 0.058), 120 °C produced an SMD = 5.116 (p = 0.070), and 140 °C produced an SMD = 7.404 (p = 0.108). Likewise, boiling (SMD = 4.160, 95% CI: 0.382, 7.938) and wet roasting + tempering (SMD = 6.514, 95% CI: −5.313, 18.341) produced largely beneficial outcomes on digestion. Significant variability exists between processing methods, warranting future research to identify the optimal methods for digestion.
6.3.6. Heterogeneity and Variability: Processing on Digestion
Due to high heterogeneity (I^2^ = 87.326%, τ^2^ = 10.065, Q(101) = 796.91, p < 0.001) across digestibility studies, a meta-regression was necessary to understand the contributing factors to the effect size. These heterogeneity values indicate that 87% of observed variation in effect size originates from true between-study differences, with observed variance 10x greater than what is expected from sampling error alone. The wide prediction interval (−4.477 to 8.419) suggests that effects could range from highly negative to highly positive impacts on ingredient digestibility. As expected, the effects of processing appear to be highly context-dependent. This can likely be explained by different outcome types (protein, starch, and total digestibility), ingredient types (legumes, grains, and animal byproducts), and processing method parameters (time, temperature, and moisture).
6.3.7. Publication Bias: Impact of Processing on Digestion
Weighted regression and meta-regression testing showed significant publication bias (t(100) = 5.681, p < 0.001, z(100) = 10.56, p = <0.001). These test statistics indicate that smaller studies with null or positive effects are underrepresented in the published literature (Table 10). Likewise, the asymmetry estimate (μ = −2.393, 95% CI: −3.392 to −1.394) indicates that smaller studies report systematically larger beneficial effects, potentially stemming from methodological differences between smaller studies (Figure 18). Fail-safe N testing counteracted the publication bias with an extremely high Rosenthal fail-safe N = 2107 and Orwin fail-safe N = 102. Likely, the true effect size is less positive than the estimate provided and requires future research to elucidate.
6.4. Meta-Analysis and Meta-Regression: Effects of Processing on Nutrient Content
6.4.1. Dataset Overview and Scope: Nutrients
A total of 137 effect size comparisons were extracted from six studies, 69.7% grade A studies and 30.3% grade C, respectively. This analysis contained 25 different ingredients across 19 different processing methods, yielding 23 distinct outcomes across 5 nutrient categories. These factors contributed to a more heterogeneous dataset with more beneficial effects overall (61.1% vs. 27.5% in digestion). The risk of bias assessment showed a relative frequency of 0% high potential bias studies (Figure 19).
6.4.2. Overall Effects of Processing on Nutrients
Beneficial effects account for 61.1% of the dataset, stemming from increased nutrient content, reduced LDL cholesterol, and reduced antinutrients. Harmful effects were present 14% of the time, resulting from a reduction in nutrients. Neutral effects occurred 12.1% of the time, showing no major impacts on nutrient content. The effect size across 137 study comparisons revealed an SMD = 1.405, 95% CI: 0.622 to 2.187, p < 0.001), indicating that processing provides a significant positive effect on nutrients (Figure 20). This translates to a modest improvement in nutrient content by 1.4 standard deviations when compared to unprocessed controls. The effects seen on nutrients were slightly smaller than processing impacts on digestibility (SMD = 1.971), which implies that processing has more impact on digestion than nutrition. However, the heterogeneity was extremely high (I^2^ = 95.76%, τ^2^ = 22.42, Q(136) = 920.24, p < 0.001), warranting a meta-regression to understand the true effects.
6.4.3. Meta-Regression: Impact of Processing Intensity on Nutrient Contents
Moderation of nutrient retention by processing intensity showed no significant differences between groups, implying that moderate and intensive processing are relatively similar in outcomes (QM(1) = 0.34, p = 0.559). Intensive processing showed SMD = 1.548 (95% CI: 0.549 to 2.548, p = 0.003, k = 104), while moderate processing demonstrated SMD = 1.103 (95% CI: −0.058 to 2.265, p = 0.062, k = 33). These results suggest a potential for dose–response relationship as increases in intensity translated to increases in nutrient content. Although both categories trend toward positive effects, the moderate processing estimate includes zero in the confidence interval and does not reach statistical significance. Both groups maintained high heterogeneity and did not explain the observed variability between studies. The variability in effects can be seen in Figure 21, with clustering near effect sizes of zero.
6.4.4. Meta-Regression: Impact of Ingredient Type on Nutrient Contents
Ingredient type emerged as the most significant moderator on nutrient content (QM(24) = 6644.92, p < 0.001), indicating that ingredient selection fundamentally determines the outcome of processing. Ingredients such as quinoa (SMD = 5.925, 95% CI: 3.080 to 8.771, p < 0.001), kiwicha (SMD = 5.635, 95% CI: 3.193 to 8.078, p < 0.001), barley (SMD = 2.974, 95% CI: 1.166 to 4.782, p = 0.002), and soybeans (SMD = 0.620, 95% CI: 0.254 to 0.986, p = 0.030) showed the largest improvements. These effects resulted from reductions to antinutrients and increases in antioxidant activity (Table 11). Negative impacts were also observed in ingredients such as sweet potatoes (SMD = −4.582, 95% CI: −5.320 to −3.845, p = 0.008), butternut squash (SMD = −3.561, p = 0.099), black beans (SMD = −0.789, 95% CI: −1.165 to −0.414, p < 0.001), and other legumes (chickpeas, lentils, navy beans, and yellow pea). The negative impacts were observed on triglycerides, antioxidant activity, and resistant starch content. Overall, processing impacts on nutrients are extremely ingredient-dependent.
6.4.5. Meta-Regression: Impact of Processing Type on Nutrient Content
When moderating by processing method, statistical significance was reached (QM(18) = 199.02, p < 0.001), which reveals a true difference in effects when processing methods vary. Large positive effects were seen in methods such as germination (SMD = 8.679, 95% CI: 6.549 to 10.808, p < 0.001), steam explosion (SMD = 5.334, 95% CI: 0.695 to 9.974, p = 0.029), extrusion (SMD = 3.779, 95% CI: 1.106 to 6.453, p = 0.012), and extrusion + drying (SMD = 8.765, p = 0.119). Other methods produced null effects including cooking (SMD = 0.408, p = 0.820), extruded + fine milling (SMD = −0.071, 95% CI: −0.297, 0.156), and roasting (SMD = −0.659, p = 0.575). On the contrary, methods such as dehulling + boiling + milling (SMD = −1.223, 95% CI: −2.265, −0.181), blanching (SMD = −3.659, p = 0.089), and micronized fine milling (SMD = −1.501, 95% CI: −3.094, 0.094) produced negative effects on nutrient content. The impact of processing method on nutrient content is evident but pales in comparison to ingredient type.
6.4.6. Heterogeneity and Variability: Impact of Processing Type on Nutrient Content
The analysis revealed high heterogeneity (I^2^ = 85.221%, τ^2^ = 5.732, Q_e_(136) = 920.24, p < 0.001), demonstrating a similar phenomenon as the digestibility assessment. This translates to 85% of observed variation stems from true between-study differences rather than sampling error. The substantial heterogeneity confirms that nutrient retention is highly context-dependent with variability outcomes dictated by ingredient type, nutrient type, and processing conditions. The H^2^ = 6.766 indicates that the observed variance is seven times greater than what would be expected from sampling error alone. Likewise, the wide 95% prediction interval is evident of substantial improvements or losses due to processing.
6.4.7. Publication Bias Assessment: Impact of Processing on Nutrients
Similarly to the assessment on digestion, the funnel plot asymmetry test in Table 12 revealed significant publication bias (t(137) = −2.329, z = −2.938, p < 0.001). This indicates the potential for smaller studies showing null or positive effects on nutrient content which are not represented by the published literature (Figure 22). However, the fail-safe N tests are evident of a robust effect size estimate, given that 137–5069 null studies would be needed to nullify the overall effect (Rosenthall fail-safe N = 5069, Orwin fail-safe N = 137, Rosenburg fail-safe N = 0).
6.5. Human-Grade vs. Feed-Grade Analysis
Dataset Overview and Scope
The search criteria for human-grade and feed-grade foods provided six total studies, four of which were focused on nutritional differences, while two focused on safety. Nutritional studies comprised 75% B grade quality and 25% C grade quality studies. Safety studies contained one A grade study and one B grade study. Due to a high level of between-study heterogeneity and lack of identical outcomes measured, the studies were not assessed via meta-analysis. Instead, the pooled effect direction was calculated to understand the consensus of available studies. This was performed by assigning weight to each quality grade (3-A, 2-B, 1-C) and calculating a total score. The safety assessment for feed-grade vs. human-grade ingredients showed a 100% harmful effect direction (harmful score = 5, neutral score = 0, beneficial score = 0). For nutritional assessment, human-grade diets yielded an 85.7% beneficial effect direction, 14.3% neutral, and 0% harmful. On the contrary, results showed that 100% of nutrition-focused studies contained high detection of bias, while safety studies contained a 0% relative frequency for bias (Figure 23 and Figure 24). All nutritional studies showed signs of potential selective reporting bias and outcome measurement bias. This was due to industry funding, lack of blinding, and low randomization. Results should be interpreted carefully as scores do not fully reflect the impact of bias.
7. Discussion
7.1. Interpretation of Additive and Preservative Results
7.1.1. Effects of Additives on Pet Adverse Events
According to the International Food Information Council, 62% of consumers report that ingredients have at least a moderate influence on their food purchasing decisions [184]. Likewise, 58% of consumers strongly or somewhat agree that they avoid products with “chemical sounding” ingredients [184]. The inclusion of additives in pet food is common throughout the pet food industry because of their ability to improve texture, appearance, palatability, and ensure adequate nutritive value. Some of the most common additives used in pet foods are flavor enhancers (e.g., turkey flavor or lactic acid), coloring agents (e.g., caramel color), and nutritional additives (e.g., vitamin D3), texture and binding agents (e.g., guar gum), probiotics and prebiotics (e.g., Inulin), emulsifiers (e.g., lecithin), and pH regulators (e.g., sodium bicarbonate). This study assesses the safety of additives in pet food by performing a risk difference Bayesian meta-analysis. Results show a pooled RD = 0.0006 (95% CI: −0.190, 0.892), supporting the null hypothesis of no effect on adverse events from additive consumption. High heterogeneity was observed, I^2^ = 73.31%, warranting subgroup analysis with moderators such as species, quality grade, duration length, additive type, and RoB. The BF for each inclusion ranged from BF = 0.066 to 0.552, indicating no moderator effects were detected. When moderating by additive type, effect sizes remained similar but standard error displayed clear differences between types. Functional additives appear to show potential for negative effects while nutritional additives show potential for positive effects. Zootechnical additives display an even distribution with potential for positive or negative effects. No evidence was found for the harms or benefits of additives being included in pet food diets.
7.1.2. Effects of Preservatives on Pet Adverse Events
Pet food safety is the most important factor for 94% of consumers, making it critical for pet food manufacturers to provide preservatives that are regulated and proven safe [185,186]. Preservatives are used to prevent microbial activity in the form of humectants which control water activity to a level where microbes cannot utilize the available moisture to grow and cause spoilage. The other main type of preservative, antioxidants, are responsible for reducing oxidation that occurs in lipids and proteins exposed to oxygen which prevents harmful byproducts and nutrient degradation. The Bayesian RD meta-analysis assessed the current level of evidence for harm caused by preservatives, specifically any adverse event from vomiting to more extreme outcomes such as death. Results from this study are aligned with the null hypothesis that preservatives cause no meaningful harm to dogs or cats RD = 0.0003 (95% CI: −0.190, 0.892, BF = 0.162). A sensitivity analysis was performed to identify potential biases and the impact on effect size estimations, which showed no meaningful difference. Meta-regression by species, preservative type, duration, quality grade, and RoB provided no evidence for moderation. However, a trend emerged when moderating by species, as cats showed consistently higher effect sizes when compared to dogs, hinting at a potential species-specific biological mechanism (dogs RD = 0.229–0.339, cats RD = 0.434–0.601). Similarly, a trend emerged between preservative types as antimicrobials showed noticeably higher effect sizes and a wider range of uncertainty. This could represent a potential for harm specific to certain types of antimicrobials and warrants further research to understand the risk.
7.2. Interpretation of Human-Grade vs. Feed-Grade Results
The included studies [148,149,150,151] demonstrated highly relevant findings for this systematic review but revealed notable limitations that limit the comparability and interpretability of the findings. All four studies exhibited high levels of RoB due to an absence of blinding protocols across the outcome measurements, commercial funding from brands that used results to back claims, and utilization of non-canine models to compare with canine results. One particularly large issue was identified, as the human-grade formulas were not identical to feed-grade counterparts, which limits the direct comparability. For example, diets utilized in [150] showed a feed-grade Blue Buffalo recipe containing ingredients such as deboned chicken, chicken meal, brown rice, barley, oatmeal, pea starch, flaxseed, chicken fat, etc. However, the human-grade JustFoodForDogs formula contained chicken thighs, white rice, apples, carrots, spinach, chicken gizzard, chicken liver, etc. These non-identical recipe components yielded differing percentages of dry matter, protein, fat, fiber, nitrogen-free extract, and mineral content, which undoubtedly contributed to the differences in outcomes. As seen in Section 6.3.4, the ingredient differences account for the largest impact to digestion which limits the value of this comparison. Due to a small sample size, statistical significance was not reached by the majority of studies for serum chemistry, blood count, and fecal attributes [150]. Similar issues arose in a study by Algya et al. 2018, which concluded that fresh pet food was higher in protein and fat, and was well tolerated in the short term [187]. The authors found a noticeable microbiome shift, higher digestibility, and lower triglycerides [187]. These findings were confounded by a high risk of bias originating from industry funding, lack of blinding, selective reporting, and missing baseline data. Algya and colleagues stated that “differences due to the dietary treatments cannot be attributed to any specific ingredients or nutrient concentrations, but the diets as a whole”, which does not isolate variables and violates controlled experiment design principles [187]. Roberts and colleagues (2023) conducted an experiment to understand the nitrogen true metabolizable energy and amino acid digestibility differences between human-grade and feed-grade diets using precision-fed cecectomized rooster assays [148]. This study design provided high levels of control over confounding variables while advancing knowledge in vegan dog food digestibility. Issues arise when directly comparing the findings to amino acid digestion in dogs, as the measurement types are not identical. Studies [149,152] provide promising outcomes in dry matter digestibility of human-grade dog foods but lack variable isolation and blinding, which limit the significance of findings.
Aside from the lack of true comparison between feed-grade and human-grade foods, there is potential for human-grade ingredients to provide improved digestibility. Studies by Hendriks et al. (2013) and Oba et al. (2020) compare feed-grade digestibility values to diets made with human-grade ingredients [152,188]. Results show that average dry matter digestibility is identical between diets, while organic matter is slightly higher in human-grade diets (Table 13). While many values did not reach statistical significance, the human-grade diets trended towards higher protein digestibility aside from arginine (Table 13). However, this comparison is limited as the diets, animals, and measurements were different between studies. This lacks the ability to be used to draw true conclusions, and further research is needed to clarify the true effects.
A limitation of the search criteria was the lack of meat-related studies, which are a substantial aspect to pet diets. Faber et al. (2010) assessed the protein quality of meat and fish substrates in dog diets [189]. An immobilized digestive enzyme assay, cecectomized rooster assay, and ileally cannulated dog assay were utilized to assess the digestibility of each protein source. Results showed a significant difference in crude protein (CP) with pollock (96.9% CP) > salmon (92.8%) > chicken (90.3%) > pork (86.2%) > beef (82.7% CP). Pollock provided the highest digestibility across all assays while chicken breast remained the lowest (86% AA digestibility). The authors concluded that “despite the differences in composition and standardized digestibility values, when the protein sources were added to diets at a concentration of approximately 30%, no differences in test protein substrates were noted in either ileal or total tract nutrient digestibility [189]”. Findings from this study indicate that differences exist even between human-grade ingredients. A study by Kerr et al. (2012) studied digestibility, fecal characteristics, and metabolic response in cats that were fed a high-protein extruded diet, raw beef-based diet, and cooked beef-based diet [190]. Results from this study showed that no differences existed between the cooked and raw beef-based diets, while extruded diets had lower digestibility [190]. However, diets differed in composition which limits the true comparisons in metabolites, fecal scores, and digestion. While in vitro and standardized digestibility assays are able to predict differences in substrate composition and degree of processing, these differences frequently lack translation to clinically meaningful differences in pet digestibility when protein sources are incorporated into a complete and balanced diet.
The safety of human-grade ingredients could not be properly assessed with only two studies provided by the search criteria. A study by Spears and colleagues (2017) aimed to assess the chromium concentration of feed-grade ingredients such as corn, wheat, soybean meal, beet pulp, phosphates, and alfalfa hay [153]. The findings revealed chromium amounts that meet FDA 1.0 mg/kg limit compliance for 4/6 ingredients, while beet pulp amounts were at 122% of the FDA limit (1.222 mg/kg) and phosphates at 135% of the FDA limit (1.35 mg/kg) [153]. This represents a potential for risk in pets and warrants further studies to confirm it. A limitation of this study was the lack of human-grade comparisons which could have provided a perspective on the safety differences. The study by Tripathi et al. (2007) analyzed increasing feed-grade wheat concentrations and the association with Aflatoxin B1, a mycotoxin which is extremely harmful to pets [154]. This study included human-grade corn for comparison, containing 0 ppb of Aflatoxin B1. As wheat inclusion increased, the Aflatoxin B1 concentration increased linearly, with 100% wheat reaching 117.5% of the FDA limit (20 ppb/kg) [146]. While this result is indicative of harm, the 100% wheat recipe was not representative of inclusion levels found in typical pet food diets and should be interpreted with caution. The FDA establishes mycotoxin action levels for finished pet food (20 ppb/kg) with the Food Safety Modernization Act (FSMA), mandating preventative control to reduce this risk from occurring. The findings from this study should be confirmed by follow-up studies with more comparisons between human-grade and potentially commercial pet food diets to elucidate the true risk.
Feed-grade ingredients may contain a higher risk of having Biogenic Amines (BA), toxic byproducts of spoilage and bacterial contamination in meat products. A study by Montiegrove et al. (2023) found that higher inclusions of chicken meat meals resulted in linear increases to BA content, with large differences between fresh meat and meat meals [191]. This represents a potential risk in commercial pet foods which commonly utilize meat meals. Pinto et al. (2023) found similar results when studying hydrolyzed chicken liver and chicken byproduct meal, with the chicken meal diet containing 11.5× the BA content compared to the hydrolyzed liver diet [192]. These studies pinpoint an underlying risk to feed-grade meat meals that warrants further examination.
7.3. Interpretation of Whole vs. Processed Ingredient Results
7.3.1. Effects of Processing on Digestibility
The impact of processing on digestibility is far overshadowed by the focus on nutritional content. Digestion is critical for pet health as undigested nutrients cannot be utilized by the body, creating deficiencies and contributing to negative health outcomes [193,194]. This study aimed to uncover those impacts while establishing a general effect direction. The random-effects meta-analysis found statistical significance in the positive impacts of processing on digestion (SMD = 1.971, 95% CI: 0.567, 3.374, p = 0.005). The largest contributors to the benefits of processing included ingredient type and processing method, both explaining the substantial heterogeneity between studies. The type of ingredient selected was the most crucial factor in determining digestibility outcomes as the effect sizes ranged from −4.477 to 8.419, meaning future studies may see large benefits or harms to digestibility. Similarly, the processing method of choice was responsible for large impacts on digestibility outcomes. The differences between methods are critical knowledge gaps that will need to be answered prior to substantiating claims around processing benefit or harm. Contrary to typical beliefs, these findings suggest that processing intensity is trivial when predicting digestibility outcomes (p = 0.562). As with nutrient content, formulators should prioritize method type and ingredient selection rather than how aggressively processing is applied. Future research can address this topic directly by measuring digestibility across multiple temperatures, durations, and pressures using the same ingredients and ratios of those ingredients.
7.3.2. Effects of Processing on Nutrient Content
As pets are viewed as members of the household, owners expect their food to be nutritious and support a long, healthy life. However, much of the nutritional aspects of pet food are not clear to consumers aside from claims made by companies they trust. Processing emerges as one of the aspects that consumers perceive as unhealthy or contributing to disease [185]. The results from this study do not prove this phenomenon to be true, with a variety of effects and levels of severity which are present when processing pet food ingredients. This study found that a statistically significant positive association exists within the 137 included comparisons (SMD = 1.405, 95% CI: 0.622–2.187, p < 0.001). This finding is accompanied by high levels of heterogeneity (I^2^ = 85.221%, Q(136) = 920.24, p < 0.001, τ^2^ = 5.732), necessitating subgroup analysis by moderators to understand the true effects of processing. One of the most meaningful findings included the impact of ingredient type on the processing effect direction (QM(24) = 6644.92, p < 0.001). This result indicates that processing is almost entirely dependent on the outcome being measured (protein quality, antioxidant activity, and fat content) and composition of the ingredients (macronutrients, micronutrients, and antinutrients). Processing method was found to be another significant factor in nutrient retention (QM(18) = 199.02, p < 0.001). Many studies assess the impact of processing intensity on the nutritional content of a diet but overlook the magnitude of the effect of the methods themselves [15,195,196]. Interestingly, the processing intensity was not a significant moderator of nutrient content (QM(1) = 0.34, p = 0.559). The processing method and ingredient type are vital factors in understanding whether effects are beneficial or harmful to pet food. Future research in this area should utilize identical processing conditions across multiple differing ingredients to understand their true differences. Likewise, testing should be conducted on identical finished products across multiple methods of processing to understand impacts on nutrient content. This evidence does not provide a definitive answer to the debate, instead serving as an indicator that more high-quality studies are needed.
7.4. Justification of Methodological Approach
Datasets for each of the analyses were plagued with high levels of heterogeneity due to study design differences, outcome measures, population, and intervention differences that could not be controlled. Likewise, controlling via sub-analyses presented another issue in which important studies would be excluded, changing the effect direction and not representing the overall effect in a comprehensive manner. This would have limited the ability to broadly answer each of the research questions posed.
In order to obtain an accurate representation of the true harm caused by additives and preservatives, a Bayesian risk difference meta-analysis with meta-regressions was selected to accurately display effect sizes without inflating results. This method demonstrated consistency with the rate of adverse events between treatment and control groups. The Peto meta-analytic method, paired with the Mantel–Haenszel weighting, provided a model-free assessment of observed heterogeneity. The high I^2^ was indicative of true heterogeneity between studies, motivating investigation of moderating factors and necessitating random-effects modeling rather than relying on the pooled estimate alone.
Random-effects meta-analysis using Standard Mean Difference was selected to assess the impact of processing on nutrient retention and digestion. This methodology was able to handle the inherent heterogeneity expected across diverse ingredient types, processing methods (extrusion, wet roasting, germination, and thermal treatment), processing intensities, analytical procedures, and study designs. These random-effects models are preferred when studies contain different underlying effects that form a distribution around the pooled effect, which is more accurate than assuming one single effect estimate to represent the dataset. Since the majority of studies reported mean outcomes per ingredient and processing method, SMD was utilized to align all studies under a singular measure, allowing us to classify changes as beneficial, neutral, or harmful.
Similarly to the additive/preservative and processing studies, human-grade food assessments were scarce and extremely heterogeneous. However, the RoB presented more challenges in this dataset which could not be included in a meta-analysis as the results would be misleading and likely inaccurate. Further studies are needed to create a proper assessment. Instead, the discussion (Section 7.2) provided study-level insights that were not demonstrated via statistical methods.
Typical systematic reviews and meta-analyses are accompanied by a GRADE assessment, which establishes a quality of evidence using consistent methodologies. The authors chose to use aspects of the Cochrane GRADE assessment to assign a score to each study, allowing for exclusion prior to meta-analysis. This method better suited the high heterogeneity between studies and generalized research questions, while maintaining a rigorous analysis.
7.5. Limitations
The selected approaches were able to generate answers to each research question and deliver insights not previously covered in the available literature. However, there were many limitations that should be recognized prior to interpreting these findings as definitive.
The heterogeneity observed across studies was substantial, particularly in the processing analyses where I^2^ values exceeded 87% for both digestibility and nutrient content outcomes. While meta-regression identified ingredient type and processing method as significant moderators, considerable unexplained variance remained. This heterogeneity stemmed from differences in study designs, outcome measures, analytical methods, ingredient matrices, processing parameters, and population characteristics. The diversity of these factors limited the ability to isolate specific causal mechanisms and reduced the precision of pooled effect estimates.
The human-grade versus feed-grade ingredient analysis suffered from critical methodological constraints. Only six studies met inclusion criteria, and all nutritional comparison studies exhibited high risk of bias due to industry funding, lack of blinding protocols, and selective outcome reporting. More importantly, the compared diets were not formulated with identical ingredient profiles, nutrient compositions, or processing methods, confounding the attribution of observed differences to ingredient grade alone. The lack of standardized definitions for human-grade and feed-grade ingredients across studies further complicated comparisons and limited the generalizability of findings.
Publication bias was detected in the processing analyses, with funnel plot asymmetry tests indicating that smaller studies with null or negative findings may be underrepresented in the published literature. While fail-safe N analyses suggested robustness of the overall effect estimates, the systematic underreporting of non-significant results could inflate the perceived benefits of processing on digestibility and nutrient content. Similarly, conflicting results between asymmetry tests in the preservative analysis suggest potential selective publication patterns that require additional investigation.
The scope of this review was limited to English-language publications available in three major databases, potentially excluding relevant research published in other languages or less accessible journals. Similarly, the restriction to full-text articles may have omitted pertinent conference proceedings, gray literature, or ongoing studies that could inform the current understanding of fresh pet food claims.
The processing analyses focused mainly on individual ingredients rather than complete diets, limiting the direct applicability of findings to finished pet food products. The interactive effects of multiple ingredients, processing sequences, and formulation parameters in commercial pet foods may produce outcomes that differ substantially from those observed in this single-ingredient studies. Additionally, the classification of processing intensity into minimal, moderate, and intensive categories, while systematic, involved subjective judgments about threshold values and could not capture the full complexity of industrial processing protocols. Likewise, minimal processing was extremely underrepresented as a majority of studies did not include minimally processed variants for comparison.
These limitations collectively indicate that while this systematic review provides the most comprehensive synthesis of evidence currently available regarding fresh pet food claims, definitive conclusions remain constrained by the quality, quantity, and design of the underlying research base. Future investigations employing rigorous experimental designs, standardized outcome measures, adequate sample sizes, long-term follow-up periods, and transparent reporting practices are essential to substantiate or refute the marketing claims evaluated in this review.
8. Conclusions and Recommendations
8.1. Conclusions
Large improvements have been made to pet food to optimize the health of pets since the first commercial diets were produced in 1922 and 1956 [197]. The purpose of this systematic review was to establish a scientific consensus of fresh pet food claims and clearly identify research gaps for future studies to explore.
The analysis of 60 additive studies and 39 preservative studies using Bayesian meta-analysis revealed pooled risk differences of 0.0006 and 0.0003, respectively, with Bayes factors providing strong evidence for null hypotheses. The findings do not support claims that approved additives and preservatives cause harm when used within regulation-compliant levels. The adverse event rates between treatment and control groups were nearly identical, attributing the differences to normal biological variations rather than toxicity from ingredients. Meta-regressions found no significant moderation by species, study duration, quality grade, or risk of bias, further supporting the lack of true effects.
The analysis of the effect of processing on ingredients encompassed 102 digestibility comparisons and 137 nutrient comparisons, demonstrating significant pooled effects (SMD = 1.971 and SMD = 1.405, respectively). These estimates were plagued by extreme heterogeneity as ingredient type and processing method were found to be large contributors to the large effect size ranges. Ingredient type emerged as the most significant moderator of processing outcomes, with variations causing large fluctuations in outcomes. Likewise, processing methods were significant moderators of both digestion and nutrient content. Processing intensity showed no significant moderation of outcomes. These findings indicate that processing effects are highly context-dependent and cannot be generalized across all ingredients or pet food formulations.
The human-grade versus feed-grade ingredient comparison yielded only six eligible studies, all of which exhibited methodological limitations that prevented definitive conclusions. The nutritional comparison studies showed high risk of bias due to industry funding, absence of blinding protocols, and non-identical formulation parameters between compared diets. The confounding of ingredient grade with differences in nutrient profiles, ingredient compositions, and processing methods made it impossible to isolate the specific effects of ingredient grade on pet health outcomes. While safety assessments suggested that feed-grade ingredients may contain higher contaminant levels, the limited sample size and lack of standardized definitions for human-grade and feed-grade ingredients across studies constrained the generalizability of these findings.
Overall, current scientific evidence does not substantiate the widespread marketing claims that additives and preservatives are harmful to companion animals when used within regulatory guidelines. In the context of whole and processed ingredients, the evidence found in this study does not support this claim and varies substantially by ingredient type and processing method. The superiority of human-grade ingredients over feed-grade ingredients remains inadequately investigated, with existing studies confounded by multiple variables that prevent causal attribution.
8.2. Recommendations
8.2.1. Industry Professionals and Pet Food Manufacturers
Pet food companies should ensure that all marketing claims are backed with accessible and peer-reviewed scientific evidence before conveying them to consumers, allowing for informed decisions to be made. Minimally processed diets should be assessed against identical ingredient matrices or similar formulations to draw more conclusive evidence. Likewise, these studies necessitate larger sample sizes to sufficiently power the analytical tests to statistical significance. Comprehensive prospective studies are needed to establish whether processing intensity causally affects long-term health outcomes in companion animals across their lifespan, employing standardized outcome measures and controlling for ingredient composition, nutritional intake, and variability between pets.
8.2.2. Regulatory Agencies
The FDA and FTC should establish clear guidelines for the use of marketing terms such as “fresh,” “human-grade,” “whole ingredients,” and “minimally processed” to prevent misleading claims that lack standardized definitions. Enforcement actions should target companies making unsubstantiated health claims or employing fear-based marketing strategies that disparage safe and approved ingredients without scientific justification.
8.2.3. Veterinary Professionals
Veterinarians should base dietary recommendations on peer-reviewed scientific evidence rather than paid sponsorships or marketing claims. This improves consumer trust in recommendations made by veterinary professionals while improving the lives of pets due to optimization of diet. Dietary counseling should emphasize the quality of ingredients and processing methods rather than the degree of processing that took place during manufacturing. Furthermore, veterinary professionals should inform consumers of risks to feeding homecooked diets and the need for complete and balanced nutrient profiles which are regulated by regulatory agencies.
The reference list from the paper itself. Each links out to its DOI / PubMed record.
- 1Pet Food Market Size, Share & Industry Analysis by Animal Type (Dogs, Cats, and Others), By Form (Dry Pet Food, Wet Pet Food, and Snacks & Treats), by Distribution Channel (Supermarket/Hypermarket, Specialty Stores, Online Channel, and Others), by Source (Animal and Plant), and Regional Forecast, 2025–2032. 2024. Fortune Business Insights Available online: https://www.fortunebusinessinsights.com/industry-reports/pet-food-market-100554(accessed on 23 October 2024)
- 2U.S. Fresh Pet Food Market Size, Share, and Growth Analysis, by Type (Dog Food, Cat Food), by Ingredient (Meat, Vegetables), by Distribution Channel—Industry Forecast 2025–2032. 2025. Sky Quest (Distributed via Global Information Inc.)Available online: https://www.giiresearch.com/report/sky 1664012-us-fresh-pet-food-market-size-share-growth.html?(accessed on 23 October 2024)
- 3Schleicher M. Cash S.B. Freeman L.M. Determinants of pet food purchasing decisions Can. Vet. J. (La Rev. Vet. Can.)201960644650 PMC 651581131156266 · pubmed ↗
- 4Lane M.M. Gamage E. Du S. Ashtree D.N. Mc Guinness A.J. Gauci S. Baker P. Lawrence M. Rebholz C.M. Srour B. Ultra-processed food exposure and adverse health outcomes: Umbrella review of epidemiological meta-analyses BMJ 2024384 e 07731010.1136/bmj-2023-07731038418082 PMC 10899807 · doi ↗ · pubmed ↗
- 5Liang S. Zhou Y. Zhang Q. Yu S. Wu S. Ultra-processed foods and risk of all-cause mortality: An updated systematic review and dose-response meta-analysis of prospective cohort studies Syst. Rev.2025145310.1186/s 13643-025-02800-840033461 PMC 11874696 · doi ↗ · pubmed ↗
- 6Liu X. Ultra-Processed Foods May Be Associated with Adverse Health Outcomes Proceedings of the ACC Asia 2025 Together with SCS 36th Annual Scientific Meeting Singapore 9–11 May 2025 Available online: https://www.acc.org/Latest-in-Cardiology/Articles/2025/05/13/10/05/Ultra-Processed-Foods-May-Be-Associated-With-Adverse-Health-Outcomes(accessed on 27 September 2025)
- 7Gantz A. Survey: Dog Owners Have Difficulty Choosing Pet Food. Petfood Industry 2015 Available online: https://www.petfoodindustry.com/pet-food-market/article/15461532/survey-dog-owners-have-difficulty-choosing-pet-food(accessed on 27 September 2025)
- 8Ollie Available online: https://www.myollie.com/(accessed on 24 October 2025)