Characterization of Korean Colorectal Cancer Reveals Novel Driver Gene and Clinically Relevant Mutations
Junho Kang, Dong Min Lim, Young‐Joon Kim, Hyeran Shim, Tae‐You Kim, Kyu Joo Park, Sung‐Bum Kang, Chang Sik Yu, Jong Lyul Lee, Yeuni Yu, Hansong Lee, Eun Jung Kwon, Hyo Min Kim, Seongik Mun, Donghee Kwak, Hae Seul Lee, Hye Jin Heo, Eun Kyoung Kim, Seung Eun Baek, Jong‐Wook Park

TL;DR
This study uses whole-genome sequencing of 197 Korean colorectal cancer samples to identify new driver genes and mutations linked to cancer recurrence and treatment response.
Contribution
The study identifies novel driver genes and clinically relevant mutations specific to Korean colorectal cancer patients.
Findings
Identified 78 potential driver genes, including CBWD5, LRRIQ3, TRIM64B, SPINK5, and ZNRF2 linked to recurrence.
Discovered 30 mutational hotspots, with significant variants in KRAS, MAP1A, and TP53.
Found a significant co-occurrence between KRAS 12 and PIK3CA 545 mutations.
Abstract
Colorectal cancer (CRC) ranks as the third leading cause of cancer‐related deaths worldwide, characterized by genomic heterogeneity arising from ethnic and interindividual differences. Producing region‐specific data to characterize ethnic‐specific somatic mutations is essential for advancing CRC research. Additionally, accurate somatic mutation detection requires paired tissue analyses to account for interindividual diversity. This study aims to highlight the importance of ethnic diversity in shaping CRC's genomic landscape and emphasize the necessity for region‐specific data to refine diagnostic and therapeutic approaches. This study emphasizes the need for region‐specific data by analyzing an unprecedented 197 paired samples from the Korean CRC cohort through whole‐genome sequencing. We identified 78 potential driver genes. Notably, CBWD5, LRRIQ3, TRIM64B, SPINK5, and ZNRF2 were…
Genes, proteins, chemicals, diseases, species, mutations and cell lines named across the full text — each resolved to its canonical identifier and authoritative record.
Click any figure to enlarge with its caption.
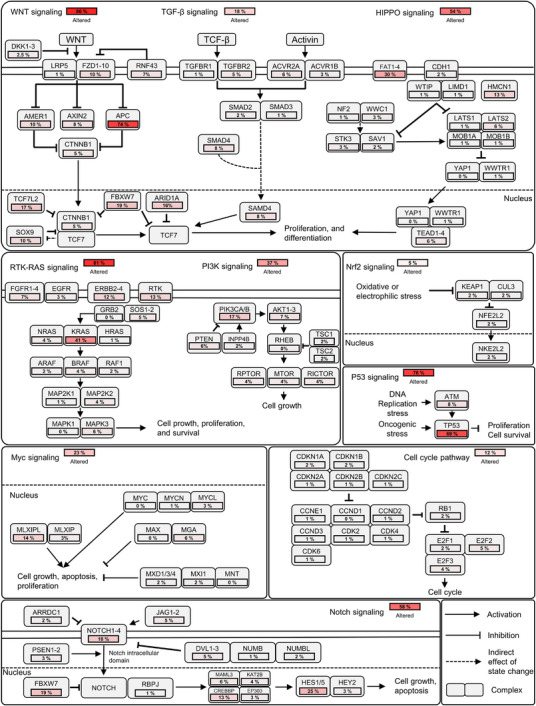 FIGURE 1
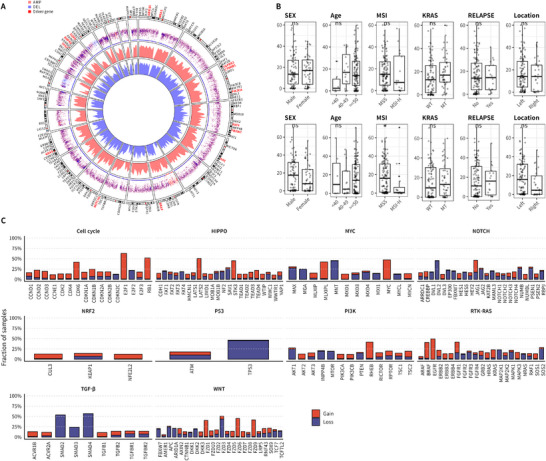 FIGURE 2
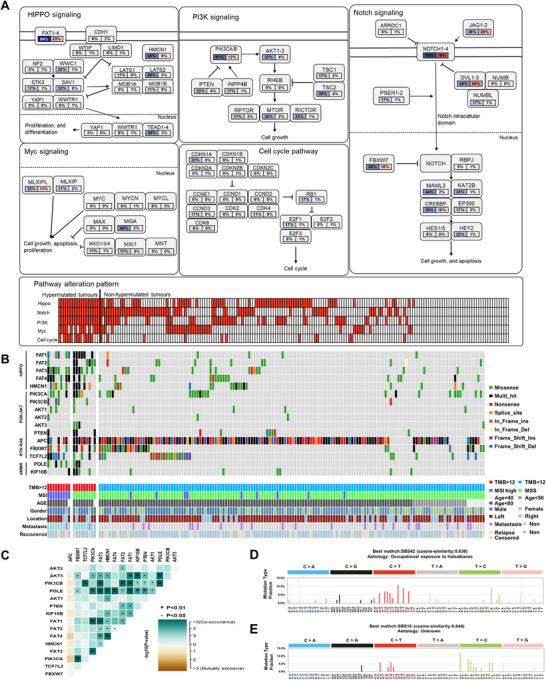 FIGURE 3
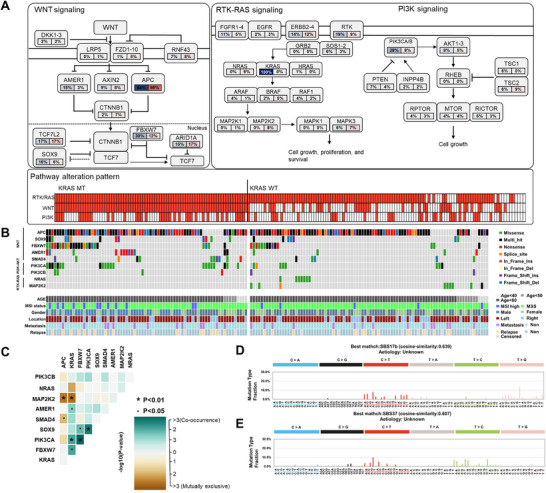 FIGURE 4
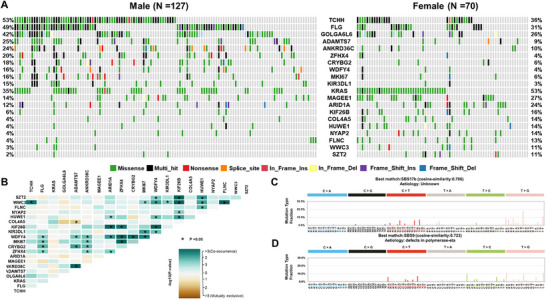 FIGURE 5
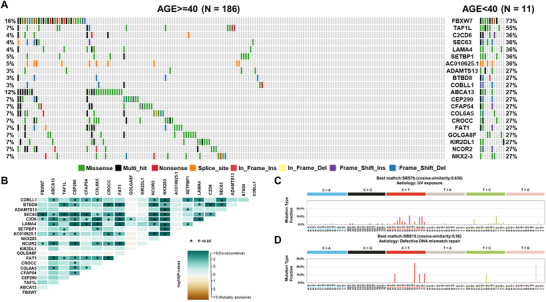 FIGURE 6
| Variable | HR1 | 95% CI2 |
|
|---|---|---|---|
|
| 4.978 | 1.21–20.56 | 0.0265* |
|
| 4.044 | 0.56–29.023 | 0.1647 |
|
| 46.200 | 4.93–433.30 | 0.0008*** |
|
| 13.080 | 2.43–70.30 | 0.0027** |
|
| 70.760 | 4.98–1004.67 | 0.0017** |
| Age | 0.983 | 0.94–1.03 | 0.4935 |
| Sex | |||
| Female | Reference | ||
| Male | 0.371 | 0.12–1.17 | 0.0914 |
| Disease stage | |||
| I | Reference | ||
| II | 3.00E+07 | 0 | 0.9992 |
| III | 1.44E+08 | 0 | 0.9991 |
| IV | 1.090 | 0 | 1.0000 |
| Hypermutation | |||
| Hyper | Reference | ||
| Non‐hyper | 8.000 | 0.32–197.35 | 0.2034 |
| MSI status | |||
| MSI high | Reference | ||
| MSI low | 4.13E−09 | 0 | 0.9986 |
| MSS | 0.340 | 0.015–7.69 | 0.4972 |
| Unknown | 2.07E−09 | 0 | 0.9996 |
| Variable |
| Mean (SD |
|---|---|---|
| Age (years) | 197 | 60.15 (12.03) |
|
| Percentage (%) | |
| Sex | 197 | |
| Female | 70 | 35.53 |
| Male | 127 | 64.47 |
| Location | 201 | |
| Ascending | 31 | 15.42 |
| Transverse | 11 | 5.47 |
| Descending | 14 | 6.97 |
| Sigmoid | 82 | 40.80 |
| Rectal | 41 | 20.40 |
| Rectosigmoid | 15 | 7.46 |
| Cecum | 6 | 2.99 |
| Other | 1 | 0.49 |
| Pathology | 197 | |
| Adenocarcinoma | 187 | 94.92 |
| mucinous carcinoma | 5 | 2.54 |
| Other | 5 | 2.54 |
| MSI status | 197 | |
| MSS | 172 | 87.31 |
| MSI‐low | 13 | 6.60 |
| MSI‐high | 11 | 5.58 |
| Unknown | 1 | 0.51 |
| Primary disease stage | 197 | |
| II‐A | 60 | 30.45 |
| II‐B | 10 | 5.08 |
| II‐C | 2 | 1.02 |
| III‐A | 4 | 2.03 |
| III‐B | 62 | 31.47 |
| III‐C | 15 | 7.61 |
| IV‐A | 16 | 8.12 |
| IV‐B | 8 | 4.06 |
| IV‐C | 10 | 5.08 |
| Unknown | 10 | 5.08 |
| Metastasis | 48 | |
| Liver | 19 | 39.59 |
| Lung | 10 | 20.83 |
| Lymph node | 7 | 14.58 |
| Bone | 1 | 2.08 |
| Peritoneal | 9 | 18.75 |
| Brain | 0 | 0 |
| Other | 2 | 4.17 |
| Adjuvant chemotherapy | 197 | |
| No | 52 | 26.40 |
| Yes | 126 | 63.96 |
| Unknown | 19 | 9.64 |
| Adjuvant regimen | 122 | |
| FL | 5 | 4.10 |
| xeloda | 8 | 6.56 |
| FOLFOX | 61 | 50.00 |
| XELOX | 48 | 39.34 |
| Preoperative radio | 178 | |
| No | 175 | 98.31 |
| Yes | 3 | 1.69 |
| Postoperative radio | 178 | |
| No | 173 | 97.19 |
| Yes | 5 | 2.81 |
| Relapse | 197 | |
| No | 145 | 73.60 |
| Yes | 18 | 9.14 |
| Unknown | 34 | 17.26 |
| Death | 196 | |
| No | 192 | 97.96 |
| Yes | 4 | 2.04 |
- —the National Research Foundation of Korea, funded by the Korea government (MSIT)
- —the National Research Foundation of Korea, funded bythe Ministry of Education
- —the Korea Health Technology R&D Project through the Korea Health Industry Development Institute (KHIDI), funded by the Ministry of Health & Welfare, Republic of Korea
- —the Bio & Medical Technology Development Program of the National Research Foundation of Korea (NRF), funded by the Ministry of Health and Welfare, Ministry of Science and ICT, Ministry of Trade Indust
- —KREONET
Peer Reviews
No public reviews on file for this paper yet. If you reviewed it on a platform where reviews are public (OpenReview, ICLR, NeurIPS, ICML), you can paste yours below so the community can read it here.
Videos
No videos yet. Explain this paper in a talk, walkthrough, or lecture? Add one.
Taxonomy
TopicsCancer Genomics and Diagnostics · Colorectal Cancer Treatments and Studies · Genetic factors in colorectal cancer
Introduction
1
Colorectal cancer (CRC) is the third most common cancer and the third leading cause of cancer deaths worldwide [1]. Despite significant advancements in therapeutic strategies, including targeted agents and immunotherapies, a comprehensive understanding of the mechanisms underlying colorectal carcinogenesis and therapeutic resistance remains insufficient. The 5‐year survival rate drops markedly in patients with advanced‐stage disease, primarily due to tumor heterogeneity, late detection, and limited treatment response [2]. Recent progress in both primary and adjuvant therapies has led to gradual improvements in CRC survival outcomes. In clinical settings, the fundamental goal of treatment is complete removal of the primary tumor and metastatic lesions, which typically necessitates surgical resection [3]. However, despite the implementation of large‐scale screening programs intended to lower CRC incidence and detect early‐stage disease, approximately 25% of patients are still diagnosed with distant metastases, and an additional 20% of initially localized cases eventually develop metachronous metastases [4, 5, 6, 7]. These conditions significantly hinder curative surgical management and contribute to high mortality rates. For patients with unresectable tumors or those who are not candidates for surgery, the treatment objective shifts toward maximal tumor shrinkage and suppression of disease progression. In such cases, radiotherapy and systemic chemotherapy remain the primary therapeutic modalities. Moreover, in selected patients, these treatments may be applied in a neoadjuvant or adjuvant setting to facilitate surgical resection and reduce the likelihood of recurrence by eliminating micrometastatic disease or stabilizing the tumor burden [8, 9, 10, 11].
Given the considerable heterogeneity among CRC cases and the variability in treatment responses, there is a critical need for improved patient stratification and personalized therapeutic strategies. The continuous advancement of next‐generation sequencing technologies has propelled the era of precision oncology [12]. For example, in non‐small cell lung cancer, whole‐exome sequencing (WES) has enabled the identification of clinically actionable gene amplifications such as ERBB2 and MET [13]. Similarly, comprehensive genomic sequencing studies in high‐grade serous ovarian and prostate cancers have elucidated key resistance mechanisms—including BRCA1/2 reversion mutations and MDR1 overexpression in ovarian cancer, as well as a long tail of statistically significant mutations in prostate cancer—underscoring the utility of large‐scale genomic profiling in uncovering therapeutic vulnerabilities and enhancing my understanding of tumor evolution [14, 15].
Among these advancements, identifying somatic mutations in CRC holds significant potential for characterizing individual tumor profiles and informing diagnostic and therapeutic strategies [2]. However, previous genomic studies of Korean CRC have been conducted on WES cohorts with low sample sizes, which has constrained comprehensive variant detection and the accurate characterization of somatic mutations in this population [16, 17]. Precision oncology—which depends on accurate diagnosis and personalized treatment—is enabled by the reliable identification of somatic mutation signatures through tumor–normal paired sequencing, which helps reduce false‐positive somatic calls [18]. Therefore, it is essential to recognize two critical aspects within the field of CRC genome research. First, the existence of interethnic somatic mutation disparities, which extend beyond CRC to encompass various cancer types, emphasizes the necessity for studies on interethnic diversity. Second, the interindividual diversity among human populations emphasizes the imperative for paired tissue analyses to enhance the reliability of somatic mutation detection [19, 20, 21]. In the pursuit of precision oncology, it is imperative to address racial and ethnic disparities. Recent studies have highlighted molecular discrepancies in early‐onset CRC (EOCRC) across racial/ethnic and sex lines. Consequently, comprehending the disparities among racial and ethnic groups is invaluable, particularly in the context of precision medicine research. This highlights the importance of understanding population cohorts for collecting biological and biomarker data applicable to broader cancer populations [22, 23, 24, 25].
Driver mutations are causally involved in the tumorigenic process and are positively selected during tumorigenesis. However, a single gene defect does not “cause” cancer. It is becoming increasingly clear that pathways govern the tumorigenic process. Therefore, mutations in any one of several genes in a single pathway can result in an equivalent increase in net cell proliferation. Consequently, genes within a particular pathway may mutate more frequently than predicted by chance [26, 27, 28].
We analyzed 197 paired whole‐genome sequencing (WGS) samples from a Korean CRC cohort to identify somatic mutations confidently and explore interindividual differences. We aimed to uncover novel driver genes and mutational hotspots linked to CRC patient outcomes and characterize the mutational landscape related to key clinical features such as age, sex, tumor location, microsatellite instability (MSI), recurrence, and metastasis. Our findings elucidate specific pathways affected by these mutations, offering insights into oncogenic pathways and unique mutations in CRC across ethnic and individual diversity.
Results
2
Driver Genes and Hotspot Variants Are Associated With CRC Relapse
2.1
Tumor prognosis and treatment efficacy prediction rely significantly on the identification of driver genes and mutational hotspots. We identified a total of 78 driver genes, which include well‐known genes such as TP53, KRAS, and APC, previously established as driver gene in CRC (Table S1). Subsequently, we identified recurrent variants at specific loci within genes, defining them as hotspots. Our findings revealed that mutations at the KRAS 12 codon were observed in 49 out of 197 cases (29%, including G12D‐29pts, G12V‐16pts, G12A‐4pts), followed by MAP1A mutations in 24 out of 197 cases (12%, V2300G), and TP53 mutations in 16 out of 197 cases (8%, R175H), showing high frequencies at single positions (Table S2). We evaluated selected driver genes for their association with outcomes using a Cox proportional hazard model to investigate the impact of various variables on disease‐free survival (DFS). Specifically, we examined the influence of the following factors: CBWD5 (HR: 4.978; CI: 1.21–20.56; p value: 0.0265*), LRRIQ3 (HR: 4.044; CI: 0.56–29.023; p value: 0.1647), TRIM64B (HR: 46.200; CI: 4.93–433.30; p value: 0.0008***), SPINK5 (HR: 13.0810; CI: 2.43‐70.30; p value: 0.0027*), ZNRF2 (HR: 70.760; CI: 4.98–1004.67; p value: 0.0017**), age, sex, disease stage, hypermutation status, and MSI status. By integrating these factors into our analysis, our objective was to clarify their individual and collective associations with patient DFS in our cohort (Tables 1 and S3).
Somatic Mutation Landscape of CRC
2.2
We characterized the somatic variants in Korean CRC patients. Single nucleotide variants (SNVs) were the most prevalent mutation type, followed by small deletions (DELs) and insertions (INSs). C>T transitions were the most frequent base substitution, and missense mutations constituted the predominant functional class. Frequently mutated genes included TTN, APC, and PABPC1 (Figure S1A–E). We then compared the tumor mutational burden (TMB) distribution between the Korean CRC cohort and 33 The Cancer Genome Atlas (TCGA) cancer types. Cancer types were ordered by increasing median TMB. The TMB levels in Korean CRC were comparable to those observed in TCGA‐CRC (COAD and READ), placing Korean CRC among the cancer types with relatively high TMB (Figure S1F). For assessing oncogenic pathway alterations, we focused on 10 pathways with known frequent genetic changes. Within these, we depicted genes with higher alteration frequencies in our cohort of 197 Korean CRC patients and calculated the proportion with at least one alteration in these genes. High alteration rates were observed in the WNT (86%), RTK–RAS (81%), P53 (76%), NOTCH (58%), HIPPO (54%), and PI3K–AKT (37%) pathways. The remaining pathways had lower alteration rates: MYC (23%), TGF‐beta (18%), cell cycle (12%), and NRF2 (5%). Within the 10 oncogenic pathways in our cohort, key genes with significant mutations were APC (74%), TP53 (69%), KRAS (41%), and FBXW7 (19%), in that order (Figure 1). To investigate ethnic‐specific differences in oncogenic signaling, we compared the mutational profiles of oncogenic pathways between the Korean CRC cohort and the TCGA‐CRC cohort [29]. Representative oncogenes and tumor suppressor genes within each pathway were assessed to enable an integrative interpretation of interethnic variation. As shown in Figure S1G, the Korean CRC cohort exhibited significantly higher mutation frequencies in the HIPPO (p value: <0.0001****), Notch (p value: <0.0001****), and Nrf2 (p value: 0.0044**) pathways compared with TCGA‐CRC. In contrast, the TCGA‐CRC cohort showed significantly higher mutation frequencies in the cell cycle (p value: <0.0001****) and TGF‐β (p value: 0.0035**) signaling pathways. No significant differences were observed between the two cohorts in the Myc (p value: 1.0000), PI3K (p value: 0.3960), RTK–RAS (p value: 0.0615), P53 (p value: 0.1270), and WNT (p value: 0.0598) pathways. We next examined gene‐level alterations to identify population‐specific differences and to evaluate the mutational status of established CRC driver genes (Figure S1H). Among genes with notable inter‐cohort differences, CDKN2A, a tumor suppressor gene involved in the cell cycle pathway, was mutated in 32% of TCGA‐CRC cases but was infrequently altered in the Korean CRC cohort (1%). In contrast, RPTOR, an oncogenic component of the PI3K–mTOR pathway, exhibited a higher mutation frequency in Korean CRC (13%) compared with TCGA‐CRC (1%), suggesting potential cohort‐specific activation of this signaling axis. Within the HIPPO pathway, FAT1, a tumor suppressor gene involved in maintaining epithelial architecture and suppressing tumor progression, was more frequently mutated in TCGA‐CRC (30%) than in Korean CRC (14%). In the MYC regulatory network, MGA, a negative regulator of MYC transcriptional activity, showed a higher alteration frequency in TCGA‐CRC (18%) compared with Korean CRC (6%). With respect to well‐established driver genes, TP53 and APC—two of the most frequently mutated tumor suppressors in CRC—exhibited consistently high mutation frequencies in both cohorts, highlighting their conserved roles in CRC pathogenesis regardless of ethnicity. To assess large‐scale genetic variations, we performed copy number variation (CNV) analysis on 197 Korean CRC patients. CNV analysis revealed significant amplifications in key oncogenes, including KRAS, MYC, and PIK3CA, which are known to play crucial roles in CRC progression (Figure 2A). These findings support the involvement of KRAS, MYC, and PIK3CA in tumorigenesis, particularly through pathway‐specific amplifications that drive tumor growth and survival. We then examined the relationship between CNVs and clinical variables. Our results showed that DELs were significantly more frequent in the microsatellite stable (MSS) group compared with the MSI‐high (MSI‐H) group, with CNVs observed only in the MSI status, indicating that CNVs were specifically associated with MSI status (Figure 2B). In the context of oncogenic pathways, we observed significant CNVs in several pathways. Notably, WNT, RTK–RAS, and PI3K–AKT pathways exhibited high frequencies of gain mutations, while TGF‐β and cell cycle pathways showed relatively lower alteration rates (Figure 2C). These findings suggest that pathway‐specific CNVs may contribute to the molecular heterogeneity of CRC and play a significant role in its progression. Among the most frequently altered genes in these pathways, TP53, APC, and FBXW7 exhibited significant DEL frequencies, highlighting their roles as key tumor suppressors in CRC.
Alterations in 10 oncogenic pathways of CRC in 197 Koreans. Each pathway diagram shows the proportion of patients harboring mutations in the indicated genes, with red shading representing higher mutation frequencies. Percentages beside each pathway denote the proportion of patients with at least one mutation in that pathway. Solid and dotted lines indicate the cell and nuclear membranes, respectively; arrows indicate activation, bars indicate inhibition, and dotted arrows denote indirect regulatory effects.
Somatic CNVs in Korean CRC patients. (A) Circos plot showing genome‐wide CNV patterns. The outermost ring represents chromosomes; red and blue dots indicate amplification and deletion degrees, respectively. Inner heatmaps display amplification in red and deletion in blue, with red‐labeled genes showing the highest CNV levels. (B) Boxplots showing CNV frequencies across clinical variables: sex, age, MSI status, KRAS mutation, relapse status, and tumor location. Gains (upper, red) and losses (lower, blue) are indicated. (C) CNV distribution across 10 oncogenic pathways. Red and blue bars represent gain and loss frequencies in key genes of major signaling pathways.
Hypermutation Characterizes a Unique Mutational and Pathway Profile in CRC
2.3
Hypermutation and MSI are important factors in predicting prognosis and making treatment decisions in CRC. It is known that hypermutated CRCs account for approximately 15–20% of cases, and the causes are often related to MSI, deficient mismatch repair (dMMR), apolipoprotein B mRNA editing enzyme, catalytic polypeptide, POLE, and other factors [30]. To evaluate the cause of significant differences in mutation rates, we defined and evaluated hypermutation as TMB > 12 and found that 18 out of 197 cases (9%) were hypermutated, with a median TMB of 34.2. Differences were observed in the HIPPO, PI3K–AKT, NOTCH, MYC, and cell cycle pathways between the two groups (Figure 3A). We also evaluated genes within each pathway that showed significant differences between the two groups. These genes included FAT1‐4, HMCN1, PIK3CA, PIK3CB, AKT1‐3, PTEN, and APC, all of which were found to co‐occur, except for APC (Figure 3B,C). In the mutational signature analysis of the two groups, single base substitution (SBS) 42 and SBS9 were the most similar signature patterns in the hypermutated group, with cosine similarities of 0.636 and 0.552, respectively, while SBS9 and SBS16 were the most similar signature patterns in the nonhypermutated group, with cosine similarities of 0.516 and 0.644, respectively (Figure 3D,E). The list of mutations associated with MSS hypo mutated CRC appears in Table S4. Previous studies have reported a correlation between the POLE P286R mutation and hypermutation (TMB > 100), and our study also showed that all three cases with the POLE P286R mutation had TMB > 100 [31]. Interestingly, our study found that the KIF16B R145Q mutation significantly co‐occurred with the POLE P286R mutation and was found only in the three cases with the POLE P286R mutation.
Characteristics of somatic mutations in hypermutated and nonhypermutated CRC. (A) Pathway diagrams showing mutation frequencies in individual genes. Red indicates a higher proportion of mutated patients; solid and dotted lines represent the cell and nuclear membranes, respectively. Arrows indicate activation, bars indicate inhibition, and dotted arrows denote indirect effects. Each cell represents one patient, and red shading indicates at least one alteration in the pathway. (B) Oncoplot of somatic mutations by group. Genes are ordered by pathway (Hippo, PI3K–AKT, RTK–RAS, and dMMR‐related genes). Mutation types are color coded, and corresponding clinical characteristics (TMB, MSI status, age, sex, tumor location, metastasis, relapse) are shown below. (C) Somatic interactions between genes. Cyan indicates co‐occurrence, and brown indicates mutual exclusivity. (D) Mutational signatures identified in the hypermutated group. The Y‐axis shows the fraction of mutation types, and the X‐axis indicates 96 base substitutions. (E) Mutational signatures identified in the nonhypermutated group. The Y‐axis shows the fraction of mutation types, and the X‐axis indicates 96 base substitutions.
KRAS‐Mutant CRCs Exhibit Pronounced Co‐alteration Patterns
2.4
KRAS mutations are very common in CRC, particularly at codons 12, 13, and 61 of the KRAS gene [32]. In our study of 197 Korean CRC patients, 41% had KRAS mutations, primarily at codons 12, 13, and 61, with codon 12 being most frequent. Some patients also had mutations at codons 146 and 117, and one patient had multiple mutations. Comparing patients with and without KRAS mutations, significant differences were found in oncogenic pathways like WNT, RTK–RAS, and PI3K–AKT, involving key genes APC, SOX9, FBXW7, AMER1, SMAD4, PIK3CA, PIK3CB, NRAS, and MAP2K2 (Figure 4A,B). Additionally, most of the genes showed co‐occurrence, while KRAS and NRAS, MAP2K2 were mutually exclusive (Figure 4C). The KRAS group and the non‐KRAS group were most similar to SBS17b (cosine similarity 0.639) and SBS37 (cosine similarity 0.67), respectively (Figure 4D,E). The PIK3CA codon 545 mutation is the most common mutation in PIK3CA, and out of the 22 patients with this mutation, 21 also had KRAS codon 12 mutations.
Somatic mutational characteristics of KRAS‐mutated and non‐KRAS CRCs. (A) Pathway diagrams illustrating mutation frequencies in individual genes. Red shading indicates a higher proportion of patients with mutations. Solid and dotted lines represent the cell and nuclear membranes, respectively; arrows indicate activation, bars indicate inhibition, and dotted arrows denote indirect effects. Each cell represents one patient, and red indicates the presence of at least one alteration in the pathway. (B) Oncoplot showing somatic mutation profiles for each group. Genes are ordered by pathway: WNT, PI3K–AKT, and RTK–RAS. Mutation types are color coded, and the lower panel displays clinical characteristics, including age, MSI status, sex, tumor location, metastasis, and relapse status. (C) Somatic interaction matrix of recurrently altered genes. Cyan indicates co‐occurrence, whereas brown indicates mutual exclusivity. (D) Mutational signatures identified in the KRAS‐mutated CRC group. The Y‐axis shows the fraction of mutation types, and the X‐axis represents 96 base substitution contexts. (E) Mutational signatures identified in the non‐KRAS CRC group. The Y‐axis shows the fraction of mutation types, and the X‐axis represents 96 base substitution contexts.
Clinical Features Define Distinct Mutational Landscapes in CRC
2.5
We explored mutation differences by sex, location of onset, and age in 197 CRC patients. The specific mutations corresponding to each clinical feature are listed in Table S5. Females exhibited higher frequencies of mutations in KRAS (53 vs. 35%, p value = 0.004**), MAGEE1 (27 vs. 14%, p value = 0.01*), ARID1A (24 vs. 12%, p value = 0.01*), HUWE1 (14 vs. 4%, p = 0.001***), and WWC3 (11 vs. 3%, p value = 0.02*) compared with males (Figure 5A). Moreover, most of the genes showed co‐occurrence, and in males, SBS17b (cosine similarity 0.706) and SBS9 (cosine similarity 0.723) were the most similar mutational signatures (Figure 5B–D). The top five oncogenic pathways that exhibited significant differences in mutation rates between sexes are shown in Figure S2. Left‐sided CRC had higher prevalence of TP53 (75 vs. 49%, p value = 0.008**) and APC (79 vs. 57%, p value = 0.004**) mutations compared with right‐sided CRC. TP53 mutations were mutually exclusive with other genes in left‐sided CRC, while genes in right‐sided CRC tended to co‐occur. Left‐sided CRC resembled SBS5 (cosine similarity 0.615), whereas right‐sided CRC resembled SBS15 (cosine similarity 0.612). Right‐sided CRC also showed higher POLE gene mutation frequency and average TMB (Figure S3). Significant differences in mutation rates by cancer site are depicted in Figure S4. Age‐related differences were most pronounced in patients under 40 years old, with diminishing prominence as age increased. In patients under 40 years old, FBXW7 (73%), TAF1L (55%), and C2CD6 (36%) exhibited higher mutation rates compared with those over 40 years old (Figure 6A), and most of these genes tended to co‐occur (Figure 6B). SBS7b (cosine similarity 0.636) and SBS15 (cosine similarity 0.56) were the most similar mutational signatures in patients under 40 and over 40 years old, respectively (Figures 6C,D and S5). In patients under 50 years old, FBXW7 (32%), NBPF1 (35%), and BSN (38%) exhibited high mutation rates. These genes tended to co‐occur, though less prominently compared with patients under 40 years old. The most similar mutational signatures were SBS17b (cosine similarity 0.748) for patients under 50 years of age and SBS1 (cosine similarity 0.53) for those over 50 years of age (Figures S6 and S7). We analyzed mutation patterns in 197 patients based on recurrence and metastasis. Recurrence (18 patients) showed mutations in APC (72%), TP53 (67%), and KRAS (44%). Nonrecurrence (145 patients) had APC (77%), TP53 (68%), and KRAS (41%) mutations. Metastasis (34 patients) displayed high mutation rates in TP53 (77%), APC (63%), and KRAS (54%), with specific mutations in MUC17, SALL2, and CELA3A, particularly in liver metastasis cases (Figures S8 and S9).
Sex‐based landscape of somatic mutations in CRC patients: comparison of 127 males versus 70 females. (A) The oncoplot depicts the top 10 most frequent variant genes in each group. Each color is indicated according to the mutation type. (B) Somatic interactions between groups. Mutually exclusive or co‐occurring sets of genes were detected using a pairwise Fisher's exact test to detect significant gene pairs. (C) Mutational signatures plots known as SBS in 127 male patients with CRC. (D) Mutational signatures plots known as SBS in 70 female patients with CRC.
Early‐onset‐based landscape of somatic mutations in CRC patients: comparison of 186 over 40 years old versus 11 under 40 years old. (A) The oncoplot depicts the top 10 most frequent variant genes in each group. Each color is indicated according to the mutation type. (B) Somatic interactions between groups. Mutually exclusive or co‐occurring sets of genes were detected using a pairwise Fisher's exact test to detect significant gene pairs. (C) Mutational signatures plots known as SBS in 186 patients with CRC over 40 years old. (D) Mutational signatures plots known as SBS in 11 patients with CRC under 40 years old.
Discussion
3
CRC exhibits substantial genomic heterogeneity, comprising a few recurrent driver mutations and a wide spectrum of low‐frequency alterations [33]. Landmark genomic studies such as those from TCGA and the International Cancer Genome Consortium have delineated key hallmarks of CRC, including recurrent mutations in APC, TP53, and KRAS, while underscoring significant inter‐patient variability [31]. However, these datasets are predominantly based on individuals of European ancestry, and genomic data from East Asian populations remain underrepresented. Prior studies have highlighted clinical and molecular discrepancies between Western and East Asian CRC patients—including differences in mutation frequencies, MSI‐H prevalence, and treatment responses—emphasizing the necessity for population‐specific genomic analyses [33, 34]. Moreover, genetic background, lifestyle factors, and epigenetic modifications vary across populations and interact in complex ways to influence cancer development. These population‐specific differences underscore the need for stratified genomic analyses, particularly in underrepresented groups such as East Asians, to elucidate tumorigenic mechanisms and inform the development of precision oncology strategies [35, 36, 37]. In this context, we performed WGS of 197 paired Korean CRC samples, identifying mutation frequencies of APC (89%), TP53 (68%), and KRAS (41%), consistent with global CRC profiles. Notably, our WGS approach revealed a set of previously unreported and potentially recurrently mutated genes, including MAP1A, GOLGA6L6, CBWD5, LRRIO3, TRIM64B, SPINK5, and ZNRF2, which were absent in TCGA‐COAD/READ and prior Korean WES studies. These findings highlight the unique value of comprehensive WGS in uncovering rare variants and suggest novel avenues for understanding the broader genomic landscape of CRC within East Asian populations.
Recent studies have highlighted that hypermutation in CRC can arise through distinct mechanisms, most notably MSI and somatic mutations in the exonuclease domain of POLE [38, 39]. In our cohort, we identified 18 hypermutated cases based on a TMB of more than 12 mutations per megabase. Notably, three of these hypermutated cases were MSS tumors harboring the POLE P286R mutation, with each exhibiting an exceptionally high TMB exceeding 100 mutations per megabase. These findings are consistent with prior reports that POLE‐mutated MSS CRCs can display an ultramutated phenotype despite lacking dMMR [40, 41]. POLE encodes the catalytic subunit of DNA polymerase epsilon, which is crucial for high‐fidelity DNA replication. Mutations in its exonuclease domain impair proofreading activity and result in the accumulation of mutations. Although POLE mutations are relatively rare in CRC, occurring in about 1–2% of cases, their clinical significance is increasingly recognized [42]. Studies have demonstrated that POLE‐mutated MSS tumors exhibit distinct clinicopathologic features, such as strong CD8+ T cell infiltration and PD‐L1 expression, characteristics typically associated with MSI‐H tumors [43]. These observations suggest that POLE‐mutated MSS tumors may represent an immunologically active subset of CRC, potentially responsive to immune checkpoint inhibitors despite their MSS status. Our findings not only reaffirm the distinct nature of POLE‐mutated MSS CRCs within the hypermutated spectrum but also emphasize the importance of further stratifying hypermutated tumors beyond MSI status. Interestingly, we also observed the co‐occurrence of POLE P286R mutation and KIF16B R145Q mutation in three hypermutated MSS cases, a combination that has not been reported in prior studies. As the field of personalized immunotherapy progresses, comprehensive genomic profiling, including screening for POLE mutations and their co‐occurring mutations like KIF16B, should be integrated into CRC management, particularly for hypermutated MSS tumors with no other actionable alterations.
KRAS mutations, particularly at codon 12, are observed in approximately 40–50% of CRC patients and are widely recognized as a major mechanism of resistance to antiepidermal growth factor receptor therapies such as cetuximab and panitumumab [44]. However, recent studies have highlighted the substantial heterogeneity within KRAS‐mutant tumors, suggesting that the presence or absence of co‐occurring mutations can significantly influence tumor behavior, prognosis, and therapeutic response [45]. In our Korean CRC cohort, we identified a frequent co‐occurrence of KRAS mutations with alterations in PIK3CA, FBXW7, and AMER1, particularly among tumors harboring KRAS codon 12 mutations. Notably, PIK3CA mutations, especially at exon 9 (codon 545), were significantly enriched, consistent with previous reports that exon 9 mutations are more prevalent in East Asian populations, including Koreans, compared with exon 20 mutations, which are more frequent in Western cohorts [46]. While exon 20 mutations in PIK3CA have been linked to poor prognosis in chemotherapy‐refractory metastatic CRC, exon 9 mutations may have distinct functional and clinical implications, warranting further investigation [47]. FBXW7, a tumor suppressor gene involved in the proteasomal degradation of oncoproteins such as c‐Myc, was another gene frequently comutated with KRAS. Prior studies suggest that 80–86% of CRC cases with FBXW7 mutations also harbor KRAS mutations, and these comutated tumors tend to exhibit more aggressive phenotypes and poorer clinical outcomes. However, it is important to note that these findings are based on studies with relatively small sample sizes, which may limit the generalizability of this association. Further research with larger patient cohorts is needed to confirm these results and better understand the clinical significance of KRAS–FBXW7 comutation in CRC [48]. Similarly, AMER1, a negative regulator of the WNT pathway, was comutated in our KRAS‐mutant group. Emerging evidence indicates that KRAS–AMER1 comutation is associated with reduced progression‐free survival in metastatic CRC [49]. Interestingly, we also observed MAP2K2, a key component of the RAS/RAF/MEK/ERK signaling cascade, showing mutual exclusivity with KRAS mutations in our dataset. This finding is consistent with the concept of functional redundancy within the MAPK pathway, where KRAS activation might bypass the need for additional mutations downstream, potentially minimizing the selective advantage of MAP2K2 mutations.
The significance of gender differences in the incidence, prognosis, and treatment response of CRC has been recognized, but our understanding of the underlying causes for these differences is still limited. While several studies have identified clinical and molecular differences based on sex, sex is generally not considered when determining CRC treatment approaches [50]. The heterogeneity observed in previous research findings and a lack of understanding regarding the molecular differences related to sex contribute to the hesitation in considering sex in CRC treatment decisions. Therefore, it is crucial to enhance our understanding of the molecular differences between male and female cancers to guide personalized patient treatment. In our study, we observed a relatively similar trend in the landscape of somatic mutations in autosomal genes when comparing male and female CRC patients. An intriguing finding was that female CRC patients exhibited significantly more mutations in genes associated with the X chromosome. The human genome contains approximately 6% tumor suppressor genes, with around 2% located on the X chromosome, including well‐known mutations such as BRCA1 and BRCA2 [51]. This has led to ongoing efforts to enhance our understanding of mutations in X‐linked genes. Most X‐linked genes are present in a hemizygous state on the X chromosome, making them susceptible to single‐hit genetic inactivation [52]. Biallelic irregularities in genes involved in X chromosome inactivation, particularly escape genes, can increase the risk of cancers in females. Identifying biallelic genes that contribute to X chromosome inactivation is crucial for understanding how mutations in X‐linked genes contribute to cancer development [53]. In our study, we found that female CRC patients had a significantly higher number of mutations in X‐linked genes, including MAGEE1, WWC3, and HUWE1, compared with males, in addition to mutations in KRAS and ARID1A. Furthermore, MAGEE1 is frequently mutated and considered a candidate cancer gene in breast cancer, WWC3 has a high potential for complete or partial escape in ovarian cancer, and HUWE1 is known as a tumor suppressor gene [54]. Therefore, gaining a better understanding of gene mutations in X‐linked genes can provide valuable insights into the underlying causes of gender‐specific differences in CRC.
EOCRC, typically defined as CRC diagnosed before the age of 50 years, is characterized by more aggressive clinical behavior compared with its later‐onset counterparts. Patients with EOCRC often present with poor differentiation, lymphovascular invasion, and are diagnosed at more advanced stages, leading to a poorer prognosis [55]. Despite these aggressive clinical features, the molecular mechanisms underlying EOCRC remain incompletely understood, with MSI‐H and dMMR being common but not universal in these patients [56]. In our cohort, we found that FBXW7 mutations were significantly more prevalent in younger patients, particularly those under 40 years old. This finding aligns with previous studies suggesting that FBXW7 mutations may be a common feature of EOCRC, contributing to its aggressive nature [57]. FBXW7 functions as a tumor suppressor by targeting oncogenic substrates, such as c‐Myc and Notch, for degradation. The inactivation of FBXW7 may enhance the WNT/β‐catenin pathway, which is known to play a crucial role in tumor progression by promoting cell proliferation and survival [58]. Furthermore, we observed that SEC63, a gene involved in endoplasmic reticulum homeostasis and potentially in regulating WNT/β‐catenin signaling, was frequently comutated with FBXW7. SEC63 mutations have been previously implicated in EOCRC and may influence β‐catenin nuclear translocation under endoplasmic reticulum stress conditions [59]. The concurrent disruption of both FBXW7 and SEC63 in EOCRC could synergistically drive WNT pathway hyperactivation, contributing to the distinct molecular phenotype of these tumors. Emerging evidence from studies focusing on WNT/β‐catenin pathway activation in EOCRC suggests that this pathway plays a pivotal role in the disease's pathogenesis. For instance, recent studies have highlighted that WNT signaling is significantly more active in EOCRC compared with later‐onset CRC, further supporting the idea that WNT pathway hyperactivation contributes to the aggressive nature of EOCRC [60, 61]. These findings align with research suggesting that WNT/β‐catenin signaling is a major driver of tumor progression in younger CRC patients, emphasizing the unique molecular characteristics of EOCRC. Targeting WNT/β‐catenin signaling could provide a promising therapeutic approach for EOCRC, particularly for patients with FBXW7 and SEC63 mutations, which are associated with enhanced WNT pathway activation and contribute to the aggressive behavior of this disease.
Efforts are ongoing to identify the genetic causes underlying recurrence [62] and metastasis [63] in CRC. In this study, we identified frequent mutations in recurrent CRC patients. AMER1, a tumor suppressor gene involved in WNT pathway regulation, is frequently mutated in CRC [2]. Unlike in mesenchymal tumors, AMER1 mutations in epithelial lineages, including CRC, do not activate the WNT pathway. Mutations in the AMER1, EPHB6, FAM153A, and PCDH9 genes were observed more than four times in the recurrence group compared with the nonrecurrence group. In contrast, the TCAF2C, PCLO, and CES1 genes were only present in the nonrecurrence group. Among these genes, mutations in the PCLO gene have been reported in EOCRC, which occurs before the age of 50 years [64]. Therefore, further analysis is required to understand the relationship between these nonrecurrence‐related genes and CRC. Interestingly, contrary to previous studies [65], KRAS mutations were more frequently observed in the metastasis group of Korean CRC. Recent evidence suggests that KRAS mutations are strongly linked to the development of metastasis in specific sites, particularly the lung (62%; 31 out of 50) and brain (56.5%; 26 out of 46), among patients with CRC [66]. On the other hand, in Korean metastatic CRC, there was a similar high association with lung metastasis (31.6%; six out of 19), and no brain metastasis was observed, but there was a high association with liver metastasis (36.8%; seven out of 19). These results suggest a unique functional role of KRAS mutations in Korean metastatic CRC.
This study has several limitations. First, although our cohort represents one of the most comprehensive WGS analyses of Korean CRC patients, the overall sample size (n = 197) is relatively modest compared with large international consortia. This may limit the detection of rare mutational events or subtle subtype‐specific differences, reducing the generalizability of our findings to the broader CRC population. Second, clinical data such as treatment history, recurrence status, and long‐term survival outcomes were incomplete in some cases, constraining our ability to robustly correlate genomic alterations with clinical endpoints. Third, although several potentially novel recurrent mutations were identified, their functional roles in CRC progression remain to be validated through experimental or integrative multiomics approaches. Last, while comparisons with publicly available datasets were performed, direct validation in independent Korean cohorts is necessary to confirm the population‐specific relevance of our findings.
Conclusion
4
In this study, we performed WGS of 197 paired CRC and matched normal tissue samples from Korean patients, revealing a unique mutational landscape. While common driver mutations in APC, TP53, and KRAS aligned with Western cohorts, we identified novel recurrent mutations not previously reported in TCGA or East Asian datasets. Our findings highlight the molecular heterogeneity of KRAS‐mutant tumors, frequent co‐occurrence with PIK3CA and FBXW7 mutations, and age‐specific enrichment of FBXW7 in EOCRC. These results emphasize the importance of population‐specific genomic profiling for precision oncology. Future validation in independent cohorts and integration with clinical data are needed to translate these findings into therapeutic strategies.
Materials and Methods
5
Patients and Tissues
5.1
The clinical characteristics of our included cohort of 197 CRC patients are summarized in Table 2. The cohort comprised samples registered in the Clinical & Omics Data Archive (CODA) of the National Biobank of Korea. Fresh‐frozen tissues were obtained from surgically resected primary tumors of 197 patients with CRC who underwent curative surgery between September 1999 and August 2004. The exclusion criteria included inherited syndromes related to cancer and synchronous malignancies, as well as patients who were lost to follow‐up. These tissue specimens, along with patient clinical data, and records of clinicopathological features of the CRC were collected. The baseline clinicopathological characteristics and clinical outcome data were retrospectively collected from the CRC Database of the Department of Colorectal Cancer Surgery and the Pathological Diagnosis Database of the Department of Pathology. All available medical records related to CRC were reviewed to extract clinical information, including the American Joint Committee on Cancer primary tumor, lymph node, distant metastasis classification, the numbers of positive and negative lymph nodes harvested, tumor location, and cause of death in deceased individuals.
DNA Extraction and WGS
5.2
The tumor and matched normal fresh‐frozen tissues obtained from CRC patients were dissected for 20–40 mg and genomic DNAs (gDNAs) were extracted using PureLink Genomic DNA Mini Kit (K182000; Invitrogen, Waltham, MA, USA) by following the manufacturers protocol. Total DNA concentration was calculated using QuantiFluor dsDNA System (E2671; Promega, Madison, WI, USA). To assess the integrity of the gDNAs, samples were analyzed using Genomic DNA ScreenTape Analysis (5067‐5366; Agilent, Santa Clara, CA, USA) with the 4200 TapeStation System (G2991BA; Agilent). The sequencing libraries were prepared according to the manufacturer's instructions of TruSeq Nano DNA High Throughput Library Prep Kit (20015965; Illumina, Inc., San Diego, CA, USA). The paired end (2 × 150 bp) sequencing data were generated using the NovaSeq (20012850; Illumina, Inc.) up to target depths of 30× and 60× for normal and tumor samples, respectively.
Somatic Variant Calling
5.3
We analyzed the somatic variants using the DNA pipeline of Illumina DRAGEN Bio‐IT Platform (https://www.illumina.com/products/by‐type/informatics‐products/dragen‐bio‐it‐platform.html). The DRAGEN Bio‐IT Platform integrates all processing from mapping/alignment to the haplotype variant calling into one pipeline. The resulting somatic variant calls were annotated using FUNCOTATOR. To create high‐confidence variant sets, we filtered out variants with the following characteristics: (1) variant allele frequency of 1% or higher in the panel of normals, (2) three or more mismatched bases in the variant reads, (3) common artifact and germline variant sites, (4) frequent presence of error reads in other clones, (5) depth of coverage less than 10 in the tumor sample, and (6) average base quality score below 20 [67, 68, 69].
Analysis of Somatic Variant
5.4
The mutation annotation file was loaded into R using the maftools package [70]. The “oncoplot” function provided by maftools was used for group comparison, and the “somaticInteraction” function was used to identify mutually exclusive or co‐occurring gene pairs using pairwise Fisher's exact test. Genes that were differentially mutated between the two groups with a p value less than 0.05 were considered for subsequent analysis. Mutational signature analysis was performed using the “BSgenome.Hsapiens.NCBI.GRCh38” package to form the mutation matrix. NMF function was then used to analyze various values, and the fitness was measured based on cophenetic correlation. The value with the lowest correlation was selected and compared with known signatures in the COSMIC database to identify the mutational signature with the highest cosine similarity. For driver gene analysis, we used the oncodrive function based on the oncodriveFML algorithm to identify driver genes. We defined genes with a false discovery rate of p < 0.05 as driver genes. We conducted survival analysis to evaluate the effect of driver genes on recurrence, and performed the analysis using the mafSurvive function.
CNV Analysis
5.5
CNV analysis was conducted using the GATK4 CNV pipeline. Segmented copy ratio profiles were generated for each sample using ModelSegments and further processed into discrete CNV calls with CallCopyRatioSegments. Gene‐level annotation of CNV regions was performed by intersecting CNV segments with the GENCODE v38 gene annotation (GTF format) using R. Genes overlapping with amplified or deleted segments were identified based on predefined copy ratio thresholds. To assess the functional impact of CNVs, pathway‐level summaries were generated for selected oncogenic signaling pathways. The frequency of CNV events within each pathway was calculated and compared across all samples.
Statistics Analysis
5.6
All statistical analyses were performed using the R software v4.1.2 (https://www.R‐project.org/). Chi‐square tests were employed to evaluate differences in mutation frequencies between cohorts across oncogenic pathways, based on categorical proportion data. The Wilcoxon rank‐sum test (for two groups) or Kruskal–Wallis test (for more than two groups) was used to examine group differences for continuous measures. Fisher's exact test was used to assess the enrichment of mutations in a given gene as compared with the background mutation rate. All tests were two‐sided with p < 0.05 being considered statistically significant.
Author Contributions
Conceptualization: S.K. and Y.H.K. Data curation: J.K., D.M.L., Y.J.K., H.S., T.Y.K., K.J.P., S.B.K., C.S.Y., and J.L.L. Formal analysis: J.K., D.M.L., Y.Y., H.L., E.J.K., H.M.K., S.M., D.K., H.J.H., E.K.K., H.S.L., S.E.B., and Y.H.K. Funding acquisition: Y.H.K. and S.K. Investigation: S.U.B., J.W.P., T.K.K., D.L., K.K., C.K.O., D.S.K., S.C., H.R.P., S.K., and Y.H.K. Methodology: J.K., D.M.L., Y.Y., H.L., E.J.K., H.M.K., S.M., D.K., H.J.H., E.K.K., H.S.L., and S.E.B. Project administration: S.K. Software: J.K. and D.M.L. Supervision: S.K. and Y.H.K. Visualization: J.K. and D.M.L. Roles/writing – original draft: J.K., D.M.L, S.U.B., J.W.P., T.K.K., D.L., K.K., C.K.O., D.S.K., S.C., and H.R.P. Writing – review and editing: S.K. and Y.H.K. All authors listed have consented to the submission and publication of this manuscript. They have reviewed the final version of the manuscript and agree to its content.
Ethics Statement
This study was conducted in accordance with the Declaration of Helsinki (as revised in 2008) and was approved by the Institutional Review Board of Dongsan Medical Center (No. DSMC 2024‐01‐062). Informed consent was obtained from all participants.
Conflicts of Interest
The authors declare no conflicts of interest.
Study Approval
This study was provided with bioresources from CODA (CODA_S2200008‐01) in National Biobank of Korea, the Agency for Disease Control and Prevention, Republic of Korea.
Funding Information
This work was supported by the National Research Foundation of Korea (NRF) grant funded by the Korea government (MSIT) (RS‐2024‐00406152, RS‐2024‐00439078, RS‐2023‐00249115, 2021M3E5D7102565). This work was supported by the National Research Foundation of Korea (NRF) grant funded by the Ministry of Education (RS‐2025‐02305555). This research was supported by a grant of the Korea Health Technology R&D Project through the Korea Health Industry Development Institute (KHIDI), funded by the Ministry of Health & Welfare, Republic of Korea (RS‐2025‐02223691). This research was also supported by the Bio & Medical Technology Development Program of the NRF funded by the Ministry of Health and Welfare, Ministry of Science and ICT, Ministry of Trade Industry and Energy, and Korea Disease Control and Prevention Agency (The National Project of Bio Big Data) (NRF‐2020M3E5D7085175). This work was supported by KREONET.
Supporting information
Figure S1. Comparative analysis of somatic variants patterns and oncogenic pathway alterations between Korean CRC and TCGA‐CRC cohorts.Figure S2. Sex‐specific mutation patterns in top five oncogenic pathways.Figure S3. Landscape of somatic mutations in CRC patients (149 left CRC vs 47 right CRC).Figure S4. Left and right CRC‐specific mutation patterns in top five oncogenic pathways.Figure S5. Mutational patterns in the top 5 oncogenic pathways according to age 40 criteria.Figure S6. Landscape of somatic mutations in CRC patients (160 over 50 years old vs 37 under 50 years old).Figure S7. Landscape of somatic mutations in CRC patients (160 over 50 years old vs 37 under 50 years old).Figure S8. Landscape of somatic mutations in CRC patients based on recurrence and metastasis. (18 recurrence vs 145 nonrecurrence and 34 metastatic CRC).Figure S9. Mutational patterns in the top 5 oncogenic pathways according to relapse status.Supplementary Table 1. List of driver genes identified through positional clustering in 197 CRC patients.Supplementary Table 2. List of mutational hotspots in Korean CRC.Supplementary Table 3. List of driver single genes and gene combinations associated with prognosis in Korean CRC patients.Supplementary Table 4. List of mutations that occurred in hypo mutated MSS.
Supplementary Table 5. List of specific mutations according to clinical variables.
The reference list from the paper itself. Each links out to its DOI / PubMed record.
- 1M. J. Kang , Y. J. Won , J. J. Lee , et al., “Cancer Statistics in Korea: Incidence, Mortality, Survival, and Prevalence in 2019,” Cancer Research and Treatment: Official Journal of Korean Cancer Association 54, no. 2 (2022): 330–344.10.4143/crt.2022.128PMC 901630935313102 · doi ↗ · pubmed ↗
- 2Y. H. Xie , Y. X. Chen , and J. Y. Fang , “Comprehensive Review of Targeted Therapy for Colorectal Cancer,” Signal Transduct Target Ther 5, no. 1 (2020): 22.32296018 10.1038/s 41392-020-0116-z PMC 7082344 · doi ↗ · pubmed ↗
- 3D. K. Rex , C. R. Boland , J. A. Dominitz , et al., “Colorectal Cancer Screening: Recommendations for Physicians and Patients From the US Multi‐Society Task Force on Colorectal Cancer,” Gastroenterology 153, no. 1 (2017): 307–323.28600072 10.1053/j.gastro.2017.05.013 · doi ↗ · pubmed ↗
- 4N. Keum and E. Giovannucci , “Global Burden of Colorectal Cancer: Emerging Trends, Risk Factors and Prevention Strategies,” Nature Reviews Gastroenterology & Hepatology 16, no. 12 (2019): 713–732.31455888 10.1038/s 41575-019-0189-8 · doi ↗ · pubmed ↗
- 5J. Sánchez‐Gundín , A. M. Fernández‐Carballido , L. Martínez‐Valdivieso , D. Barreda‐Hernández , and A. I. Torres‐Suárez , “New Trends in the Therapeutic Approach to Metastatic Colorectal Cancer,” International Journal of Medical Sciences 15, no. 7 (2018): 659.29910669 10.7150/ijms.24453 PMC 6001415 · doi ↗ · pubmed ↗
- 6E. P. van der Stok , M. C. Spaander , D. J. Grünhagen , C. Verhoef , and E. J. Kuipers , “Surveillance After Curative Treatment for Colorectal Cancer,” Nature Reviews Clinical Oncology 14, no. 5 (2017): 297–315.10.1038/nrclinonc.2016.19927995949 · doi ↗ · pubmed ↗
- 7A. M. Wolf , E. T. Fontham , T. R. Church , et al., “Colorectal Cancer Screening for Average‐risk Adults: 2018 Guideline Update From the American Cancer Society,” CA: a Cancer Journal for Clinicians 68, no. 4 (2018): 250–281.29846947 10.3322/caac.21457 · doi ↗ · pubmed ↗
- 8K. G. Brown , M. J. Solomon , K. Mahon , and S. O'Shannassy , “Management of Colorectal Cancer,” Bmj 366 (2019).10.1136/bmj.l 456131439545 · doi ↗ · pubmed ↗