Phytochemical profiling and anticancer activity of the n-butanol fraction from Ardisia villosa extract: Inhibition of gastric cancer cell proliferation via cell cycle arrest and senescence induction
Nguyet Mai Hua, Van Khang Pham, Thi Thanh Huong Le, Son Hiep Pham, Viet Hoang, Thu Huong Trinh, Dinh Quang Hung Can, Van Hung Hoang, Phu Hung Nguyen

TL;DR
This study explores a plant extract's ability to stop cancer cell growth by causing cell cycle arrest and senescence, particularly in gastric cancer.
Contribution
The study identifies the n-butanol fraction of Ardisia villosa as a potent anticancer agent through multi-targeted mechanisms in gastric cancer cells.
Findings
The n-butanol fraction inhibited gastric cancer cell proliferation with IC50 values as low as 51.7 µg/mL.
It induced G0/G1 cell cycle arrest by modulating key regulators like CCND1, CCNE1, and CDKs.
The extract also triggered cellular senescence and suppressed tumor sphere formation and migration in gastric cancer cells.
Abstract
Medicinal plants serve as valuable sources for anticancer drug discovery. This study investigated the anticancer potential of the n-butanol fraction from Ardisia villosa extract against breast and gastric cancer cell lines. Phytochemical profiling using UPLC-QToF-MS in both positive and negative ESI modes identified 118 putative compounds, including flavonoids, lignans, alkaloids, triterpenoids, steroids, coumarins, and phenolic acids. The n-butanol fraction exhibited dose-dependent antiproliferative effects, with IC50 values of 60.2 µg/mL (MCF-7), 85.2 µg/mL (MKN45), and 51.7 µg/mL (AGS). In AGS gastric cancer cells, the extract significantly inhibited 3D tumorsphere formation and suppressed cell migration at concentrations as low as 50 µg/mL (p < 0.001). Additionally, n-butanol fraction extract markedly induced cellular senescence (p < 0.01). Mechanistic investigations revealed that…
Genes, proteins, chemicals, diseases, species, mutations and cell lines named across the full text — each resolved to its canonical identifier and authoritative record.
Click any figure to enlarge with its caption.
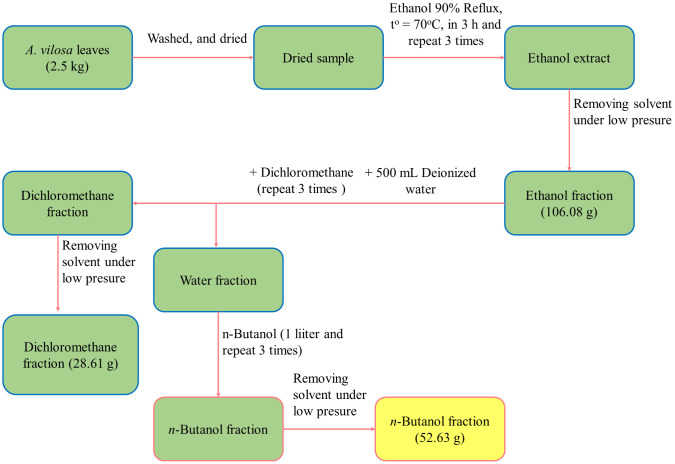 Fig 1
Fig 1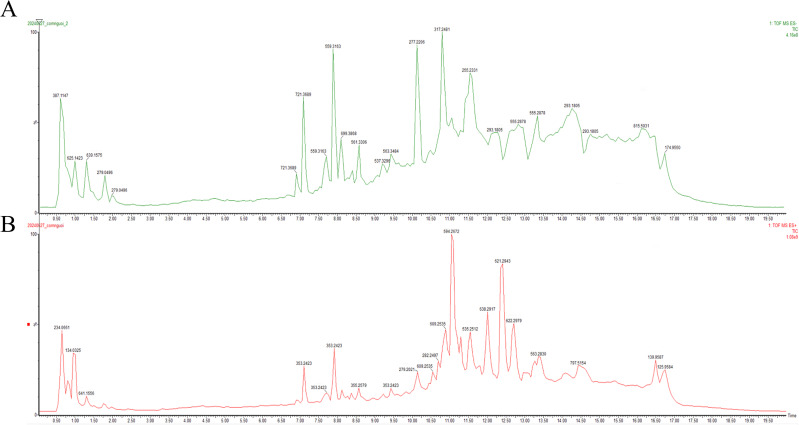 Fig 2
Fig 2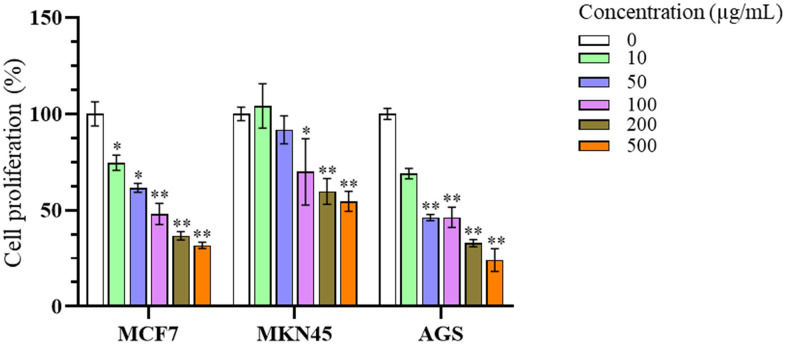 Fig 3
Fig 3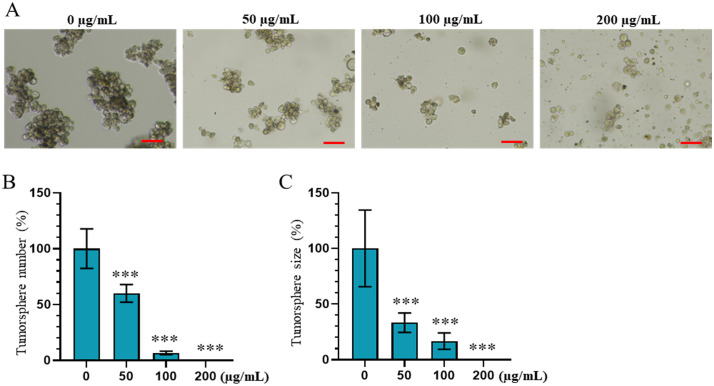 Fig 4
Fig 4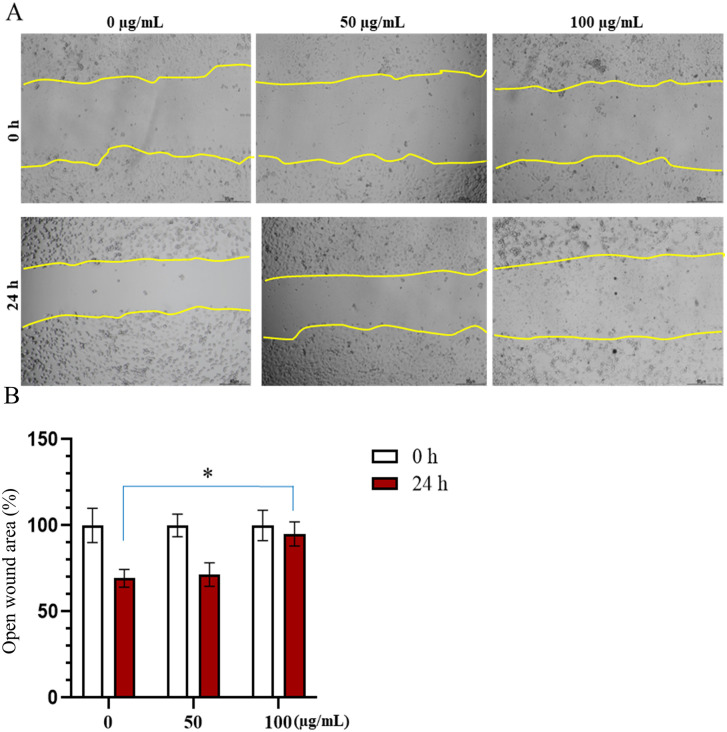 Fig 5
Fig 5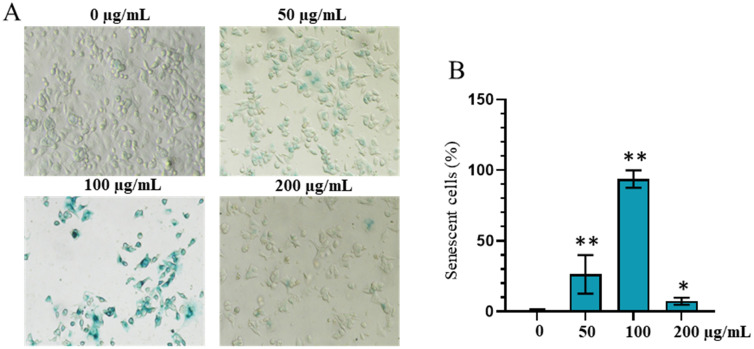 Fig 6
Fig 6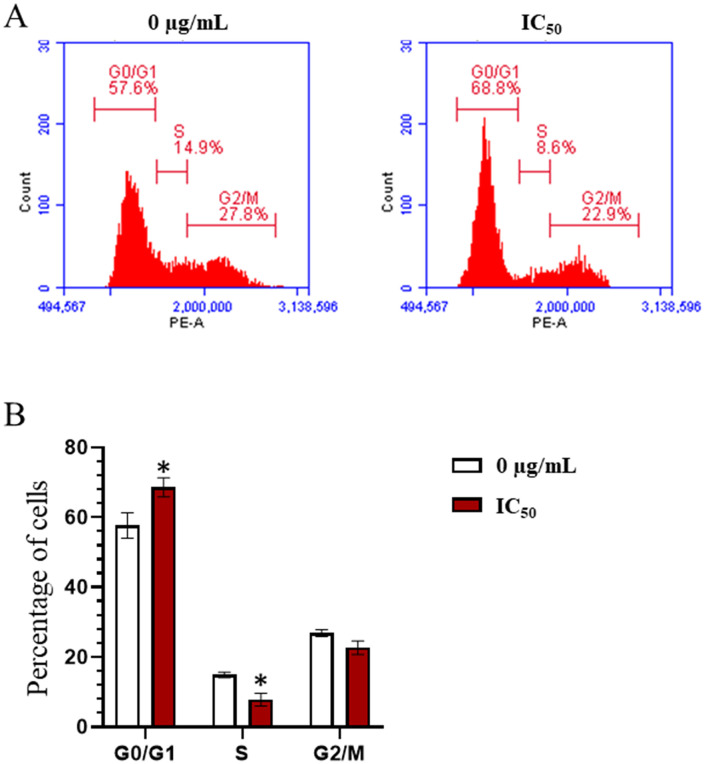 Fig 7
Fig 7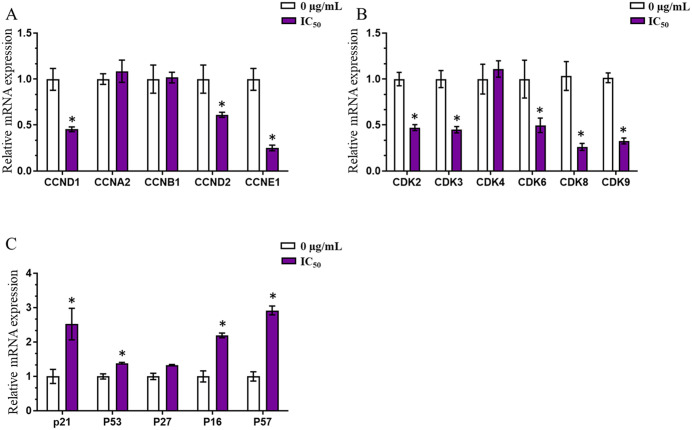 Fig 8
Fig 8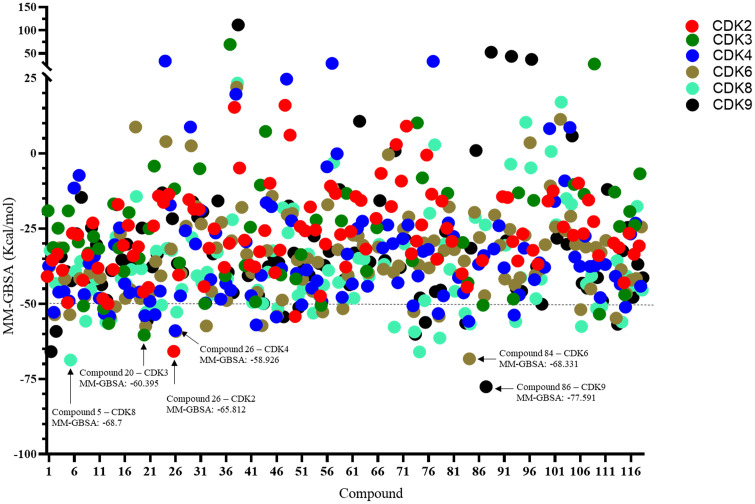 Fig 9
Fig 9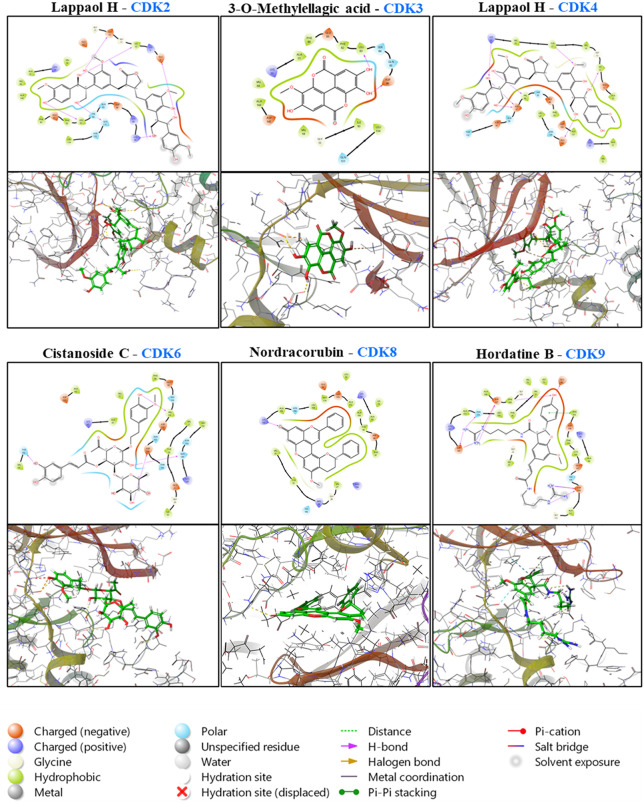 Fig 10
- —Thai Nguyen University of Sciences
- —Thai Nguyen University
Peer Reviews
No public reviews on file for this paper yet. If you reviewed it on a platform where reviews are public (OpenReview, ICLR, NeurIPS, ICML), you can paste yours below so the community can read it here.
Videos
No videos yet. Explain this paper in a talk, walkthrough, or lecture? Add one.
Taxonomy
TopicsCancer-related Molecular Pathways · Phytochemistry Medicinal Plant Applications · Telomeres, Telomerase, and Senescence
Introduction
Globally, gastric cancer remains one of the most prevalent malignancies and has consistently ranked as the fourth leading cause of cancer-related mortality over the past several years [1]. The incidence and mortality rates associated with gastric cancer are steadily increasing, with a notable trend toward younger patient populations [2,3]. Prominent risk factors include a family history of gastric cancer, dietary habits, tobacco smoking, and infections with Helicobacter pylori and Epstein–Barr virus (EBV [4].
Surgical resection, chemotherapy, and radiotherapy continue to be the most commonly employed treatment modalities in most countries. Among these methods, surgical intervention seeks to completely remove the tumor; however, it involves inherent risks, such as the possibility of tumor cells entering the bloodstream, which could eventually result in metastasis [5]. Moreover, surgery often involves a prolonged recovery period and is not feasible for patients with advanced metastatic disease. Chemotherapy serves as a primary therapeutic strategy, especially in poorly differentiated gastric cancer, effectively inhibiting tumor progression and reducing tumor mass prior to surgical intervention. Nevertheless, it frequently exerts deleterious effects on patient health due to its severe side effects [6].
The toxic side effects associated with conventional therapies have stimulated research into the development of novel therapeutic agents that offer high efficacy with lower toxicity [7]. In this context, the exploration of natural compounds derived from medicinal plants, with inherent biocompatibility, anticancer potential, and minimal side effects has emerged as a promising research direction [8].
The genus Ardisia, comprising approximately 500 species predominantly distributed in tropical and subtropical regions, is widely utilized as ornamental plants, food sources, and traditional medicines [9]. Various studies have demonstrated that species within this genus contain a diverse range of bioactive compounds, including polyphenols, triterpenoid saponins, quinones, and alkylphenols [10]. Several Ardisia species have exhibited cytotoxic activities against different cancer cell lines, such as hepatocellular carcinoma, breast cancer, gastric cancer, lung cancer, and colorectal cancer [11,12]. Consequently, Ardisia is considered a valuable resource for the development of novel anticancer therapeutics.
Ardisia villosa, a species within the Ardisia genus, is found across various regions, including mountainous areas in Northern Vietnam. Phytochemical analyses have revealed the presence of compounds such as triterpenoid saponins, quinones, phenolics, coumarins, cyclic depsipeptides, and flavonoids in Ardisia species, which have been associated with anticancer, anti-inflammatory, and antimicrobial properties [13]. Previous studies have also indicated that Ardisia villosa possesses inhibitory effects on the proliferation of gastric cancer cells [14]. In traditional medicine, several species of the genus Ardisia, including Ardisia villosa, have been used as important components in herbal formulations for the treatment of rheumatoid arthritis and for relieving bruises and injuries. In addition, it has also been reported to be used in traditional remedies for the treatment of diseases such as dysentery, pulmonary tuberculosis, haemoptysis, and haematemesis [10].
Although preliminary assessments have suggested the cytotoxic potential of Ardisia villosa, the anticancer activity of its extracts and the underlying mechanisms of action remain largely unexplored. Therefore, the objective of the present study is to investigate the anticancer effects of the n-butanol fraction of Ardisia villosa on AGS human gastric cancer cells.
Materials and methods
Preparation of the n-butanol fraction from ardisia villosa leaf extract
Ardisia villosa leaves (voucher TNU2021.07) were gathered in Thai Nguyen Province, Vietnam, and was taxonomically identified by plant taxonomy expert Dr. Thi Thanh Huong Le (Thai Nguyen University) based on the morphological method. Then, the fresh leaves were accurately weighed to 2.5 kg before washing and air-drying. Subsequently, the dried sample was sequentially extracted with 95% ethanol, dichloromethane, deionized water and n-butanol, with each extraction cycle performed in triplicate under identical conditions for each solvent. Notably, ethanol extraction was conducted at 70 °C for three hours each cycle. Finally, filtrates were combined and concentrated under reduced pressure in a rotary evaporator to ensure complete removal of all solvents (Fig 1).
Fractionation scheme of the butanol extract from Ardisia gigantifolia leaves.
Phytochemical profiling of n-butanol fraction
The metabolite profiling of the butanol extract and its subfractions of Ardisia villosa was performed using an ACQUITY UPLC I-Class Plus system coupled with a Xevo G3 ESI/QTOF high-resolution mass spectrometer (Waters Corporation, USA) [15]. Samples were prepared by dissolving 5 mg of dried extract in 0.5 mL of methanol, filtered through a 0.22 µm membrane, and 1 µL was injected for chromatographic separation using a BEH C18 column. Mass detection was conducted in both positive and negative electrospray ionization modes under optimized conditions. Data acquisition was carried out in full scan mode (m/z 50–1100), and fragmentation information was obtained using low- and high-energy modes. Spectral data were processed using UNIFI software, and peak annotation was performed based on fragmentation patterns compared against the Waters Traditional Medicine Library (Waters Corporation, USA).
Cell culture and MTT assay
MCF7 (breast cancer cells), along with MKN45 and AGS (gastric cancer cells), were seeded into 96-well plates at a density of 1 × 10^4^ cells per well in 100 µL of RPMI 1640 medium, which was enhanced with 10% FBS and 1% ampicillin/streptomycin. The cells were then incubated at 37 °C in a humidified environment containing 5% CO2. After allowing 16–24 hours for cell adhesion, cells were treated with varying concentrations of the butanol extract or its subfractions, specifically 0, 10, 50, 100, 200, or 500 µg/mL. After 48 hours of exposure, morphological alterations were observed and recorded using phase contrast microscopy with a Nikon Ts2 inverted microscope.
The MTT assay was conducted following the reviously protocol [16]. After discarding the spent medium, each well received 100 µL of fresh medium containing MTT at 0.5 mg/mL (Thermo Fisher Scientific, US), and were incubated at 37 °C in 5% CO₂ for 4 h. Thereafter, the MTT solution was removed and replaced with 100 µL of dimethyl sulfoxide (VWR, France), followed by a 15 minutes incubation at 37 °C to solubilize the formazan crystals. Cell viability was assessed by measuring absorbance at 570 nm on a Multiskan Sky spectrophotometer (Thermo Fisher Scientific, USA). Proliferation was expressed as a percentage using the formula provided above.
All assays were conducted in triplicate across three independent experiments. IC_50_ values for cell proliferation were determined by nonlinear regression using GraphPad Prism 10.5 in accordance with the manufacturer’s guidelines.
Cell migration analysis
Cells were plated in 96-well plates (100 µL/well; 2.0 × 10⁵ cells/well) and allowed to form a uniform monolayer. A linear scratch was made using a 10-µL pipette tip to generate a cell-free gap. Debris and detached cells were removed by washing twice with PBS. The cultures were then exposed to n-buthanol fraction extract (50 and 100) for 24 h. Gap closure, used as an index of migratory capacity, was imaged with a Nikon Ts2 inverted microscope (Tokyo, Japan) and quantified in ImageJ by measuring the gap width at each time point [17]. The remaining open area was expressed as:
Tumorsphere formation assay
To generate non-adherent culture conditions, 24- or 96-well plates were coated with poly(2-hydroxyethyl methacrylate) (polyHEMA; 10 mg/mL in 96% ethanol). Briefly, 50 µL (96-well) or 100 µL (24-well) polyHEMA solution was dispensed per well, dried by complete ethanol evaporation at 50–60°C, and the coating step was repeated twice. Wells were then rinsed three times with PBS. During washing and medium changes, pipetting was performed gently to avoid disrupting the polyHEMA layer.
Cells (1,000 cells/well) were seeded in DMEM/F-12 supplemented with 1% penicillin/streptomycin, 0.1% amphotericin B (500 µg/mL), 20 ng/mL EGF, and 0.4% glucose, and treated with ACE at indicated concentrations. After 48 h, tumorspheres were imaged using a Nikon Eclipse Ti2 inverted microscope. Sphere number (clusters ≥ 10 cells) was counted at 100 × –200 × , and sphere diameter was measured from 200 × images using ImageJ [17]. Data were expressed as percentages relative to the vehicle control.
Cell cycle analysis
Cell cycle distribution was assessed utilizing a BD Accuri™ C6 Plus flow cytometer (BD Biosciences, USA) as previously described [18]. A total of 2 × 10^^4^ cells were seeded in 24-well plates and incubated in RPMI 1640 medium for 24 hours. Subsequently, the cells were treated with fresh medium containing subfraction of butanol extract at varying concentrations ranging from 0 to 200 µg/mL for a duration of 48 hours. Post-treatment, the cells were fixed in 70% ethanol and stained with propidium iodide (PI) for 30 minutes. Following staining, cells were collected through trypsinization and centrifuged at 13,000 rpm for 5 minutes. Flow cytometric analysis was conducted to evaluate DNA content and cell cycle phases, with all experiments performed in triplicate to ensure reproducibility [18].
Cell senescence assay
Senescence was evaluated through histochemical staining using Senescence Cells Histochemical Staining Kit (Sigma-Aldrich, France), according to the manufacturer’s protocol. The cells were initially washed twice with 1 × phosphate buffered saline (PBS) solution to remove any residual medium or debris. Subsequently, cells were fixed with 1 × Fixation buffer and incubated the plate for 10–15 minutes at room temperature to preserve their structural integrity. After fixation, the Fixation buffer was discarded, and the cells were rinsed twice more with 1 × PBS, using 500 µL per wash to ensure complete removal of the fixative. Subsequently, 50 µL Staining mix solution containing senescence-associated β-galactosidase (SA-β-gal) was applied to each well. The cells were then cultured at 37°C in the absence of light for 2 hours to facilitate the detection of SA-β-gal activity, which serves as a marker for cellular senescence. Following the incubation period, the cells were examined under a light inverted microscope at 100 × magnification. The presence of senescent cells was confirmed by the characteristic blue staining, which was visualized and documented through microscopic imaging [19]. The experiments were repeated 3 times for each condition
Real-time PCR analysis for mRNA expression
Cancer cells were cultured in 6-well plates at a density of 2 × 10⁵ cells per well and subjected to a subfraction of butanol extract at its IC_50_ concentration for a duration of 24 h. Subsequent to the treatment, total RNA was extracted utilizing TRIzol reagent (Invitrogen Thermo Fisher Scientific, US) in accordance with established protocols. Following chloroform-induced phase separation and ethanol-mediated RNA precipitation, the RNA was washed with 70% ethanol, air-dried, and reconstituted in nuclease-free water. The yield and purity of RNA were quantified using a NanoDrop spectrophotometer. Quantitative real-time PCR were conducted utilizing the BIOFACT 2 × One-Step SYBR Green RT-qPCR kit (BIOFACT, Korea) on a qTower³ thermal cycler (Analytik Jena, Germany), with each reaction comprising 20 ng of total RNA. The thermal profile included an initial denaturation at 95 °C for 15 minutes, followed by 95 °C for 20 seconds and 60 °C for 20 seconds for 40 cell cycles. Primer sequences used are listed in S1 Table. HPRT1 was used as the reference gene, and relative expression was calculated using the 2^⁻ΔΔCt^ method [20]. All experiments were conducted in three independent replicates.
Molecular docking
Ligand and protein preparation.
The chemical structures of the investigated compounds were either retrieved from the PubChem database (https://pubchem.ncbi.nlm.nih.gov) in SDF format or manually drawn using ChemDraw 23.1.1. Ligands were prepared using the LigPrep module in Schrödinger Maestro (Release 2024−3), which generated all plausible tautomeric and stereoisomeric forms, assigned ionization states at pH 7.0 ± 2.0, and optimized each structure to its lowest-energy 3D conformation using the OPLS4 force field.
The crystal structures of cyclin-dependent kinases CDK2, CDK3, CDK4, CDK6, CDK8, and CDK9 were retrieved from the Protein Data Bank (PDB IDs: 2R3I, 8H4R, 7SJ3, 5L2S, 5HBJ, and 8I0L, respectively). Protein structures were processed using the Protein Preparation Wizard. During preparation, bond orders were reassigned, missing hydrogens were added, and crystallographic water molecules not involved in ligand interactions were removed. The protonation states of ionizable residues were predicted using PROPKA at pH 7.4, and hydrogen-bonding networks were optimized accordingly. For co-crystallized ligands and hetero groups, Epik was used to determine protonation and tautomeric states at pH 7.4 ± 2.0.
Molecular docking and validation.
For each CDK target, the binding site was defined based on the location of the co-crystallized ligand in the corresponding PDB structure. The receptor grid boxes used for docking were centered on this ligand and adjusted to encompass the entire binding pocket. Grid coordinates and dimensions for each protein target are listed in Table 1.
Table 1: Receptor grid box parameters for CDK proteins.
To validate the docking protocol, the co-crystallized ligands were re-docked into their original binding sites using the Glide XP (extra precision). The resulting poses were compared with the crystal structures by calculating the root-mean-square deviation (RMSD), and docking was considered reliable when RMSD values were below 2.0 Å. Subsequently, 118 prepared ligands were docked against all six CDK targets using Glide XP.
MM-GBSA binding free energy estimation.
The binding free energies of the top-ranked docking poses were evaluated using the Prime MM-GBSA method (Molecular Mechanics with Generalized Born Surface Area), which is widely recognized as a robust method for estimating relative binding affinities of ligand–protein complexes [21]. Calculations were performed using the VSGB solvation model and the OPLS4 force field. Binding free energy (ΔG_bind_) was calculated as:
where Gcomplex represents the free energy of the complex, and Gprotein and Gligand represent the MM-GBSA energies of the unbound protein and ligand, respectively.
Data analysis
The data gathered were examined using the specialized software GraphPad Prism 10.5 (GraphPad Software, San Diego, CA, USA). Mann-Whitney and one-way ANOVA test were employed for statistical analysis, with a p-value of less than 0.05 considered as statistically significant.
Results
Phytochemical profiling of the n-butanol fraction
Compound identification was performed using exact mass measurements, fragmentation patterns obtained under both high- and low-energy collision conditions, and spectral matching with library data. The respective total ion chromatograms (TICs) are shown in Fig 2 which illustrates the chromatograms produced under two ionization conditions: (A) negative and (B) positive. Positive electrospray ionization (ESI) mode exhibited superior ionization efficiency, as indicated by a greater number of detected ion signals compared to the negative ion mode. During data preprocessing, only peaks with signal intensities above 5000 counts were annotated, and a mass error tolerance of 5 ppm was applied to match experimental data with theoretical values.
UPLC-QToF-MS chromatographic profiles of n-butanol soluble fractions isolated from Ardisia villosa.Extract under (A) negative and (B) positive ESI modes.
The compounds were arranged according to observed RT. A total of one hundred and eighteen compounds were tentatively identified including ten flavonoid compounds, ten lignans, twenty-two alkaloids, thirty-seven triterpenoids, thirteen steroids, 5 coumarin compounds, twelve phenolic & aromatic compounds and other funtional ingredients. It is possible to check the distribution of the determined secondary metabolites in the analyzed sample. The 118 detected compounds with UPLC-QToF-MS in both negative and positive mode are listed in Table 2, along with names of the compounds; formula; expected mass (Da); observed mass (Da); observed (m/z); mass error (mDa); observed RT (min); class; pathway.
Table 2: Phytochemical compound of n-butanol fraction from Ardisia villosa.
Anti-proliferation activity of n-butanol fraction.
The antiproliferative activity of the ethanol fraction (crude extract), n-butanol, and Dichlorometane fraction fraction was evaluated against three cancer cell lines, including breast cancer (MCF-7) and gastric cancer (MKN45 and AGS), using the MTT assay. The half-maximal inhibitory concentration (IC_50_) values of the extracts and fractions shown in Table 3 (and see more in S2 Table, S3 Table, and S4 Table) indicate that the effects on cell proliferation differed among the crude extract (ethanol extract) and fractions, as well as among the tested cell lines. The n-butanol fraction exhibited the strongest activity, showing low IC_50_ values with narrow confidence intervals in the evaluated cell lines, particularly in AGS cells (51.7 µg/mL). In contrast, the ethanol fraction showed the weakest activity, as reflected by higher IC_50_ values, most notably in AGS cells (167.4 µg/mL). Among the cell lines, AGS appeared more sensitive than MCF7 and MKN45 to the tested fractions. Therefore, the n-butanol fraction effect in AGS cells was selected for subsequent mechanistic investigations and more analyses.
Table 3: Effects of n-butanol fraction on the proliferation of cancer cells.
As shown in Fig 3, the cell viability of all tested cell lines decreased in a dose-dependent manner across concentrations ranging from 0 µg/mL to 500 µg/mL. Even at the initial concentration of 10 µg/mL, a reduction in proliferation was observed, with MCF-7 and AGS cell viability decreasing to 74.6 ± 3.9% and 69.0 ± 2.7%, respectively. Notably, significant growth inhibition was recorded at concentrations of 100 µg/mL and above, where MKN45 cell viability dropped to 69.9 ± 17.2% (p < 0.05), while MCF-7 and AGS cell viabilities were markedly reduced to 48.1 ± 5.5% and 46.3 ± 5.2%, respectively (p < 0.01).
Effect of n-butanol fraction on cell proliferation of cancer cell lines.Cells were treated with the n-butanol fraction at various concentrations (0–500 µg/mL) for 48 h and subsequently analyzed using the MTT assay. Data are presented as mean ± SD. Statistical significance was assessed using the Mann–Whitney U test: p < 0.05, p < 0.01, and p < 0.001.
n-butanol fraction inhibits tumorsphere formation and growth of AGS gastric cancer cells
To assess the invasive potential of cancer cells, a 3D culture system was employed to induce the formation of tumorspheres, a characteristic closely associated with tumor maintenance and progression. The effects of the n-butanol fraction on tumorsphere formation are illustrated in Fig 4, with Fig 4C highlighting the impact of the extract on tumorsphere size. The results demonstrate that both the number and size of tumorspheres decreased progressively with increasing concentrations of the extract (50–200 µg/mL). At a concentration of 50 µg/mL, a significant reduction in both tumorsphere number and size was observed compared to the control (p < 0.01). Upon increasing the concentration to 100 µg/mL, the number of tumorspheres dropped to approximately 5%, and their size was reduced to about 15% relative to the untreated group. Notably, at the highest tested concentration of 200 µg/mL, tumorsphere formation was almost completely inhibited. These findings clearly indicate that under 3D culture conditions, the n-butanol fraction exerts a pronounced inhibitory effect on the tumorigenic capacity of cancer cells.
*Effects of n-butanol fraction on the tumorsphere formation of AGS gastric cancer.(A) Effect of fraction on tumorsphere morphology, (B) on tumorsphere number, and (C) on tumorsphere size. Data are presented as the mean ± standard deviation, Mann-Whitney test, **p < 0.001 compared to the control; Scale bar = 100 µm.
n-butanol fraction reduces migration ability of of AGS gastric cancer cells
The inhibitory effect of the n-butanol fraction on AGS gastric cancer cell migration is presented in Fig 5. The results revealed clear differences in cell migration based on the wound boundary observed in control wells compared to those treated with the n-butanol fraction. In the control group, AGS cells exhibited strong migratory activity, significantly narrowing the wound area after 24 hours, to approximately 70% of the initial width at 0 hours. At a concentration of 50 µg/mL, the extract did not result in a significant difference in migration compared to the untreated control. However, at a concentration of 100 µg/mL, a marked inhibition of cell migration was observed. Cells showed substantially reduced or complete absence of movement into the wound area, and most of the observed cells were either non-motile or dead. The measured wound widths in the 100 µg/mL treatment groups remained at approximately 95%, respectively, compared to the control group at 24 hours (p < 0.05). These findings suggest that the n-butanol fraction impairs the migratory capacity of AGS cells in a dose-dependent manner.
*Effect of n-butanol fraction on the migration of AGS cells.(A) Representative images of wound healing assay showing the migratory ability of AGS cells treated with different concentrations (0, 50 and 100 μg/mL) of n-butanol fraction at 0 and 24 hours. The yellow lines delineate the wound edges. (B) Quantitative analysis of wound closure percentage at 0 and 24 hours. Data are presented as mean ± standard deviation. Mann-Whitney test, *p < 0.05, *p < 0.01 compared to the control group (0 μg/mL).
n-butatnol fraction induces cell senescence
The impact of the n-butanol fraction on cellular senescence in AGS cells is presented in Fig 6. Treatment with 50 µg/mL of the extract resulted in a marked increase in senescent cell number—approximately 25-fold compared to the control group (p < 0.01). At a higher concentration of 100 µg/mL, the extract induced the most pronounced senescence, as evidenced by a substantial accumulation of SA-β-gal-positive cells, showing an approximately 93-fold increase relative to the control (p < 0.01). Interestingly, at the highest concentration tested (200 µg/mL), the proportion of senescent cells significantly decreased compared to the 50 and 100 µg/mL treatments. Instead, a notable increase in cell death was observed, indicating a shift in the cellular response from senescence induction to cytotoxicity (p < 0.05).
*Effect of n-butanol fration on cellular senescence in AGS gastric cancer cells.(A) Representative images of senescence-associated β-galactosidase (SA-β-gal) staining in AGS cells treated with different concentrations (0, 50, 100, and 200 μg/mL) of n-butanol fraction. Senescent cells are stained blue. (B) Quantitative analysis of the percentage of SA-β-gal-positive cells. Data are presented as mean ± standard deviation. Mann-Whitney test, *p < 0.05, *p < 0.01 compared to the control (0 μg/mL).
n-butanol fraction induces cell cycle arrest at G0/G1 phase
The effects of the n-butanol fraction on the cell cycle were evaluated by flow cytometry analysis. Cell cycle profiling (Fig 7) revealed that the n-butanol fraction induced cell cycle arrest in AGS cells. Specifically, there was an accumulation of cells in the G0/G1 phase in the n-butanol-treated group (68.6 ± 2.7%) compared to the control group (57.7 ± 3.6%), respectively (p < 0.05). This was accompanied by a reduction in the S phase population (p < 0.05), indicating that the extract effectively induced G0/G1 phase arrest.
*Effect of n-butanol fraction on AGS cell cycle.(A) Cell cycle analysis plots by flow cytometry showing the percentage of AGS cells in different phases after treatment with n-butanol fraction and the control group. (B) Quantitative analysis of the percentage of cells in G0/G1, S, and G2/M phases. Data are presented as the mean ± standard deviation, Mann-Whitney test, p < 0.05.
Real-time PCR analysis (Fig 8) showed that the n-butanol fraction at the IC_50_ concentration markedly altered the expression of cell cycle–related genes compared with the 0 µg/mL control. The n-butanol fraction significantly downregulated pro-proliferative cyclin genes, including CCND1, CCND2, and CCNE1, whereas CCNA2 and CCNB1 exhibited only minor or no apparent changes. In parallel, the expression of CDK family genes (CDK2, CDK3, CDK6, CDK8, and CDK9) was significantly reduced. Conversely, the n-butanol fraction significantly upregulated cell cycle inhibitory and anti-proliferative response genes such as P21, P53, P16, and P57, while P27 remained largely unchanged. Collectively, these data indicate that the n-butanol fraction suppresses cell proliferation primarily by inhibiting the Cyclin–CDK axis and activating cell cycle inhibitory signaling pathways.
*Effect of n-butanol fraction on cell cycle regulatory gene expression at mRNA level in AGS gastric cancer cells.Cells were treated with n-butanol fraction at concentration of IC50 (52.7 µg/mL) for 24 hours. RNA total was extracted for realtime PCR analysis. Changes in mRNA levels of genes were analysis by 2–∆∆Ct method. (A) Bar graphs showing the expression of genes belonging to the cyclin group, (B) genes belonging to the cyclin-dependent kinase group, and (C) genes belonging to the cyclin inhibitor group. Data are presented as the mean ± standard deviation. All results are presented as mean ± SD (n = 3). Mann-Whitney test, p < 0.05 compared to control (0 µg/mL).
Molecular docking.
To evaluate the reliability of the docking protocol, re-docking experiments were conducted in which co-crystallized ligands were redocked into the active sites of their respective target proteins. In all cases, the resulting RMSD values were below 2.0 Å, indicating high reproducibility and accuracy of the docking methodology employed in this study. A total of 118 compounds identified from Ardisia villosa n-butanol fraction were subjected to virtual screening against six cell cycle-regulating cyclin-dependent kinases (CDK2, CDK3, CDK4, CDK6, CDK8, and CDK9) using the Glide XP, followed by rescoring with Prime MM-GBSA to refine binding energy estimates. A comprehensive overview of the MM-GBSA results is presented in Fig 9. Each data point corresponds to a ligand–protein complex, with the x-axis indicating compound index (from 1 to 118), the y-axis representing MM-GBSA values (kcal/mol), and color-coding distinguishing among the six CDK targets. This visualization facilitates the comparative analysis of binding affinity distributions across targets.
Molecular docking analysis results of compounds from the n-butanol fraction with cyclin-dependent proteins.
The majority of ligands displayed binding free energies in the range of −25 to −50 kcal/mol. Specifically, the number of compounds within this range were: CDK2 (59 compounds), CDK3 (26), CDK4 (67), CDK6 (72), CDK8 (63), and CDK9 (65). Notably, the proportion of compounds exhibiting ΔG_bind_ values below −50 kcal/mol ranged from 2.54% to 17.8%, depending on the target. CDK8 had the highest number of strong binders (21 compounds), while CDK2 had the fewest (only 3 compounds).
From this dataset, the top-scoring ligand for each CDK was identified based on the lowest ΔGbind score. Compound 26 emerged as the strongest binder for both CDK2 (−65.812 kcal/mol) and CDK4 (−58.926 kcal/mol). The highest-affinity ligands for the remaining targets were: compound 20 for CDK3 (−60.395 kcal/mol), compound 84 for CDK6 (−68.331 kcal/mol), compound 5 for CDK8 (−68.7 kcal/mol), and compound 87 for CDK9 (−77.591 kcal/mol). A detailed summary of binding affinities and molecular interaction profiles for these ligand–target complexes is provided in Table 4. Fig 10 illustrates representative 2D and 3D spatial interactions of each ligand within the active site of its corresponding protein.
Table 4: Docking Scores, and MM-GBSA energies of compounds from n-butanol fraction with target CDK proteins.
2D and 3D interaction diagrams of the compounds with the target proteins exhibiting the highest binding energies.
Discussion
Accurate identification of the chemical constituents present in plant extracts is critically important for predicting and evaluating their potential biological activities. In this study, ultra-performance liquid chromatography coupled with quadrupole time-of-flight mass spectrometry (UPLC-QToF-MS) was employed for the chemical profiling of the n-butanol fraction obtained from Ardisia villosa leaves. This analytical technique offers high sensitivity and precision; a signal intensity threshold of >5000 counts and a mass error tolerance of 5 ppm were applied to ensure the reliable detection and identification of constituents in the extract.
Mass spectrometric analysis revealed a diverse array of metabolites, with a total of 118 compounds identified. These compounds were classified into various chemical categories, including triterpenoids (37 compounds), alkaloids (22 compounds), flavonoids (10 compounds), lignans (10 compounds), steroids (13 compounds), coumarins (5 compounds), phenolic and aromatic compounds (12 compounds), along with other functional constituents. Notably, there has been limited prior research on the phytochemical composition of Ardisia villosa, and thus, the majority of the 118 identified compounds are reported here for the first time, made possible by the high sensitivity of the UPLC-QToF-MS platform.
Significantly, numerous compounds identified and enumerated in Table 1 have been previously documented to demonstrate anticancer activity across various cancer cell lines. For example, within the flavonoid and phenolic groups, notable compounds include ononin (compound 3) [22], epigallocatechin-(4β → 8)-gallocatechin (compound 17) [23], icariin (compound 83) [24], and sanggenon C (compound 105) [25]. Among the terpenoids and steroids, compounds such as bruceene (6), ganoderenic acid A (25) [26], cucurbitacin B (67) [27], and simalikalactone D (81) [28] were identified. In the alkaloid category, brucine (75) [29], Pingpeimine A (91) [30], và Neferine (93) [31] were detected.
The anticancer activity of the n-butanol fraction was evaluated against three different cancer cell lines MCF-7, MKN45, and AGS, and the results demonstrated that the extract exhibited the highest sensitivity toward AGS cells, with an IC_50_ value of 51.7 ± 2.8 µg/mL. Previous cytotoxicity studies on other Ardisia species reported that an ethanol extract from Ardisia gigantifolia exerted inhibitory effects on gastric cancer cell lines MKN45 and MKN74, with IC_50_ values of 55.7 and 123.6 µg/mL, respectively [12]. In addition, earlier investigations revealed that the n-butanol fraction of Pterocephalus hookeri displayed cytotoxic effects on the Hep3B liver cancer cell line (IC_50_ = 90.8 µg/mL) and Caco-2 colorectal cancer cells (IC_50_ = 175.2 µg/mL) [32].
These findings suggest that the antiproliferative potency of plant extracts can vary significantly depending on both the plant species and the extraction solvent used. Differences in solvent polarity and chemical affinity may lead to the enrichment of distinct sets of bioactive compounds, which ultimately influence the biological activity of the extracts.
In recent years, the 3D tumorsphere model has been considered superior to conventional 2D culture systems for toxicity testing due to its high physiological relevance to in vivo tumors. This model allows for more accurate evaluation of drug efficacy and enhances the screening potential for novel therapeutic agents [33,34]. In this study, the n-butanol fraction markedly inhibited tumorsphere formation in AGS gastric cancer cells, underscoring its broad-spectrum anticancer potential. The observed reduction in both the number and size of tumorspheres suggests that bioactive compounds in this fraction effectively target even highly proliferative subpopulations within the tumorspheres.
Cells capable of forming tumorspheres have previously been shown to exhibit cancer stem cell-like properties [34], implying that the butanol fraction may modulate critical signaling pathways essential for cancer stem cell survival and maintenance. Further studies are warranted to elucidate these underlying mechanisms. Cell migration is a key indicator of tumor cell viability, invasiveness, and metastatic potential [34]. In the present study, migration analysis revealed that the n-butanol fraction significantly suppressed the ability of AGS cancer cells to migrate into the wound area created on the culture plate surface. These findings are consistent with earlier results showing that the n-butanol fraction reduced AGS cell proliferation and are also in agreement with previous studies reporting anticancer activity of n-butanol fraction from Ricinus communis in MCF-7 breast cancer cells [35], and the Wenxia Formula Extract in H460 and A549 lung cancer cell lines [36].
Cellular senescence is increasingly recognized as a promising strategy in the development of next-generation cancer therapies. By shifting cancer cells from an uncontrolled proliferative state to an irreversible growth arrest, senescence can effectively impede tumor progression [35]. A key objective of this study was to investigate whether the n-butanol fraction could induce senescence in AGS gastric cancer cells.
Our findings revealed that treatment with the n-butanol fraction at concentrations of 50 and 100 µg/mL induced a pronounced senescent phenotype in AGS cells. In contrast, at higher concentrations (e.g., 200 µg/mL), senescent cells were no longer observed, and instead, a significant increase in cell death was detected, suggesting a shift from a senescence-inducing effect to a cytotoxic response. This concentration-dependent relationship between senescence and cell death aligns with established mechanisms in which sub-lethal drug exposure promotes senescence, whereas higher concentrations trigger apoptosis or necrosis [36].
The data indicate that the n-butanol fraction can induce either cellular senescence or apoptosis, contingent upon the administered dose. Both mechanisms contribute to the inhibition of cancer cell proliferation and may present a dual-mode therapeutic advantage.
As previously mentioned, cellular senescence is characterized by irreversible cell cycle arrest, often associated with the accumulation of cells in the quiescent G0 phase. This hypothesis was investigated through cell cycle analysis (Fig 7). A notable increase in the proportion of cells in the G0/G1 phase compared to the control group indicates that the n-butanol fraction delays cell cycle progression—a critical mechanism contributing to senescence induction.
Further validation using real-time PCR analysis revealed a marked downregulation of several key genes involved in cell cycle progression, particularly those belonging to the cyclin family (CCND1, CCND2, CCNE1) and cyclin-dependent kinases (CDK2, CDK3, CDK6, CDK8, and CDK9), all of which play essential roles in regulating cell proliferation and oncogenesis As previously mentioned, cellular senescence is characterized by irreversible cell cycle arrest, often associated with the accumulation of cells in the quiescent G0 phase. This hypothesis was investigated through cell cycle analysis (Fig 7). A notable increase in the proportion of cells in the G0/G1 phase compared to the control group indicates that the n-butanol fraction delays cell cycle progression—a critical mechanism contributing to senescence induction.
Further validation using real-time PCR analysis revealed a marked downregulation of several key genes involved in cell cycle progression, particularly those belonging to the cyclin family (CCND1, CCND2, CCNE1) and cyclin-dependent kinases (CDK2, CDK3, CDK6, CDK8, and CDK9), all of which play essential roles in regulating cell proliferation and oncogenesis [37].
Remarkably, genes encoding major negative regulators of the cell cycle and established markers of cellular senescence, including p21, p53, p16, and p57, were significantly upregulated following treatment [38,39]. These findings indicate that the n-butanol fraction modulates the expression of both pro-proliferative and anti-proliferative genes, thereby promoting cell cycle arrest and senescence in AGS gastric cancer cells.
In addition to the observed transcriptional downregulation of cyclin and CDK genes, we hypothesized that certain compounds present in the n-butanol fraction of Ardisia villosa may directly inhibit the activity of CDK proteins through high-affinity binding to their active sites. Based on MM-GBSA binding free energy values obtained from in silico molecular docking analyses, several compounds within the extract demonstrated strong potential for CDK inhibition, with binding energies below –50 kcal/mol. Notably, compounds such as Lappaol H, 3-O-Methylellagic acid, Cistanoside C, Nordracorubin, and Hordatine B exhibited the strongest binding affinities toward CDK family proteins, including CDK2, CDK3, CDK4, CDK6, CDK8, and CDK9.
Previous experimental studies have reported that a compound from the Lappaol family, Lappaol F, induces cell cycle arrest at the S phase in colorectal cancer cells [40], and at the G1 and G2 phases in other cancer cell lines [37]. While experimental evidence supporting the cell cycle inhibitory activity of the other identified compounds is currently lacking, their high binding affinity to CDK proteins strongly suggests that they may serve as promising CDK inhibitors. These findings highlight the potential of these natural compounds as candidates for further investigation in cell-based assays to validate their anticancer mechanisms. However, the limitation of this study is that the biological activity assessments were mainly conducted through in vitro experiments, without in vivo validation or isolation of individual bioactive compounds. Moreover, the molecular docking predictions are only theoretical and require further verification through the isolation of pure compounds followed by experimental evaluation of their biological activities in both in vitro and in vivo models.
Conclusion
The c of Ardisia villosa demonstrates notable anticancer activity through inhibition of cell proliferation, tumorsphere formation, and migration, as well as induction of cellular senescence. Phytochemical analysis revealed a diverse profile of bioactive compounds. These findings support its potential as a natural anticancer agent and warrant further preclinical investigation to elucidate its therapeutic efficacy and underlying mechanisms.
Supporting information
S1 TableList of primer for Real-time PCR.(DOCX)
S2 TableEffect of the ethanol extract on cancer cell proliferation.(DOCX)
S3 TableEffect of the n-butanol fraction on cancer cell proliferation.(DOCX)
S4 TableEffect of the dichloromethane fraction on cancer cell proliferation.(DOCX)
The reference list from the paper itself. Each links out to its DOI / PubMed record.
- 1Siegel RL, Giaquinto AN, Jemal A. Cancer statistics, 2024. CA Cancer J Clin. 2024;74(1):12–49. doi: 10.3322/caac.21820 38230766 · doi ↗ · pubmed ↗
- 2Bray F, Laversanne M, Sung H, Ferlay J, Siegel RL, Soerjomataram I, et al. Global cancer statistics 2022: GLOBOCAN estimates of incidence and mortality worldwide for 36 cancers in 185 countries. CA Cancer J Clin. 2024;74(3):229–63. doi: 10.3322/caac.21834 38572751 · doi ↗ · pubmed ↗
- 3Arnold M, Park JY, Camargo MC, Lunet N, Forman D, Soerjomataram I. Is gastric cancer becoming a rare disease? A global assessment of predicted incidence trends to 2035. Gut. 2020;69(5):823–9. doi: 10.1136/gutjnl-2019-320234 32001553 PMC 8520492 · doi ↗ · pubmed ↗
- 4Li Y-N, Xie B, Zhang Y, He M-H, Xing Y, Mu D-M, et al. Advances and key focus areas in gastric cancer immunotherapy: A comprehensive scientometric and clinical trial review (1999-2023). World J Gastroenterol. 2023;29(40):5593–617. doi: 10.3748/wjg.v 29.i 40.5593 37970478 PMC 10642438 · doi ↗ · pubmed ↗
- 5Tohme S, Simmons RL, Tsung A. Surgery for Cancer: A Trigger for Metastases. Cancer Res. 2017;77(7):1548–52. doi: 10.1158/0008-5472.CAN-16-1536 28330928 PMC 5380551 · doi ↗ · pubmed ↗
- 6López MJ, Carbajal J, Alfaro AL, Saravia LG, Zanabria D, Araujo JM, et al. Characteristics of gastric cancer around the world. Crit Rev Oncol Hematol. 2023;181:103841. doi: 10.1016/j.critrevonc.2022.103841 36240980 · doi ↗ · pubmed ↗
- 7Joshi DC, Sharma A, Prasad S, Singh K, Kumar M, Sherawat K, et al. Novel therapeutic agents in clinical trials: emerging approaches in cancer therapy. Discov Oncol. 2024;15(1):342. doi: 10.1007/s 12672-024-01195-7 39127974 PMC 11317456 · doi ↗ · pubmed ↗
- 8Schirrmacher V. From chemotherapy to biological therapy: A review of novel concepts to reduce the side effects of systemic cancer treatment (Review). Int J Oncol. 2019;54(2):407–19. doi: 10.3892/ijo.2018.4661 30570109 PMC 6317661 · doi ↗ · pubmed ↗