The Constituents of Phyllanthus emblica Fruit Ameliorate Hyperlipidemia Through the Modulation of SREBPs, HMG‐CoA Reductase, and LDL Receptor Pathway
Syed Abdul Kuddus, Md. Hasanuzzaman Shohag, Quamrul Islam Yaseen, Labiba Ahmed, Anika Tabassum Kashfia, Fatema Binte Islam, Sabrin Islam Khan, Reatul Karim, Muhammad Maqsud Hossain, Md. Ashraful Alam, Ferdous Khan

TL;DR
Phyllanthus emblica fruit powder reduces high-fat diet-induced hyperlipidemia in rats by affecting key lipid metabolism genes.
Contribution
The study shows PEF modulates SREBPs, HMG-CoA reductase, and LDL receptor pathways to ameliorate hyperlipidemia.
Findings
PEF reduced oxidative stress and harmful plasma lipids in hyperlipidemic rats.
PEF suppressed the expression of SREBP-1c, SREBP-2, and HMGCR while increasing LDLR expression.
Bioactive compounds in PEF interact with proteins involved in lipid metabolism.
Abstract
The current study investigated the effects of dietary supplementation with antioxidant‐rich Phyllanthus emblica fruit powder (PEF) in high‐fat diet (HFD)–induced hyperlipidemic Wistar rats. In silico pharmacokinetic activity prediction and molecular docking studies were performed for several bioactive compounds of the P. emblica fruit. Wistar rats were arranged into four groups and fed one of the following four diets: standard diet (Control), 2% (w/w) PEF‐supplemented standard diet (Control + PEF), HFD, and 2% (w/w) PEF‐supplemented HFD (HFD + PEF). The treatment was continued for 8 weeks, after which the effects of PEF on oxidative stress, fat deposition, plasma lipids, and gene expression of relevant proteins were explored. Several proteins involved in lipid metabolism and homeostasis interact with bioactive phenolic compounds, such as ellagic acid, quercetin, catechin, kaempferol,…
Genes, proteins, chemicals, diseases, species, mutations and cell lines named across the full text — each resolved to its canonical identifier and authoritative record.
Click any figure to enlarge with its caption.
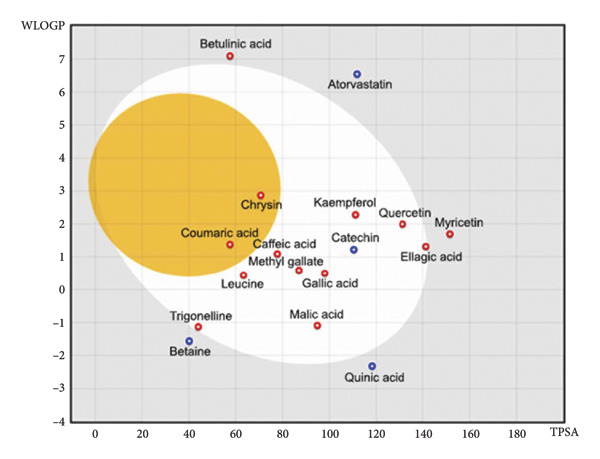 Figure 1
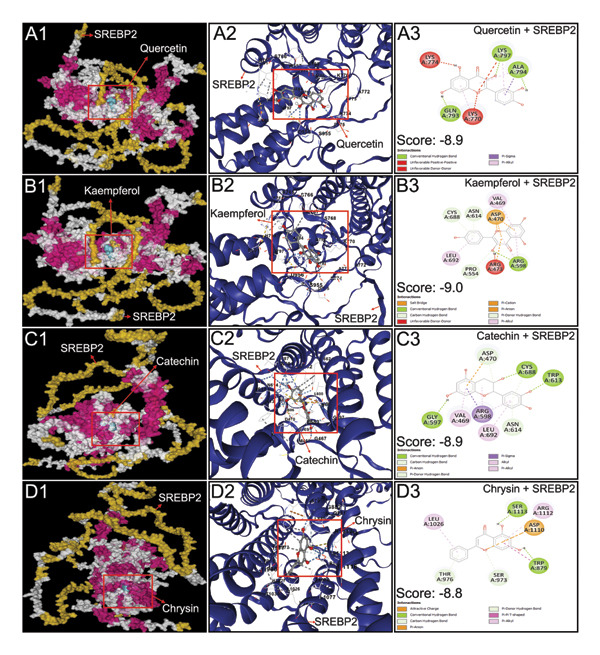 Figure 2
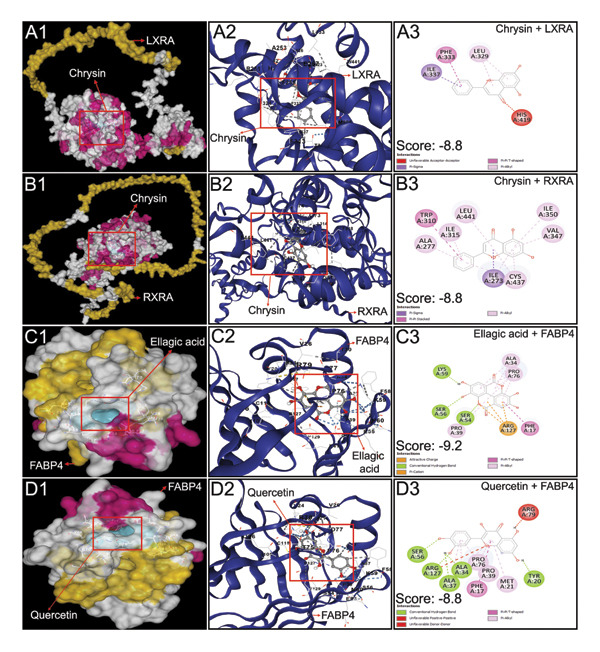 Figure 3
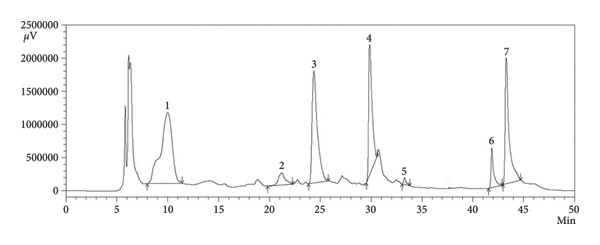 Figure 4
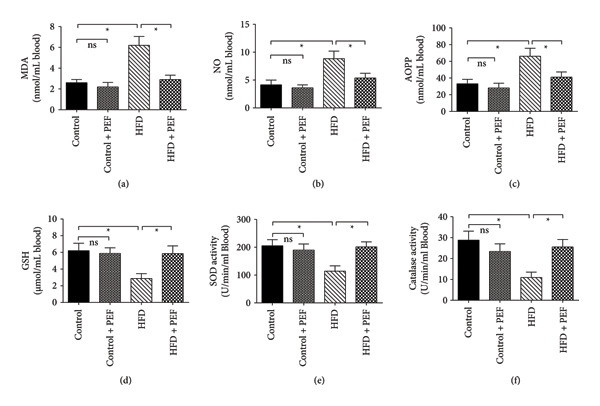 Figure 5
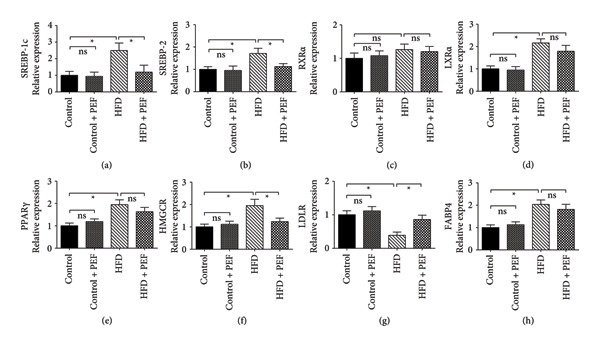 Figure 6
| Gene (GenBank accession no.) | Forward | Reverse |
|---|---|---|
| SREBP‐1c ( | 5′‐GGCATGAAACCTGAAGTGGT‐3′ | 5′‐TGCAGGTCAGACACAGGAAG‐3′ |
| SREBP‐2 ( | 5′‐TCATTCAGCCAGGTCCCATT‐3′ | 5′‐CTGAAGGTCGGGGTGATCAT‐3′ |
| RXRα ( | 5′‐ACACCCATCGACACTTTCCT‐3′ | 5′‐ATGATGGCGAGGATGGTGAT‐3′ |
| LXRα ( | 5′‐TCGACAAGAGACAGCGGAAC‐3′ | 5′‐GTCAAGCAGCAGACAAGCAG‐3′ |
| PPARγ ( | 5′‐CCCTGGCAAAGCATTTGTAT‐3′ | 5′‐GAAACTGGCACCCTTGAAAA‐3′ |
| HMGCR ( | 5′‐CATGCTGCCAACATCGTCA‐3′ | 5′‐TTGTGGGACTTGCTTCAT‐3′ |
| LDLR ( | 5′‐CAGCTGCTGTGTCACTGAAG‐3′ | 5′‐CTTGGACTTGGGAGGACACT‐3′ |
| FABP4 ( | 5′‐CCTTTGTGGGGACCTGGAAA‐3′ | 5′‐TGACCGGATGACGACCAAGT‐3′ |
| β‐actin ( | 5′‐AGCCATGTACGTAGCCATCC‐3′ | 5′‐CTCTCAGCTGTGGTGGTGAA‐3′ |
| No. | Molecule name | Molecular weight | Solubility | HBA | HBD | WLOGP | TPSA/Å2 | LV | BS |
|---|---|---|---|---|---|---|---|---|---|
| 1 | Gallic acid | 170.1 | High | 5 | 4 | 0.50 | 97.9 | 0 | 0.56 |
| 2 | Ellagic acid | 302.2 | Moderate | 8 | 4 | 1.24 | 140.3 | 0 | 0.55 |
| 3 | Quercetin | 302.2 | Moderate | 7 | 5 | 2.01 | 131.3 | 0 | 0.55 |
| 4 | Betaine | 117.2 | High | 2 | 0 | −1.55 | 40.1 | 0 | 0.55 |
| 5 | Trigonelline | 137.1 | High | 2 | 0 | −0.33 | 44.0 | 0 | 0.55 |
| 6 | Myricitrin | 464.4 | Moderate | 12 | 8 | 0.02 | 210.5 | 2 | 0.17 |
| 7 | Myricetin | 318.2 | Moderate | 8 | 6 | 1.71 | 151.6 | 1 | 0.55 |
| 8 | Leucine | 131.2 | High | 3 | 2 | 0.44 | 63.3 | 0 | 0.55 |
| 9 | Kaempferol | 286.2 | Moderate | 6 | 4 | 2.30 | 111.1 | 0 | 0.55 |
| 10 | Paromomycin | 615.6 | High | 19 | 13 | −8.86 | 347.3 | 3 | 0.17 |
| 11 | Rutin | 610.5 | High | 16 | 10 | −1.87 | 269.4 | 3 | 0.17 |
| 12 | Caffeic acid | 180.2 | High | 4 | 3 | 1.19 | 77.8 | 0 | 0.56 |
| 13 | Quinic acid | 192.2 | High | 6 | 5 | −2.32 | 118.2 | 0 | 0.56 |
| 14 | Catechin | 290.3 | High | 6 | 5 | 1.54 | 110.4 | 0 | 0.55 |
| 15 | Chrysin | 254.2 | Moderate | 4 | 2 | 2.71 | 70.7 | 0 | 0.55 |
| 16 | Methyl gallate | 184.2 | High | 5 | 3 | 0.59 | 86.9 | 0 | 0.55 |
| 17 | Ellagitannin | 992.7 | Low | 27 | 13 | −2.82 | 447.1 | 3 | 0.17 |
| 18 | Malic acid | 134.1 | High | 5 | 3 | −1.09 | 94.8 | 0 | 0.56 |
| 19 | Pedunculagin | 784.5 | Moderate | 22 | 13 | −0.45 | 377.4 | 3 | 0.17 |
| 20 | Coumaric acid | 164.2 | Moderate | 3 | 2 | 1.49 | 57.2 | 0 | 0.55 |
| 21 | Betulinic acid | 456.7 | Low | 3 | 2 | 7.08 | 57.5 | 1 | 0.17 |
| 22 | Atorvastatin | 558.6 | Low | 6 | 4 | 4.24 | 111.8 | 1 | 0.56 |
| Sl no. | Name | SREBP1c (kcal/mol) | SREBP2 (kcal/mol) | RXRα (kcal/mol) | LXRα (kcal/mol) | PPARγ (kcal/mol) | HMGCR (kcal/mol) | LDLR (kcal/mol) | FABP4 (kcal/mol) |
|---|---|---|---|---|---|---|---|---|---|
| 1 | Gallic acid | −5.3 | −6.7 | −5.3 | −5.6 | −5.6 | −6.0 | −5.3 | −5.7 |
| 2 | Ellagic acid | −7.7 | −8.4 | −7.0 | −8.2 | −8.6 | −6.7 | −7.5 | −9.2 |
| 3 | Quercetin | −7.9 | −8.9 | −7.5 | −8.1 | −8.0 | −7.7 | −7.2 | −8.8 |
| 4 | Betaine | −3.6 | −4.5 | −3.6 | −4.0 | −3.7 | −3.9 | −2.9 | −3.6 |
| 5 | Trigonelline | −5.2 | −5.5 | −5.1 | −5.1 | −4.8 | −5.1 | −4.2 | −5.1 |
| 6 | Myricetin | −4.5 | −5.0 | −4.4 | −4.8 | −4.6 | −4.8 | −3.8 | −4.7 |
| 7 | Leucine | −7.4 | −7.4 | −6.3 | −7.6 | −8.0 | −6.4 | −6.1 | −5.1 |
| 8 | Kaempferol | −7.4 | −9.0 | −7.4 | −7.9 | −8.1 | −7.4 | −7.1 | −8.1 |
| 9 | Caffeic acid | −5.9 | −6.2 | −5.6 | −5.9 | −5.8 | −5.9 | −4.5 | −5.8 |
| 10 | Quinic acid | −5.5 | −6.7 | −5.5 | −5.6 | −5.5 | −6.0 | −5.1 | −6.0 |
| 11 | Catechin | −7.6 | −8.9 | −8.0 | −7.9 | −7.9 | −7.3 | −6.6 | −8.3 |
| 12 | Chrysin | −7.7 | −8.8 | −8.8 | −8.8 | −7.8 | −8.0 | −7.1 | −8.1 |
| 13 | Methyl gallate | −4.3 | −4.6 | −5.2 | −4.3 | −4.6 | −4.6 | −3.5 | −3.9 |
| 14 | Malic acid | −4.7 | −4.7 | −5.2 | −5.0 | −4.3 | −4.5 | −3.6 | −4.4 |
| 15 | Coumaric acid | −5.4 | −6.7 | −4.9 | −5.2 | −5.7 | −5.2 | −4.4 | −5.9 |
| 16 | Betulinic acid | −6.0 | −6.2 | −6.4 | −5.9 | −5.7 | −5.5 | −4.8 | −5.9 |
| 17 | Atorvastatin | −8.3 | −8.0 | −7.0 | −6.8 | −9.0 | −7.1 | −6.8 | −7.1 |
| Total phenolic content (mg GAE/g) | Total flavonoid content (mg QE/g) | DPPH radical scavenging activity IC50 (μg/mL) | ABTS radical scavenging activity IC50 (μg/mL) | FRAP assay (mg AAE/g) | |
|---|---|---|---|---|---|
| PEF | 213.3 ± 8.2 | 57.4 ± 5.7 | 2.81 ± 0.26a | 2.48 ± 0.12a | 492.0 ± 8.5a |
| BHT | NA | NA | 2.63 ± 0.29a | 1.85 ± 0.11b | 449.2 ± 12.3b |
| Ascorbic acid | NA | NA | 3.82 ± 0.094b | 3.68 ± 0.29c | 992.5 ± 31.2c |
| Compound name | Alcoholic extract of | |
|---|---|---|
| Amount (mg/100 g of dried extract) | Relative standard deviation (%) | |
| Gallic acid | 73.21 | 1.53 |
| Leucine | 11.37 | 0.062 |
| Catechin | 45.22 | 1.05 |
| Ellagic acid | 61.54 | 1.74 |
| Chrysin | 5.12 | 0.085 |
| Kaempferol | 18.22 | 0.075 |
| Quercetin | 78.23 | 2.13 |
| Parameters | Control | Control + PEF | HFD | HFD + PEF |
|---|---|---|---|---|
| Initial body weight (g) | 194.56 ± 2.25a | 193.25 ± 3.42a | 191.56 ± 2.25a | 192.33 ± 3.38a |
| Final body weight (g) | 265.31 ± 5.36a | 273.23 ± 6.92a | 316.23 ± 6.24b | 308.23 ± 5.96b |
| Food intake (g/rat/day) | 19.23 ± 2.51a | 21.5 ± 3.12a | 19.17 ± 2.64a | 20.27 ± 2.45a |
| Liver weight (g/100 g body weight) | 3.51 ± 0.43a | 3.35 ± 0.41a | 4.83 ± 0.63b | 4.43 ± 0.54b |
| Epididymal fat (g/100 g body weight) | 1.13 ± 0.17a | 1.22 ± 0.18a | 1.85 ± 0.21b | 1.68 ± 0.17b |
| Mesenteric fat (g/100 g body weight) | 1.07 ± 0.11a | 1.05 ± 0.11a | 1.47 ± 0.13b | 1.12 ± 0.12a |
| Peritoneal fat (g/100 g body weight) | 0.78 ± 0.09a | 0.83 ± 0.12a | 1.29 ± 0.16b | 1.22 ± 0.08b |
| Parameter | Control | Control + PEF | HFD | HFD + PEF |
|---|---|---|---|---|
| TG (mg/dL) | 139.2 ± 12.5a | 129.3 ± 13.2a | 196.3 ± 17.8b | 143.4 ± 15.6a |
| TC (mg/dL) | 192.4 ± 23.1a | 195.7 ± 21.6a | 265.4 ± 27.5b | 202.5 ± 19.7a |
| HDLC (mg/dL) | 67.5 ± 9.2a | 62.8 ± 7.5a | 43.3 ± 5.1b | 69.5 ± 9.8a |
| LDLC (mg/dL) | 96.8 ± 8.1a | 93.7 ± 11.2a | 173.8 ± 15.6b | 117.5 ± 15.1a |
| FBS (mg/dL) | 72.3 ± 5.7a | 76.3 ± 5.1a | 141.8 ± 10.3b | 82.8 ± 9.3a |
- —North South University10.13039/501100019782
Peer Reviews
No public reviews on file for this paper yet. If you reviewed it on a platform where reviews are public (OpenReview, ICLR, NeurIPS, ICML), you can paste yours below so the community can read it here.
Videos
No videos yet. Explain this paper in a talk, walkthrough, or lecture? Add one.
Taxonomy
TopicsPhytochemistry and Bioactivity Studies · Nigella sativa pharmacological applications · Phytochemicals and Antioxidant Activities
1. Introduction
Apart from genetic predisposition, excessive caloric consumption relative to energy expenditure is the primary driver of body weight gain and metabolic syndrome, which can lead to hyperlipidemia, hypertension, diabetes, and many other health issues [1]. Hyperlipidemia is characterized by increased levels of total cholesterol (TC), triacylglycerol (TG), and low‐density lipoprotein cholesterol (LDLC), along with low levels of high‐density lipoprotein cholesterol (HDLC) [2]. Increased harmful lipid levels and reduced good cholesterol levels predispose individuals to atherosclerosis, ischemic heart disease, myocardial infarction, stroke, and related cardiovascular disorders [3, 4]. Currently, for the management of hyperlipidemia, synthetic molecules such as statins, fibrates, niacin, and PCSK9 inhibitors are the most commonly used drugs [5]. However, their adverse effects, especially those associated with long‐term use, highlight the need for safer alternatives that can reduce hyperlipidemia and restore lipid homeostasis, with greater safety and efficacy.
Phytochemicals from different medicinal plants are generally safer and less toxic than most synthetic drugs and have gained increased researchers’ attention [6]. Among these, Phyllanthus emblica fruit, also known as Indian gooseberry (Family: Euphorbiaceae), has shown notable therapeutic potential, predominantly due to its high antioxidant content [7, 8]. In addition to primary metabolites, the fruit contains a diverse array of bioactive secondary metabolites, including vitamins, tannins, and phenolic and nonphenolic compounds [9]. Through phytochemical screening, researchers demonstrated the presence of phenolic compounds, including quercetin, gallic acid, kaempferol, ellagic acid, myricitrin, myricetin, catechin, and chrysin, as well as nonphenolic compounds, such as ascorbic acid, caffeic acid, betaine, trigonelline, betulinic acid, and oleanolic acid [10–12]. Moreover, using HPLC‐DAD analysis, researchers have estimated the amount of gallic acid (65.12 mg/100 g dry extract), catechin hydrate (55.03 mg/100 g dry extract), caffeic acid (9.77 mg/100 g dry extract), and ellagic acid (74.83 mg/100 g dry extract) in the alcoholic extract of amla fruit [13]. Preclinical and clinical investigations have revealed that quercetin, kaempferol, ellagic acid, catechin, and myricetin mitigate hyperlipidemia and hyperglycemia through their antioxidant and anti‐inflammatory properties. For example, quercetin ameliorates chronic disease‐induced inflammatory and oxidative damage of several organs [14]. A recent study showed that kaempferol and quercetin outperformed metformin in controlling blood glucose and suppressing oxidative stress in diabetic mice [15]. In mice, an ellagic acid–supplemented diet stimulated antioxidant defense and hepatic fat metabolism, which eventually restored blood lipids through the modulation of crucial proteins and transcription factors [16]. Another study revealed that catechin, by reducing oxidative stress, protects vascular endothelial cells from ox‐LDL‐induced atherosclerotic plaque development in ApoE™/transgenic mice by activating the Nrf2/SLC7A11/GPX4 pathway [17]. Tinospora sinensis extract containing caffeic acid, berberine, myricetin, and ferulic acid effectively ameliorated streptozotocin‐induced diabetes in rats by lowering oxidative stress, blood glucose, and inflammation as well as restoring the function of pancreatic β‐cells [18].
Clinical studies have demonstrated that dietary supplementation with P. emblica markedly ameliorates endothelial cell dysfunction, reduces inflammation, oxidative stress, and lipid peroxidation, and decreases plasma lipid levels in human volunteers [19–21]. Similarly, a number of murine models of kidney and liver diseases reported that P. emblica reduces oxidative stress along with an increase of antioxidant enzyme activity [22–25]. Additionally, through cell culture studies, researchers showed that P. emblica and its bioactive constituents effectively prevented the increase of reactive oxygen species (ROS) through restoring the glutathione levels and the activities of several enzymes, including superoxide dismutase (SOD), catalase, and glutathione peroxidase (GPx) [26–28]. Despite these promising results, the molecular mechanisms through which P. emblica and its bioactive phytochemicals modulate lipid metabolism and homeostasis remain poorly understood.
The physiology of lipid homeostasis and the pathogenesis of hyperlipidemia involve a complex network of transcription factors, receptors, and enzymes [29, 30]. Therefore, the role of the abovementioned bioactive phenolics in modulating those networks is crucial in understanding the molecular mechanisms of P. emblica. The emergence of computational biology and molecular docking has facilitated the use of valuable resources for exploring and predicting protein–ligand interactions and therapeutic targets [31, 32]. Recent in silico computational studies have identified interactions between certain compounds of P. emblica and some proteins having roles in lipid homeostasis and metabolic syndrome [33, 34]. However, the predicted pharmacological benefits should be validated through in vitro and vivo studies to fully comprehend the molecular mechanisms at play in the body of living organisms. This study, through the integration of in silico, in vitro, and in vivo methodologies, aims to investigate the effects of P. emblica phytochemicals on hyperlipidemia by exploring their interaction with several proteins that have implications in diet‐induced hyperlipidemia.
2. Materials and Methods
2.1. Chemicals and Reagents
Gallic acid, ellagic acid, catechin, kaempferol, chrysin, quercetin, myricitrin, betaine, and other standard compounds used in the HPLC study were purchased from Sigma‐Aldrich (MO, USA). HPLC‐grade solvents like acetonitrile, methanol, and ethanol were purchased from Merck (Darmstadt, Germany). Folin–Ciocalteu reagent, thiobarbituric acid, trichloroacetic acid, sulfanilamide, and malondialdehyde (MDA) tetrabutylammonium were obtained from Wako Chemicals (Osaka, Japan). All the commercial reagents for the assay of plasma lipids including TC, HDLC, LDLC, and triglyceride were collected from Plasmatec, UK. Reagents for RNA isolation, purification, conversion to cDNA, and SYBR Green Master Mix for performing quantitative real‐time PCR (qPCR) were obtained from ThermoFisher Scientific, USA. Oligonucleotides, used as primers, were bought from Macrogen Inc. (Seoul, Korea). Additional reagents and chemicals required for oxidative stress measurement and antioxidant enzyme activity assay were procured from Scharlau, Spain.
2.2. Selection of Phytochemicals and In Silico Pharmacokinetic Evaluation
Through a literature survey, 21 phytochemicals of Phyllanthus emblica fruit were selected for in silico study based on their antioxidant, anti‐inflammatory, antihyperlipidemic, and antihyperglycemic properties and overall roles in cardiovascular health. The pharmacological properties of 21 selected compounds, including gallic acid, ellagic acid, quercetin, and betaine, with the reported protein targets are presented in Supporting Table 1 (S1). The official SMILES codes for these compounds were obtained from PubChem (https://pubchem.ncbi.nlm.nih.gov). The in silico pharmacokinetic properties of these molecules were predicted using SwissADME (https://www.swissadme.ch). This online tool uses “Lipinski’s Rule of Five” for predicting drug‐likeness, which refers to the prospect of a drug candidate, for oral administration, based on its molecular weight, solubility, and permeability [35]. The absorption pattern from the gastrointestinal tract and the probability of penetration into the brain through the blood–brain barrier (BBB) were predicted using the Egan BOILED‐Egg model. For the construction of the Egan BOILED‐Egg model, the Wildman and Crippen partition coefficient (WLOGP) value of a specific compound was plotted as a function of its topological polar surface area (TPSA) [36]. Atorvastatin, a lipid‐lowering statin, was used as the standard for comparison.
2.3. Molecular Docking Analysis of Selected Phytochemicals
Compounds with acceptable pharmacokinetic properties and drug‐likeness were subjected to molecular docking studies with eight proteins with vital roles in lipid metabolism and homeostasis. These proteins include sterol regulatory element‐binding protein 1c (SREBP‐1c), sterol regulatory element‐binding protein 2 (SREBP‐2), retinoid X receptor alpha (RXRα), liver X receptor alpha (LXRα), peroxisome proliferator–activated receptor gamma (PPARγ), HMG‐CoA reductase (HMGCR), low‐density lipoprotein receptor (LDLR), and fatty acid‐binding protein 4 (FABP4). For molecular docking analysis, the 3D structures of these proteins were downloaded in PDB format from the UniProt (https://www.uniprot.org) and RCSB (https://www.rcsb.org) websites. The structures of the ligands (compounds of P. emblica fruit) were downloaded in SDF format from PubChem online (https://pubchem.ncbi.nlm.nih.gov) and converted to PDB format for further processing. Proteins and ligands were processed for docking analysis using AutoDockTools 1.5.7 [37]. Subsequently, blind docking between proteins and ligands was performed to calculate the docking scores (kcal/mol) using the CB‐Dock2 server, and 2D images of the interaction were generated using BIOVIA Discovery Studio (Version 21) [38].
2.4. Preparation of the Standard Diet, High‐Fat Diet (HFD), and P. emblica Fruit Powder (PEF) Supplemented Diet
Phyllanthus emblica fruit, which was purchased from a local market in Bangladesh, was identified (ID number: BD‐NH2022PE06) by a professional plant taxonomist at the National Herbarium, Dhaka, Bangladesh. After cutting the fruits into small pieces, they were air‐dried (40°C) and pulverized into fine powder. The composition of the AIN‐76A diet formulated by the American Institute of Nutrition was used as a framework for preparing a normal diet (Control) and HFD [39]. 2.0% (w/w) PEF‐supplemented normal diet (Control + PEF) and 2.0% (w/w) PEF‐supplemented HFD (HFD + PEF) were prepared by mixing 20 g of P. emblica dried fruit powder with 980 g of normal diet and 980 g of HFD, respectively. The quantity of ingredients was maintained to ensure that each kg of a normal diet (Control) and a normal diet supplemented with 2% PEF (Control + PEF) contained 3782 kcal, with fat providing 11.9% [40]. Similarly, each kg of HFD and HFD supplemented with 2% PEF (HFD + PEF) contained 5192 kcal, in which fat contributed 52.4%. The compositions of all 4 types of diets with energy content are mentioned in Supporting Table 2 (S2).
2.5. Measurement of Total Phenolic Content (TPC), Total Flavonoid Content (TFC), Radical Scavenging Activity, and Ferric Reducing Antioxidant Power (FRAP)
To prepare an ethanolic extract suitable for in vitro analysis, the fruit powder of P. emblica was soaked in ethanol. Then, ethanol was evaporated using a rotary evaporator to prepare a crude extract, which was used for the assay of TPC, TFC, DPPH, and ABTS radical scavenging activities, and FRAP. The TPC of the extract was determined according to a previous report using Folin–Ciocalteu reagent in the spectrophotometric method [41]. The TFC was measured by aluminum chloride colorimetric assay, described by Phuyal et al. [42]. The DPPH radical scavenging activity of P. emblica fruit extract was quantified using a previously described method. Briefly, in this method, several solutions with different concentrations of P. emblica fruit extract were allowed to react with a 40 μg/mL solution of DPPH for 30 min under light‐protected conditions [43]. To evaluate the ABTS radical scavenging activity, 2,2′‐azino‐bis (3‐ethylbenzothiazoline‐6‐sulfonic acid) (ABTS^+^) ions were allowed to react with 10 μL extract for 15 min under light‐protected conditions, and the radical scavenging potency was estimated based on the extract’s ability to decolorize the ABTS reagent according to a previous report [44]. A reagent containing 300 mM acetate, 10 mM 2,4,6‐tripyridyl‐s‐triazine (TPTZ), and 40 mM FeCl_3_ at a ratio of 10 : 1 : 1 was prepared for the FRAP assay. Then, 900 μL of this reagent was mixed with 30 μL solution of P. emblica fruit extract, and the final volume was made 1000 μL with the addition of water. The absorbance changes of the extract were then determined according to a previous method [45]. In the DPPH and ABTS radical scavenging assays as well as the FRAP assay, ascorbic acid and butylated hydroxytoluene (BHT) were used as standard compounds.
2.6. HPLC Analysis
To detect the presence of several polyphenolic compounds in P. emblica fruit extract, reversed‐phase HPLC (LC‐20A, Shimadzu, Japan) was employed according to the method of Ahmed et al. [6] with a few modifications [6]. Briefly, for chromatographic separation, the C18 column (Luna Phenomenex) was maintained at 34°C in an HPLC column oven (CTO‐20A). A binary solvent pump (LC‐20AT), photodiode array detector (SPD‐M20A), and automatic injection unit (SIL‐20A HT) were equipped with the HPLC system. HPLC‐grade acetonitrile containing 1% acetic acid (solvent A) and Milli‐Q water containing 1% acetic acid (solvent B) was used as the mobile phase. The solvents were vacuum‐filtered through a 0.45‐μm nylon membrane filter and degassed for 15 min. The flow rate of the mixture of mobile phases was set at 0.5 mL/min, and a volume of 20 μL was injected for analysis. Gradient elution of the P. emblica fruit extract solution (10 mg/mL) and standard stock solution in methanol (10–50 μg/mL) was performed separately for 50 min, where the relative proportion of solvent B was gradually increased. LC solution software was used to acquire and analyze the chromatograms of standard and unknown compounds [11].
2.7. Study Design and Animal Feeding
Male Wistar rats (8–9 weeks old and 190 ± 8 g body weight) were reared in separate cages placed in a room maintained between 22°C and 25°C and a 12 h light/dark cycle with an adequate supply of food and water. The comfort and well‐being of the rats were ensured by a protocol approved by the IACUC of North South University, Bangladesh (ACE‐029‐2021). The rats were arbitrarily arranged into 4 groups; each group consisted of 7 animals.
- Control: Consumed standard diet for rats
- Control + PEF: Consumed standard diet supplemented with 2% (w/w) PEF
- HFD: Consumed HFD
- HFD + PEF: Consumed HFD supplemented with 2% (w/w) PEF
The feeding was continued for 8 weeks. Body weight change and food and water intake were monitored daily throughout the treatment period [46].
2.8. Measurement of Blood Glucose, Collection of Serum, Liver, and Adipose Tissues
At the end of the 8‐week treatment period, the fasting blood sugar (FBS) level was checked using a Bionime GM700S glucometer (Berneck, Switzerland). The rats were then euthanized by ketamine injection (100 mg/kg, SC) and sacrificed for blood and other sample collection. The serum was separated by centrifugation (at 8000 × g) of the blood for 15 min and stored at −18°C for later investigations. The fatty tissue attached to the surface of the liver was separated, and the wet weight was recorded. A portion of hepatic tissue from each rat was also collected for the extraction of RNA, and another portion was stored in 10% neutral buffered formalin (NBF) for liver histology. The peritoneal, epididymal, and mesenteric adipose tissues were collected cautiously and rinsed with cooled PBS, and then, the weights were taken according to a previous report [47].
2.9. Oxidative Stress and Plasma Lipid Assessment
The concentration of MDA was assayed spectrophotometrically by detecting a complex between MDA and thiobarbituric acid [48]. Griess reagent, which consists of an acidic solution of 1.5% (w/v) sulfanilamide and 1% (w/v) N‐(1) naphthyl ethylenediamine (NED), was used to measure the plasma level of nitric oxide. The absorbance of the pink complex (λmax = 548 nm) was measured, and the plasma NO level was computed using a standard curve [49]. Advanced oxidation protein product (AOPP) concentration was measured at 340 nm according to a previous method [50]. Ellman’s reagent was used to assay the concentration of reduced glutathione (GSH) in the samples, which measures the absorbance of a yellow anion of 2‐nitro‐5‐thiobenzoic acid (TNB) at 410 nm [51]. SOD activity was recorded at 560 nm by following the procedure developed by Kakkar et al. with some modifications [52]. The activity of catalase was measured using a commercial kit by Abcam (Cambridge, UK), which measures the concentration of remnant hydrogen peroxide as a function of enzymatic activity. In this method, unreacted H_2_O_2_ reacts with a probe to produce a complex that can be measured at 570 nm [53]. The concentrations of TC, TG, LDLC, and HDLC were assayed in plasma samples using the diagnostic kits of Plasmatec Laboratories (Allington, UK).
2.10. Quantification of Gene Expression
An RNA extraction kit of ThermoFisher Scientific (USA) was used to isolate mRNA from hepatic tissue. After measuring the concentration of mRNA using NanoDrop2000 (Bio‐Rad, USA), 1 μg mRNA from each rat was utilized as a template to generate complementary DNA using a cDNA Synthesis Kit (ThermoFisher Scientific) in a thermal cycler. The cDNA was then used for qPCR using a qPCR Master Mix purchased from Thermo Scientific (USA). To quantify the transcript levels of target genes, forward and backward primers were designed using the Primer3Plus online tool and are listed in Table 1. Real‐time PCR was performed using the program developed by Khan et al. [54] using the PCR system of Bio‐Rad Laboratories Inc. (California, USA). The data were collected and analyzed, and transcript levels were calculated using CFX ManagerTM, which was developed by the same manufacturer. The mRNA levels of the target protein were assessed by normalizing to the mRNA level of β‐actin for the same sample.
2.11. Histology
For the histopathological evaluation of the effect of P. emblica on HFD‐induced adipogenesis, the hepatic tissues of rats from each group were fixed in 10% NBF, followed by ethanol and xylene treatment. The tissues were carefully embedded in paraffin slabs. The tissues were then cut with a microtome into thin (5 μm) transparent slices, which were subsequently attached to glass slides and then stained with hematoxylin/eosin (H&E). All slides with stained tissues were photographed and analyzed carefully under a light microscope at 40× magnification (ZEISS Axioscope) [55]. Additionally, the percentage of area covered by lipids in a specific photograph was measured using ImageJ software for quantitative analysis.
2.12. Statistical Analysis
The in vitro analysis of P. emblica powder (PEF) extract was done in triplicate (n = 3). In vivo tests including body weight change, biochemical assay, and the quantification of mRNA levels were carried out in sextuplicate (n = 6). The results are shown as mean ± standard error of the mean (SEM). For the detection of significant variation between 2 groups, data were analyzed by one‐way ANOVA using GraphPad Prism.
3. Results
3.1. Evaluation of Pharmacokinetic and Medicinal Properties of Selected Compounds
The molecular weight, number of hydrogen bond acceptors (HBA), number of hydrogen bond donors (HBD), octanol/water partition coefficient value (WLOGP), TPSA, number of Lipinski’s violations (LVs), solubility, and bioavailability score (BS) of 21 compounds obtained from the SWISSADME analysis are listed in Table 2. Additional properties such as the ability to inhibit several cytochrome enzymes, lead‐likeness, and synthetic accessibility are presented in Supporting Table 3 (S3). Among the 21 selected compounds, 16 were found to be bioavailable after oral administration, as suggested by the BSs (Table 2) and the Eagan BOILED‐Egg model (Figure 1). The bioavailable compounds include gallic acid, ellagic acid, betaine, quercetin, trigonelline, myricetin, leucine, kaempferol, quinic acid, catechin, caffeic acid, chrysin, malic acid, coumaric acid, methyl gallate, and betulinic acid. Moreover, chrysin and coumaric acid could enter the brain through the BBB (Figure 1). However, five compounds: myricitrin, paromomycin, rutin, ellagitannin, and pedunculagin were not found in the “BOILED‐Egg” due to their poor gastrointestinal absorption characteristics and high TPSA values (> 150) (Table 2). These 5 compounds also have greater violation (≥ 2) of Lipinski’s rule of five and low BSs (Table 2). Therefore, these compounds were not considered for further in silico analysis. Hence, molecular docking studies were conducted on these 16 compounds.
Egan’s BOILED‐egg model of selected phytochemicals of P. emblica fruit. The model was constructed by plotting the octanol/water partition coefficient value (WLOGP) as a function of topological polar surface area (TPSA). The white area represents a high possibility of passive diffusion through the gastrointestinal tract, and the yellow area indicates a high chance of brain penetration. The compounds indicated by the blue circle are substrate and red circle are nonsubstrate of p‐glycoprotein (PGP), an ATP‐binding cassette transporter protein, involved in the movement of molecules across the cell membrane.
3.2. Interactions of Selected Molecules With Target Proteins
All 16 compounds from P. emblica with acceptable pharmacokinetic properties and drug‐likeness were subjected to molecular docking studies with eight proteins, as described in the materials and methods section. Atorvastatin, a lipid‐lowering statin, was used as a standard for comparison. Quercetin, kaempferol, catechin, and chrysin strongly interacted with SREBP‐2 (Table 3 and Figure 2). Chrysin also interacted with RXRα and LXRα strongly (Table 3 and Figure 3). Ellagic acid and quercetin strongly interacted with FABP4 (Table 3 and Figure 3). The docking scores of protein ligand interaction, obtained from “AutoDock Vina,” are considered strong when they are lower than −8.0 kcal/mol [56]. The docking scores (AKA binding energy or binding score) of 5 bioactive molecules that interacted strongly with the abovementioned proteins are listed as minimum binding energies, expressed as kcal/mol, and are presented in Table 3. All four flavonoids (catechin, chrysin, kaempferol, and quercetin) found in HPLC analysis of PEF strongly interacted with SREBP‐2 (Figure 2). Both LXRα and RXRα strongly interacted with chrysin; however, FABP4 strongly interacted with both ellagic acid and quercetin (Figure 3).
Interactions of quercetin, kaempferol, catechin, and chrysin with sterol regulatory element‐binding protein 2 (SREBP‐2). Output obtained from top 5 docking poses between SREBP‐2 and corresponding ligand using CB Dock 2 server. The ligand‐binding pose demonstrated the highest affinity of binding with the least root mean square deviation (RMSD) with a value of ≤ 2 Å. The protein–ligand interaction in 3D structures was visualized in Discovery Studio, Version 21 (BIOVIA, Germany). The left panel indicates the surface model, the middle panel cartoon model, and the right panel 2D models of the protein–ligand interaction. In this figure, A1, A2, and A3 demonstrate the interaction of SREBP2 with quercetin; B1, B2, and B3 with kaempferol; C1, C2, and C3 with catechin; and D1, D2, and D3 with chrysin.
Interactions of LXRα with chrysin, RXRα with chrysin, FABP4 with ellagic acid, and FABP4 with quercetin. Output obtained from top 5 docking poses between protein and corresponding ligand using CB Dock 2 server. The ligand‐binding pose demonstrated the highest affinity of binding with the least root mean square deviation (RMSD) with a value of ≤ 2 Å. The protein–ligand interaction in 3D structures was visualized in Discovery Studio, Version 21 (BIOVIA, Germany). The left panel indicates the surface model, the middle panel cartoon model, and the right panel 2D models of the protein–ligand interaction. In this figure, A1, A2, and A3 demonstrate the interaction between LXRα and chrysin; B1, B2, and B3 between RXRα and chrysin; C1, C2, and C3 between FABP4 and ellagic acid; and D1, D2, and D3 between FABP4 and quercetin.
3.3. TPC and TFC and Antioxidant Activity Assay
The TPC and TFC of PEF were found to be 213.3 ± 8.2 mg GAE/g (gallic acid equivalent per gram extract) and 57.4 ± 5.7 mg QE/g (quercetin equivalent per gram extract). These values indicate that the extract prepared from the dried powder of P. emblica fruit is a rich source of phenolic compounds along with a substantial amount of flavonoids, due to which PEF exhibited strong antioxidant activity. The DPPH radical scavenging activity of PEF is slightly higher than that of BHT, although significantly (p < 0.05) lower than that of ascorbic acid. However, PEF exhibited significantly (p < 0.05) higher ABTS radical scavenging and ferric‐reducing antioxidant activities than BHT. On the other hand, ascorbic acid outperformed PEF in all of the aforementioned activities (Table 4).
3.4. HPLC Detection of Polyphenolic Phytochemicals
By considering the bioavailability characteristics, drug‐likeness, and strong interaction with target proteins, as observed in the in silico study, we attempted to detect the presence of several compounds using HPLC. In the comparison of the retention time from the chromatograms of the extract prepared by P. emblica dried fruit powder with the chromatogram of standard stock solutions, we detected the presence of seven compounds, including one phenolic acid (gallic acid), one amino acid (leucine), one polyphenol (ellagic acid), and four flavonoids (catechin, chrysin, kaempferol, and quercetin) (Figure 4). The chromatogram of the 16 standard compounds is included in the Supporting Figure (available here). The amount of gallic acid, catechin, ellagic acid, and quercetin in the extract of P. emblica fruit was relatively higher than that of leucine, kaempferol, and chrysin (Table 5). The chromatographic detection of compounds was repeated 3 times, and one of the representative chromatograms is shown in Figure 4.
HPLC chromatogram of ethanolic extract of the dried powder of P. emblica fruit. Peaks: 1, gallic acid; 2, leucine; 3, catechin; 4, ellagic acid; 5, chrysin; 6, kaempferol; 7, quercetin.
3.5. Effect of PEF on the Consumption of Food, Body Weight, and Fat Weight
The changes in body weight, liver wet weight, and fat weight due to changes in feeding are presented in Table 6. HFD‐induced gains in body weight, liver weight, and adipose tissue weight were not associated with the quantity of food but rather with the calorie content of the food, which was related to its constituents. Consumption of a 2% PEF‐supplemented HF diet significantly changed the mesenteric fat weight (p < 0.05) (Table 5). However, PEF‐supplemented HFD did not alter the HFD‐mediated increases in body weight and liver weight, as well as epididymal and peritoneal fat deposition. Similarly, consumption of a 2% PEF‐supplemented normal diet did not change any of these parameters, including mesenteric fat weight, significantly in comparison with the control diet group (Table 6).
3.6. Effect of PEF on HFD‐Induced Oxidative Stress
Due to HFD feeding, the plasma concentrations of MDA, nitric oxide (NO), and AOPP increased markedly (p < 0.05). On the other hand, the level of endogenous antioxidants, GSH, and the activity of antioxidant enzymes such as SOD and catalase were significantly decreased by HFD feeding. Feeding 2% PEF‐supplemented HFD resulted in a marked (p < 0.05) augmentation of the activity of SOD and catalase. Consequently, the reduction in oxidative stress was revealed as a significant lowering of the levels of MDA, NO, and AOPP. Additionally, HFD‐mediated depletion of GSH was replenished markedly (p < 0.05) due to PEF feeding. Similar to the previous cases, consumption of 2% PEF with a normal diet did not affect these oxidative stress parameters, indicating the efficacy of PEF supplementation only under stressful conditions (Figure 5).
Effect of 2% (w/w) dried powder of P. emblica fruit (PEF) supplementation either with normal diet or with high‐fat diet on oxidative stress parameters such as MDA (a), NO (b), AOPP (c), GSH (d), SOD activity (e), and catalase activity (f). The rats were provided with any one of the four diets: normal diet (Control), control diet containing 2% (w/w) dried powder of P. emblica fruit (Control + PEF), high‐fat diet (HFD), or HFD containing 2% PEF (HFD + PEF). Values are shown as mean ± SEM, n = 6. For comparison, one‐way ANOVA was conducted which was followed by Newman–Keuls multiple comparison tests. Mean values are considered significantly different when p < 0.05, which is represented by an asterisk (∗).
3.7. Hypolipidemic and Hypoglycemic Effects of P. emblica Fruit
To explore the hypolipidemic and hypoglycemic effects of the PEF‐supplemented diet, triglyceride (TG), TC, LDLC, HDLC, and FBS levels were measured. Consumption of HFD led to a marked increase in all of these parameters, except HDLC, which was reduced in HFD‐consuming rats. Feeding of 2% (w/w) PEF‐supplemented HFD significantly (p < 0.05) reduced the levels of TC, LDLC, TG, and FBS. In contrast, the HFD‐suppressed level of HDLC in the plasma was restored by the addition of 2% PEF powder in the HFD. However, consumption of 2% PEF‐supplemented standard diet (Control + PEF) could not change these parameters significantly (Table 7).
3.8. Effects of P. emblica on the Expression of Target Genes
Feeding with an HFD substantially (p < 0.05) augmented the gene expression of SREBP‐1c and SREBP‐2, LXRα, PPARγ, HMGCR, and FABP4. However, the gene expression of RXRα was not changed and the expression of LDL receptor (LDLR) was downregulated by HFD feeding. The consumption of 2% PEF with HFD downregulated the transcript levels of SREBP‐1c, SREBP‐2, and HMGCR compared with the HFD‐fed rats. On the other hand, the HFD‐mediated suppression of LDLR was restored by treatment with PEF together with HFD. However, the HFD‐mediated enhancement of the mRNA levels of PPARγ, LXRα, and FABP4 remained unchanged by the feeding of PEF (Figure 6). The expression of the aforementioned proteins remained similar both in the control and in 2% PEF‐supplemented control diet groups (Figure 6).
Effect of 2% (w/w) dried powder of P. emblica fruit (PEF) supplementation either with normal diet or with high‐fat diet on adipogenesis controlling transcription factors, enzymes, and receptor proteins. The rats were provided with any one of the four diets: normal diet (control), control diet containing 2% (w/w) dried powder of P. emblica fruit (Control + PEF), high‐fat diet (HFD), or HFD containing 2% PEF (HFD + PEF). After 8 weeks of feeding, the rats were sacrificed and mRNA was extracted from the hepatic tissue, followed by mRNA measurement and cDNA synthesis using 1 μg mRNA from each sample. Specific primers and a quantitative PCR system were used to quantify the mRNA levels of the corresponding genes, which were normalized to the mRNA levels of β‐actin. Values are shown as mean ± SEM, n = 6. For comparison, one‐way ANOVA was conducted which was followed by Newman–Keuls multiple comparison tests. Mean values are considered significantly different when p < 0.05, which is represented by an asterisk (∗).
3.9. Effects of Phyllanthus emblica on Hepatic Fat Accumulation
The hypolipidemic effect of the PEF‐supplemented diet was also evaluated by H&E staining of hepatic tissues. As revealed in the photomicrographs, the number and size of lipid droplets (LDs) increased markedly (p < 0.05) because of the consumption of an HFD. Feeding a PEF‐supplemented diet did not change the number and size of LDs (Figure 7), suggesting the validity of a nonsignificant reduction in liver weight due to the consumption of PEF‐supplemented HFD (Table 6). The photomicrographs were also analyzed using ImageJ software, which converts the changes into quantitative data suitable for statistical comparisons. Similar to the photomicrographs, feeding with PEF‐supplemented HFD did not alter the HFD‐induced lipid accumulation in the liver (Figure 7(e)).
Figure 7. Photomicrographs (a–d) displaying the accumulation of lipid in the hepatic tissue of Wistar rats that were fed with any one of the following diets: normal diet (Control), control diet containing 2% (w/w) dried powder of P. emblica fruit (Control + PEF), high‐fat diet (HFD), or HFD containing 2% PEF (HFD + PEF). Lipid droplets (LDs) were captured in 40× magnification by an optical microscope (Carl Zeiss). Additionally, the percentage of the area taken up by the lipid droplets (e) was measured using ImageJ software. To determine the statistical significance, the percent area was compared in one‐way ANOVA followed by Newman–Keuls’s post hoc test and expressed as mean ± SEM (n = 3).(a)(b)(c)(d)(e)
4. Discussion
Hyperlipidemia involves the activation of signal transduction mechanisms triggered by several transcription factors. Among these factors, SREBP‐1c and SREBP‐2, RXRα, LXRα, and PPARγ are of pivotal importance [29, 57]. These factors control the expression of some enzymes and receptors such as HMGCR, LDLR, and FABP4, which have crucial roles in lipid metabolism, homeostasis, and storage [58–60]. These enzymes and receptors and their regulatory factors are strongly modulated by oxidative stress and HFD consumption [61]. An HFD induces oxidative stress and lipid metabolism abnormalities due to HFD‐mediated suppression of SOD, catalase, and GPx, leading to reduced peroxide and superoxide degradation and consequent increase in ROS levels [62, 63]. This increased level of ROS intensifies chronic inflammation and lipid metabolism abnormalities, leading to hyperlipidemia. The interplay between hyperlipidemia and oxidative stress creates a self‐perpetuating pathogenic loop that leads to several cardiovascular diseases [64]. Scientific innovations have enabled the discovery and synthesis of antihyperlipidemic drugs. However, their therapeutic benefits are often compromised by harmful side effects. As a result, there has been a growing body of research focusing on screening medicinal plants, aimed at identifying phytochemicals with antioxidant and lipid‐lowering properties.
Numerous natural compounds, especially antioxidant‐type phytochemicals, have been investigated in the last few decades to identify potential lipid‐lowering molecules [65]. The fruit pulp of P. emblica contains a substantial amount of vitamins, tannins, saponins, phenolics, flavonoids, and alkaloids; many of which possess remarkable antioxidant activity [66]. In the present investigation, our results demonstrated that the antioxidant capacity of P. emblica fruit was significantly (p < 0.05) higher than that of BHT, although it was lower than that of ascorbic acid (Table 4). This improved antioxidant activity is likely attributable to the presence of several phenolic compounds and flavonoids of PEF, as was confirmed by HPLC analysis (Figure 4). In agreement with our observation, researchers through HPLC, GC‐MS, and LC‐MS techniques confirmed the presence of gallic acid, ellagic acid, quercetin, chrysin, myricitrin, myricetin, kaempferol, ferulic acid, cinnamic acid, caffeic acid, coumaric acid, quinic acid, and catechin in the fruit of Emblica officinalis and Phyllanthus emblica [9, 10, 67]. Studies have also confirmed the in vitro and in vivo antioxidant properties and the health benefits of these phenolic compounds [68]. Therefore, we predicted that a phenolic and flavonoid‐rich PEF‐supplemented diet may also suppress oxidative stress in vivo, as it does in vitro (Table 4). Subsequently, in our animal study, we also observed that a PEF‐enriched diet restored the depleted level of GSH with a simultaneous increase in the activities of catalase and SOD. The enhanced antioxidant capacity of PEF supplementation was reflected by the reduced concentrations of MDA, nitric oxide (NO), and AOPP (Figure 5). The aforementioned studies and our observations suggest the importance of exploring the molecular mechanisms of these phytochemicals to understand their roles in HFD‐induced oxidative stress and hyperlipidemia. However, very little has been done in this regard, and therefore, the molecular mechanism of these beneficial phytochemicals remains poorly understood.
In understanding the molecular mechanisms of various phytochemicals, the use of computer‐aided drug design has impressively supported the ongoing efforts of discovering novel, safe, and effective drug‐like lead compounds for many ailments. The combination of in silico approaches with in vitro and in vivo empirical knowledge about natural products has made drug discovery and development processes faster and less expensive [69]. In this study, through a literature survey, 21 compounds of P. emblica were selected for in silico investigations based on their antioxidant, anti‐inflammatory, lipid‐lowering, and glucose‐lowering effects (Supporting Table 1). Out of those 21 compounds, 16 were found to possess acceptable bioavailability characteristics and drug‐likeness (Table 2). Moreover, two compounds, coumaric acid and chrysin, were able to cross the BBB (Figure 3), which may offer additional benefits by protecting the BBB or ameliorating HFD‐induced oxidative stress and neuroinflammatory damage. In agreement with our prediction, researchers have reported that coumaric acid increases BBB integrity by increasing the expression of occludin in hypoxic mice [70]. Similarly, chrysin ameliorates brain injury‐induced BBB disruption, reduces brain edema, and prevents neuron loss [71]. Additionally, other polyphenols of PEF, including quercetin, kaempferol, and rutin, contribute to the protection of the BBB through their antioxidant and anti‐inflammatory properties [72]. Therefore, molecular docking studies were conducted on these 16 compounds. By considering binding affinities determined by molecular docking studies, we observed that 5 phytochemicals of P. emblica, such as quercetin, kaempferol, catechin, ellagic acid, and chrysin, potentially interact with 8 important proteins strongly associated with hyperlipidemia (Table 3). These proteins include SREBP‐1c, SREBP‐2, RXRα, LXRα, PPARγ, HMGCR, LDLR, and FABP4. Moreover, these proteins also interacted with the remaining 11 phytochemicals of PEF (Table 3). These observations obtained from the in silico study suggest that the already reported antihyperlipidemic and antihyperglycemic activity of P. emblica fruit can be attributed to the possible interaction of its phytochemicals with the aforementioned eight proteins. However, in silico predictions should be validated by in vivo investigations at the transcriptional level to decipher the mechanism of those phytochemicals’ efficacy in regulating lipid metabolism, transport, and storage.
Therefore, the transcript levels of the aforementioned eight proteins were measured using qPCR to elucidate the mechanism through which the phytochemicals of PEF affect lipid metabolism. We observed that transcript levels of SREBP‐1c, SREBP‐2, LXRα, PPARγ, HMGCR, and FABP4 increased in HFD‐fed rats. These increased expressions were logically connected to the increased levels of plasma lipids, such as TC, LDLC, and TG. Moreover, increased fat accumulation in the adipose and hepatic tissues contributed to the overall gain of body and liver weight in HFD‐consuming rats. Our findings align with those of previous studies in which feeding with HFD increased the harmful blood lipids and body weight in experimental animals by upregulating the expression of SREBP‐1c, SREBP‐2, LXRα, PPARγ, and FABP4 [73–75]. PEF‐supplemented HFD significantly (p < 0.05) lowered the expression of SREBP‐1c, SREBP‐2, and HMGCR compared with HFD‐fed rats (Figure 6). Our findings were in agreement with a study in which Murase et al. observed that catechin‐containing coffee suppressed diet‐induced hypertriglyceridemia in mice through the suppression of SREBP‐1c [76]. Moreover, our observations are in agreement with previous studies in which researchers observed that quercetin reduces hypercholesterolemia and lipid accumulation in adipose tissues through the suppression of SREBP‐2 and HMGCR [59, 77].
In the regulation of lipid metabolism and homeostasis, SREBPs also closely work with LXRα and PPARγ [78]. Considering this interconnection among these crucial transcription factors, we predicted that the HFD‐mediated increased expression of LXRα and PPARγ might be altered by PEF supplementation. However, the gene expression of PPARγ and LXRα was not changed significantly by PEF supplementation compared with the HFD‐fed rats (Figure 6). This inefficacy of PEF in suppressing the expression of PPARγ and LXRα is consistently reflected in the insignificant reduction of epididymal and peritoneal fat weight (Table 6), as well as liver fat accumulation (Figure 7), although the amount of mesenteric fat was reduced significantly (Table 6). Thus, our observation was in agreement with the result of a previous investigation, which demonstrated that increased expression of PPARγ and LXRα is crucial for fat deposition in cultured 3T3‐L1 cells and human adipocytes [79]. This could be, at least partially, due to quercetin in PEF. Feeding of mice with quercetin upregulated LXRα and PPARγ expression in hepatocytes and consequently increased fat accumulation in the liver [80, 81]. Additionally, according to other studies, flavonoids such as quercetin and kaempferol by activating LXRα and PPARγ upregulate the expression of cholesterol efflux proteins such as ATP‐binding cassette transporters (ABCA1 and ABCG1) and Apo‐A1, the constituent protein of HDL particles [82, 83]. Thus, flavonoids, by increasing the expression of cholesterol efflux proteins and HDL particle’s shell protein, elevate the levels of HDLC in the circulation [84].
In contrast to other proteins, HFD‐mediated suppression of LDLR was upregulated significantly due to the feeding of PEF. According to previous reports, flavonoids such as kaempferol and quercetin can upregulate the expression of LDLRs, leading to increased cellular uptake of LDLC from the circulation [85, 86]. This part of our study also complies with a previous investigation in which researchers reported that ellagic acid, quercetin, and myricetin‐containing extract of Basella alba–inhibited HMGCR but stimulated LDLR activity [87]. Hence, the increased expression of LDLR due to PEF feeding might be attributable to its phenolic compounds (Figure 4). Thus, a phenolic and flavonoid‐rich PEF‐supplemented diet by maintaining the upregulated state of PPARγ and LXRα, helped to retain harmful lipids in fat storage, limiting their presence in the circulation [88]. On the other hand, the PEF‐supplemented diet by suppressing the expression of SREBP‐1c, SREBP‐2, and HMGCR, along with the upregulation of LDLR, reduced the levels of harmful lipids in the blood. Therefore, we concluded that although 2% PEF supplementation for 8 weeks effectively reduced HFD‐induced hyperlipidemia, it did not reduce fat storage and consequently body weight. However, the administration of higher doses (> 2%) of PEF for a longer time (> 8 weeks) may result in the reduction of both adipose tissue mass and hyperlipidemia, indicating the need for further investigation.
5. Conclusion
The dried powder of PEF, used in the current study, contains a number of bioactive phenolic compounds, such as gallic acid, ellagic acid, quercetin, kaempferol, catechin, and chrysin among which the latter four compounds are also flavonoid. These compounds possess antioxidant properties, which are further supported by their in vitro antioxidant and radical scavenging activities as well as in vivo suppression of oxidative stress. In silico prediction analysis revealed that these compounds of PEF are bioavailable after oral administration and can interact with several transcription factors, enzymes, and receptors that are strongly connected to lipid metabolism and homeostasis. Through its higher phenolic content and strong antioxidant properties, PEF downregulated the expression of SREBP‐1c, SREBP‐2, and HMGCR, along with the upregulation of LDLR expression. All these effects culminated in the reduced concentration of harmful lipids in the blood. Despite the lowering of harmful plasma lipid levels, body weight, adipose tissue weight, and liver fat accumulation were not reduced significantly. This outcome justifies the inefficacy of PEF in modulating the expression of LXRα and PPARγ. Polyphenolics‐mediated augmented expression of these factors helped not only to maintain higher levels of HDLC but also to retain harmful lipids in storage locations, preventing hyperlipidemia. Taking all these observations together, we concluded that PEF‐mediated suppression of gene expression of SREBP‐1c and SREBP‐2 and consequent suppression of HMGCR along with upregulation of LDLR played central roles in ameliorating HFD‐induced hyperlipidemia in Wistar rats. The bioactive constituents of P. emblica fruit such as ellagic acid, quercetin, kaempferol, chrysin, and catechin can be the starting lead compounds with a high possibility for the development of antihyperlipidemic drugs with specific targeted pharmacological activities and minimal adverse effects [89–92].
Disclosure
All authors have read and approved the final manuscript.
Conflicts of Interest
The authors declare no conflicts of interest.
Author Contributions
Syed Abdul Kuddus: experimental design, investigation, in silico study, and data analysis. Md. Hasanuzzaman Shohag: investigation and HPLC analysis. Quamrul Islam Yaseen: animal feeding and investigation. Labiba Ahmed: animal feeding and investigation. Anika Tabassum Kashfia: animal feeding and investigation. Fatema Binte Islam: animal feeding and investigation. Sabrin Islam Khan: investigation and phytochemical assay. Reatul Karim: experimental design, writing, and editing. Muhammad Maqsud Hossain: RNA isolation and quantitative real‐time PCR. Md. Ashraful Alam: conceptualization, experimental design, and data analysis. Ferdous Khan: conceptualization, experimental design, data analysis, writing–original draft, and supervision.
Funding
This project was funded by the North South University Research Grant Cycle 2019‐20, allocated for Ferdous Khan (ID: CTRG‐19/SHLS/24).
Supporting Information
Supporting Figure: 1. Gallic acid, 2. quinic acid, 3. leucine, 4. malic acid, 5. catechin, 6. coumaric acid, 7. betaine, 8. trigonelline, 9. ellagic acid, 10. caffeic acid, 11. chrysin, 12. myricetin, 13. methyl gallate, 14. kaempferol, 15. quercetin, and 16. betulinic acid.
Supporting Table 1: Pharmacological activities of several compounds present in the Phyllanthus emblica fruit pulp.
Supporting Table 2: Composition of the normal diet (Control), the HFD, normal diet supplemented with 2% (w/w) dried powder of P. emblica fruit (Control + PEF), and HFD supplemented with 2% (w/w) dried powder of P. emblica fruit (HFD + PEF).
Supporting Table 3: Cytochrome enzyme inhibitory activities, lead‐likeness, and synthetic accessibility of selected compounds of P. emblica fruit predicted by SWISS prediction tool.
Supporting information
Supporting Information Additional supporting information can be found online in the Supporting Information section.
The reference list from the paper itself. Each links out to its DOI / PubMed record.
- 1Halpern A. , Mancini M. C. , Magalhães M. E. C. et al., Metabolic Syndrome, Dyslipidemia, Hypertension and Type 2 Diabetes in Youth: From Diagnosis to Treatment, Diabetology & Metabolic Syndrome. (2010) 2, no. 1, 1–20, 10.1186/1758-5996-2-55, 2-s 2.0-77956692453.20718958 PMC 2939537 · doi ↗ · pubmed ↗
- 2Hill M. F. and Bordoni B. , Hyperlipidemia, Stat Pearls [Internet]. (2022) Stat Pearls Publishing, Treasure Island, FL.
- 3Hedayatnia M. , Asadi Z. , Zare-Feyzabadi R. et al., Dyslipidemia and Cardiovascular Disease Risk Among the MASHAD Study Population, Lipids in Health and Disease. (2020) 19, 1–11, 10.1186/s 12944-020-01204-y.32178672 PMC 7075010 · doi ↗ · pubmed ↗
- 4Nelson R. H. , Hyperlipidemia as a Risk Factor for Cardiovascular Disease, Primary Care: Clinics in Office Practice. (2013) 40, no. 1, 195–211, 10.1016/j.pop.2012.11.003, 2-s 2.0-84873586706.23402469 PMC 3572442 · doi ↗ · pubmed ↗
- 5Zodda D. , Giammona R. , and Schifilliti S. , Treatment Strategy for Dyslipidemia in Cardiovascular Disease Prevention: Focus on Old and New Drugs, Pharmacy. (2018) 6, no. 1, 10.3390/pharmacy 6010010.PMC 587454929361723 · doi ↗ · pubmed ↗
- 6Ahmed K. , Jahan I. , Jahan F. , and Hossain H. , Antioxidant Activities and Simultaneous HPLC-DAD Profiling of Polyphenolic Compounds From Moringa oleifera Lam. Leaves Grown in Bangladesh, Food Research. (2021) 5, no. 1, 401–408, 10.26656/fr.2017.5(1).410. · doi ↗
- 7Gul M. , Liu Z.-W. , Rabail R. et al., Functional and Nutraceutical Significance of Amla (Phyllanthus emblica L.): A Review, Antioxidants. (2022) 11, no. 5, 10.3390/antiox 11050816.PMC 913757835624683 · doi ↗ · pubmed ↗
- 8Mirunalini S. and Krishnaveni M. , Therapeutic Potential of Phyllanthus emblica (Amla): The Ayurvedic Wonder, Journal of Basic and Clinical Physiology and Pharmacology. (2010) 21, no. 1, 93–105, 10.1515/jbcpp.2010.21.1.93, 2-s 2.0-77953153977.20506691 · doi ↗ · pubmed ↗