Comparative Effectiveness of Sodium-Glucose Cotransporter-2 (SGLT2) Inhibitors Versus Glucagon-Like Peptide-1 (GLP-1) Agonists on Cardiovascular and Renal Outcomes in Type 2 Diabetes: A Systematic Review and Network Meta-Analysis
Aymen A Alqurain, Manal Salem, Bashayer A Algarzai, Eman M Eljadi, Hazem S Elsayed, Ahmed Almuhanna, Deema S Albuhayji, Mohammad Salami, Joud Alzahrani, Juri Alsayyali, Abdulrahman Alqarni, Nessreen Alqahtani, Fay T Alotaibi, Gharam G Alyami

TL;DR
This study compares two diabetes drugs, SGLT2 inhibitors and GLP-1 agonists, finding that both reduce heart risks equally, but SGLT2 inhibitors better protect against heart failure and kidney disease.
Contribution
The study provides the first network meta-analysis comparing SGLT2 inhibitors and GLP-1 agonists for cardiovascular and renal outcomes in T2DM.
Findings
SGLT2 inhibitors and GLP-1 agonists equally reduce MACE compared to placebo.
SGLT2 inhibitors are more effective in reducing heart failure and renal outcomes.
GLP-1 agonists have a better safety profile for genital infections and ketoacidosis.
Abstract
Sodium-glucose cotransporter-2 (SGLT2) inhibitors and glucagon-like peptide-1 (GLP-1) receptor agonists reduce cardiovascular and renal risks in type 2 diabetes mellitus (T2DM), but their relative efficacy remains uncertain due to the absence of direct comparative trials. This systematic review and network meta-analysis aimed to evaluate the efficacy and safety of interventions concerning major adverse cardiovascular events (MACE), heart failure, and renal outcomes. A systematic review and network meta-analysis of large-scale, placebo-controlled cardiovascular outcome trials was conducted. PubMed, Embase, and CENTRAL were searched for trials published up to December 2025. The primary outcome was MACE (cardiovascular death, nonfatal myocardial infarction, or nonfatal stroke). The secondary outcomes included hospitalization for heart failure (HHF), composite renal outcomes, and all-cause…
Genes, proteins, chemicals, diseases, species, mutations and cell lines named across the full text — each resolved to its canonical identifier and authoritative record.
Click any figure to enlarge with its caption.
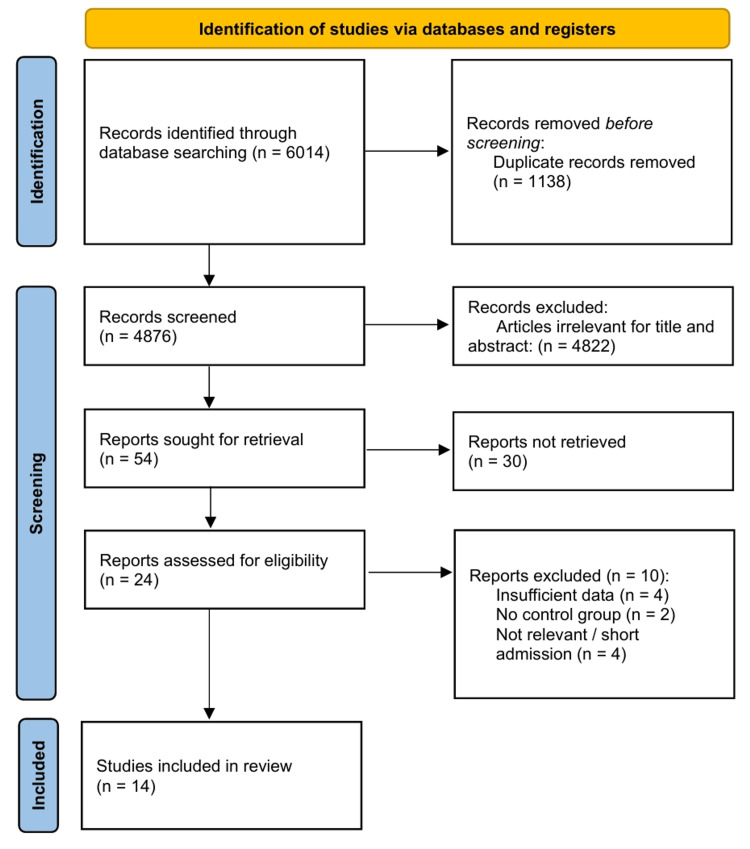 Figure 1
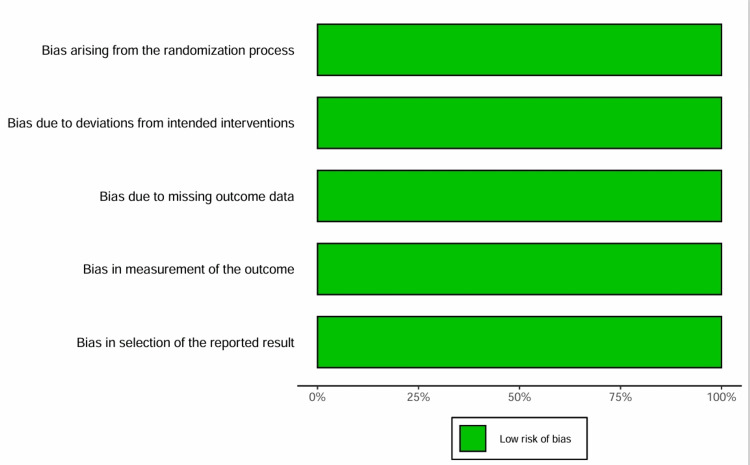 Figure 2
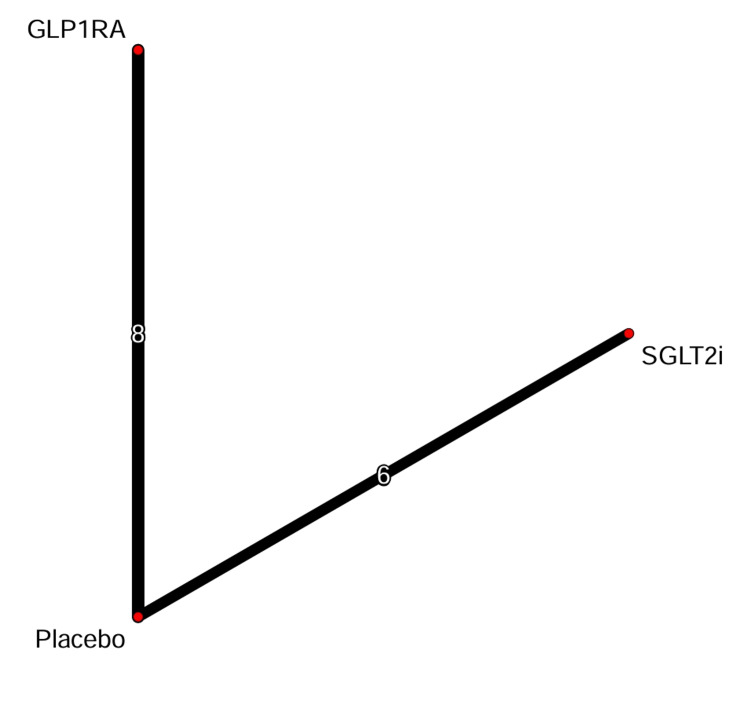 Figure 3
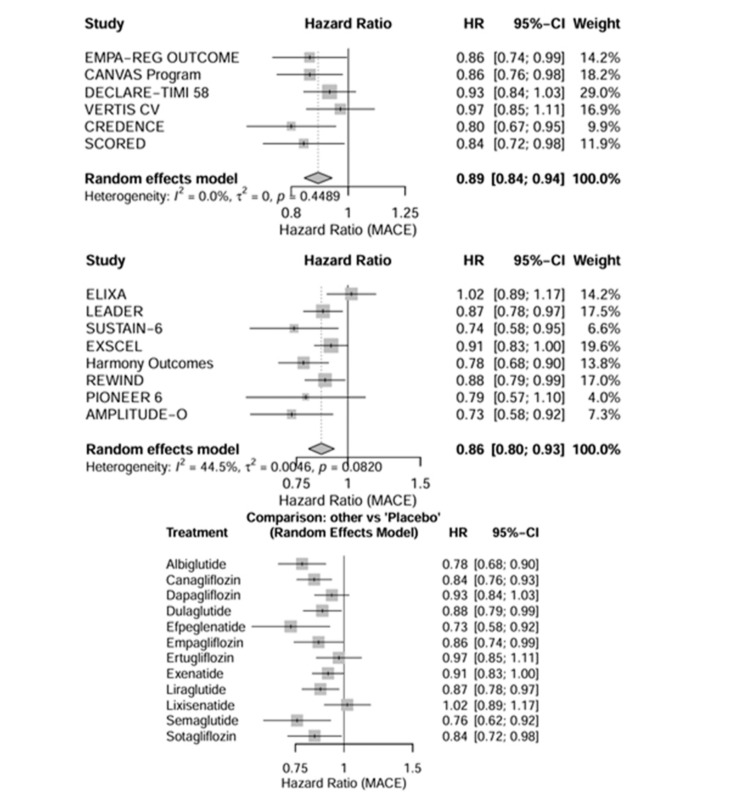 Figure 4
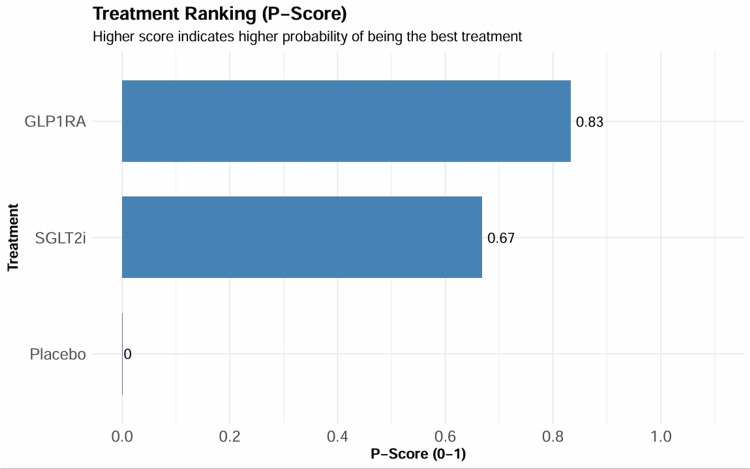 Figure 5
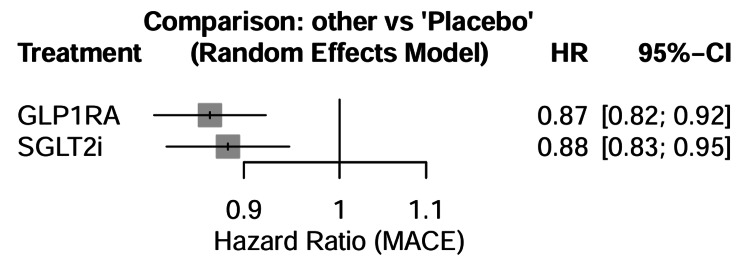 Figure 6
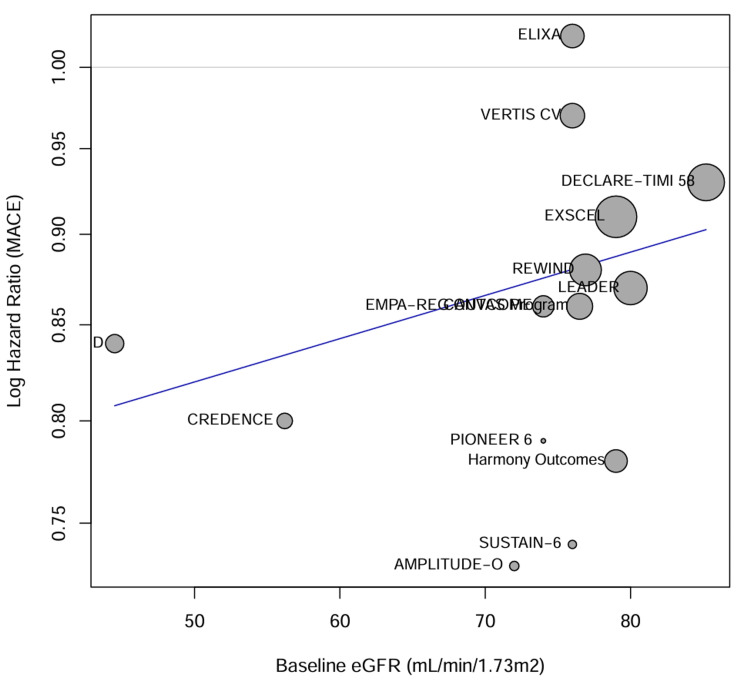 Figure 7
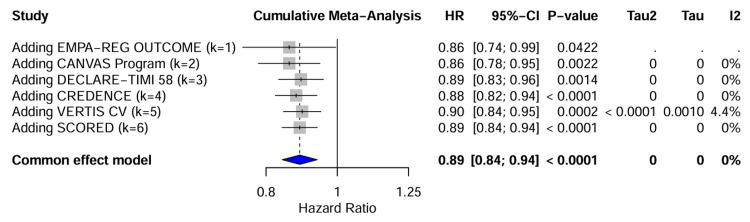 Figure 8
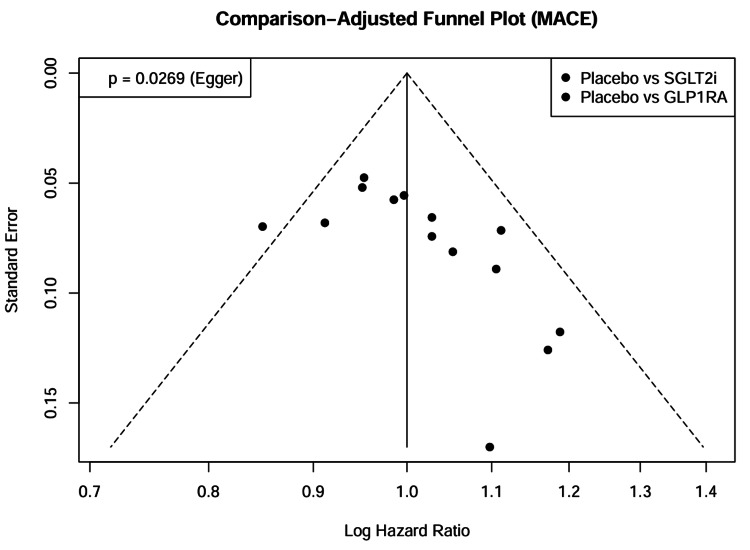 Figure 9
| Study ID | Drug class | Intervention | Comparator | Total, N | Median follow-up (years) | Mean age (years) | Female (%) | Mean baseline HbA1c (%) | Baseline eGFR (mL/minute/1.73m²) | Established CV disease (%) | Primary outcome |
| SGLT2 inhibitor trials | |||||||||||
|
Zinman et al. (EMPA-REG OUTCOME) [ | SGLT2i | Empagliflozin (10 mg or 25 mg) | Placebo | 7,020 | 3.1 | 63.1 | 28.5 | 8.1 | 74.0 | 99.0% | 3-point MACE |
|
Neal et al. (CANVAS Program) [ | SGLT2i | Canagliflozin (100 mg or 300 mg) | Placebo | 10,142 | 3.6 | 63.3 | 35.8 | 8.2 | 76.5 | 65.6% | 3-point MACE |
|
Wiviott et al. (DECLARE-TIMI 58) [ | SGLT2i | Dapagliflozin (10 mg) | Placebo | 17,160 | 4.2 | 63.9 | 37.4 | 8.3 | 85.2 | 40.6% | 3-point MACE and CV death/HHF |
|
Cannon et al. (VERTIS CV) [ | SGLT2i | Ertugliflozin (5 mg or 15 mg) | Placebo | 8,246 | 3.5 | 64.4 | 30.0 | 8.2 | 76.0 | 99.9% | 3-point MACE |
|
Perkovic et al. (CREDENCE) [ | SGLT2i | Canagliflozin (100 mg) | Placebo | 4,401 | 2.6 | 63.0 | 33.9 | 8.3 | 56.2 | 50.4% | Renal composite |
|
Heerspink et al. (DAPA-CKD)* [ | SGLT2i | Dapagliflozin (10 mg) | Placebo | 4,304* | 2.4 | 61.8 | 33.1 | 7.1 | 43.1 | 37.4% | Renal composite |
|
Herrington et al. (EMPA-KIDNEY)* [ | SGLT2i | Empagliflozin (10 mg) | Placebo | 6,609* | 2.0 | 63.8 | 33.2 | N/A† | 37.3 | 26.6% | Renal progression or CV death |
|
Bhatt et al. (SCORED) [ | SGLT1/2i | Sotagliflozin (200–400 mg) | Placebo | 10,584 | 1.3 | 69.0 | 44.9 | 8.3 | 44.5 | ~100%‡ | CV death, HHF, urgent HF visit |
|
Bhatt et al. (SOLOIST-WHF) [ | SGLT1/2i | Sotagliflozin (200–400 mg) | Placebo | 1,222 | 0.75 | 69.0 | 34.0 | 7.1 | 50.0 | 100% | CV death, HHF, urgent HF visit |
|
McMurray et al. (DAPA-HF)* [ | SGLT2i | Dapagliflozin (10 mg) | Placebo | 4,744* | 1.5 | 66.0 | 23.0 | N/A† | 66.0 | ~100% (HF) | Worsening HF or CV death |
|
Packer et al. (EMPEROR-Reduced)* [ | SGLT2i | Empagliflozin (10 mg) | Placebo | 3,730* | 1.3 | 67.0 | 24.0 | N/A† | 62.0 | ~100% (HF) | CV death or HHF |
|
Solomon et al. (DELIVER)* [ | SGLT2i | Dapagliflozin (10 mg) | Placebo | 6,263* | 2.3 | 72.0 | 44.0 | N/A† | 61.0 | ~100% (HF) | Worsening HF or CV death |
|
Anker et al. (EMPEROR-Preserved)* [ | SGLT2i | Empagliflozin (10 mg) | Placebo | 5,988* | 2.2 | 72.0 | 45.0 | N/A† | 61.0 | ~100% (HF) | CV death or HHF |
| GLP-1 receptor agonist trials | |||||||||||
|
Pfeffer et al. (ELIXA) [ | GLP-1RA | Lixisenatide (20 µg) | Placebo | 6,068 | 2.1 | 60.0 | 30.6 | 7.7 | 76.0 | 100% (ACS) | 4-point MACE |
|
Marso et al. (LEADER) [ | GLP-1RA | Liraglutide (1.8 mg) | Placebo | 9,340 | 3.8 | 64.3 | 35.8 | 8.7 | 80.0 | 81.3% | 3-point MACE |
|
Marso et al. (SUSTAIN-6) [ | GLP-1RA | Semaglutide SC (0.5 or 1.0 mg) | Placebo | 3,297 | 2.1 | 64.6 | 39.3 | 8.7 | ~76.0 | 83.0% | 3-point MACE |
|
Holman et al. (EXSCEL) [ | GLP-1RA | Exenatide QW (2 mg) | Placebo | 14,752 | 3.2 | 62.0 | 38.0 | 8.0 | ~79.0 | 73.1% | 3-point MACE |
|
Hernandez et al. (Harmony Outcomes) [ | GLP-1RA | Albiglutide (30–50 mg) | Placebo | 9,463 | 1.6 | 64.1 | 30.2 | 8.7 | 79.0 | 100% | 3-point MACE |
|
Gerstein et al. (REWIND) [ | GLP-1RA | Dulaglutide (1.5 mg) | Placebo | 9,901 | 5.4 | 66.2 | 46.3 | 7.3 | 76.9 | 31.5% | 3-point MACE |
|
Husain et al. (PIONEER 6) [ | GLP-1RA | Semaglutide Oral (14 mg) | Placebo | 3,183 | 1.3 | 66.0 | 31.6 | 8.2 | 74.0 | 84.7% | 3-point MACE |
|
Gerstein et al. (AMPLITUDE-O) [ | GLP-1RA | Efpeglenatide (4 or 6 mg) | Placebo | 4,076 | 1.8 | 64.5 | 33.0 | 8.9 | 72.0 | 89.6% | 3-point MACE |
| Study | Drug | MACE definition | Renal composite definition | HHF definition | Events (n/N) |
| SGLT2 inhibitor trials | |||||
| EMPA-REG OUTCOME [ | Empagliflozin | 3-point: CV death, non-fatal MI, non-fatal stroke | Incident/worsening nephropathy: macroalbuminuria, doubling of creatinine, RRT, or renal death | Hospitalization for heart failure | MACE: 490/4687 (Empa) vs. 282/2333 (Pbo) Renal: 525/4124 (Empa) vs. 388/2061 (Pbo)† HHF: 126/4687 (Empa) vs. 95/2333 (Pbo) |
| CANVAS Program [ | Canagliflozin | 3-point: CV death, non-fatal MI, non-fatal stroke | 40% eGFR decline (sustained), RRT, or renal death | Hospitalization for heart failure | MACE: 585/5795 (Cana) vs. 426/4347 (Pbo) Renal: 169/5795 (Cana) vs. 192/4347 (Pbo) HHF: 163/5795 (Cana) vs. 165/4347 (Pbo) |
| DECLARE-TIMI 58 [ | Dapagliflozin | 3-point: CV death, non-fatal MI, non-fatal stroke | ≥40% eGFR decline (sustained), ESKD, or renal/CV death | Hospitalization for heart failure | MACE: 756/8582 (Dapa) vs. 803/8578 (Pbo) Renal: 370/8582 (Dapa) vs. 480/8578 (Pbo) HHF: 212/8582 (Dapa) vs. 286/8578 (Pbo) |
| VERTIS CV [ | Ertugliflozin | 3-point: CV death, non-fatal MI, non-fatal stroke | Doubling of creatinine, RRT, or renal death | Hospitalization for heart failure | MACE: 653/5493 (Ertu) vs. 327/2745 (Pbo) Renal: 175/5499 (Ertu) vs. 108/2747 (Pbo) HHF: 139/5499 (Ertu) vs. 99/2747 (Pbo) |
| CREDENCE [ | Canagliflozin | 3-point: CV death, non-fatal MI, non-fatal stroke‡ | Doubling of creatinine, ESKD, renal death, or CV death | Hospitalization for heart failure | MACE: 217/2202 (Cana) vs. 269/2199 (Pbo) Renal: 245/2202 (Cana) vs. 340/2199 (Pbo) HHF: 89/2202 (Cana) vs. 141/2199 (Pbo) |
| DAPA-CKD (T2DM subgroup) [ | Dapagliflozin | 3-point: CV death, non-fatal MI, non-fatal stroke‡ | ≥50% eGFR decline (sustained), ESKD, renal death, or CV death | Hospitalization for heart failure | MACE: data extraction required from supp. Renal: 152/1455 (Dapa) vs. 229/1451 (Pbo)§ HHF: 56/1455 (Dapa) vs. 88/1451 (Pbo)§ |
| EMPA-KIDNEY (T2DM subgroup) [ | Empagliflozin | 3-point MACE is not the primary endpoint | Progression of kidney disease (≥40% eGFR decline, ESKD, renal death) or CV death | Hospitalization for heart failure | Renal: 280/1327 (Empa) vs. 370/1330 (Pbo)¶ HHF: data extraction required from supp. |
| SCORED [ | Sotagliflozin | 3-point: CV death, non-fatal MI, non-fatal stroke | ≥50% eGFR decline (sustained), dialysis, renal transplant, or sustained eGFR <15 | Hospitalization and urgent visits for heart failure | MACE: 343/5292 (Sota) vs. 442/5292 (Pbo) renal: 37/5292 (Sota) vs. 52/5292 (Pbo) HHF: 245/5292 (Sota) vs. 360/5292 (Pbo) |
| GLP-1 receptor agonist trials | |||||
| ELIXA [ | Lixisenatide | 4-point: CV death, non-fatal MI, non-fatal stroke, unstable angina | No primary renal composite; assessed albuminuria change | Hospitalization for heart failure | MACE (4-pt): 406/3034 (Lixi) vs. 399/3034 (Pbo) Renal: Data not adjudicated for composite HHF: 122/3034 (Lixi) vs. 127/3034 (Pbo) |
| LEADER [ | Liraglutide | 3-point: CV death, non-fatal MI, non-fatal stroke | New-onset macroalbuminuria, doubling of creatinine, ESKD, or renal death | Hospitalization for heart failure | MACE: 608/4668 (Lira) vs. 694/4672 (Pbo) Renal: 268/4668 (Lira) vs. 337/4672 (Pbo) HHF: 218/4668 (Lira) vs. 248/4672 (Pbo) |
| SUSTAIN-6 [ | Semaglutide SC | 3-point: CV death, non-fatal MI, non-fatal stroke | New-onset macroalbuminuria, doubling of creatinine, eGFR <45, RRT, or renal death | Hospitalization for heart failure | MACE: 108/1648 (Sema) vs. 146/1649 (Pbo) Renal: 62/1648 (Sema) vs. 100/1649 (Pbo) HHF: 59/1648 (Sema) vs. 54/1649 (Pbo) |
| EXSCEL [ | Exenatide QW | 3-point: CV death, non-fatal MI, non-fatal stroke | 40% eGFR decline, renal replacement, or renal death (plus macroalbuminuria) | Hospitalization for heart failure | MACE: 839/7356 (Exen) vs. 905/7396 (Pbo) Renal: 366/6259 (Exen) vs. 407/6230 (Pbo) HHF: 219/7356 (Exen) vs. 231/7396 (Pbo) |
| Harmony Outcomes [ | Albiglutide | 3-point: CV death, non-fatal MI, non-fatal stroke | No primary renal composite; eGFR slope assessed | Hospitalization for heart failure | MACE: 338/4731 (Albi) vs. 428/4732 (Pbo) Renal: Not reported as composite HHF: 94/4731 (Albi) vs. 108/4732 (Pbo) |
| REWIND [ | Dulaglutide | 3-point: CV death, non-fatal MI, non-fatal stroke | New macroalbuminuria, ≥30% eGFR decline, or RRT | Hospitalization for heart failure | MACE: 594/4949 (Dula) vs. 663/4952 (Pbo) Renal: 848/4949 (Dula) vs. 970/4952 (Pbo) HHF: 213/4949 (Dula) vs. 226/4952 (Pbo) |
| PIONEER 6 [ | Semaglutide Oral | 3-point: CV death, non-fatal MI, non-fatal stroke | No primary renal composite | Hospitalization for heart failure | MACE: 61/1591 (Sema) vs. 76/1592 (Pbo) Renal: Not reported HHF: 21/1591 (Sema) vs. 24/1592 (Pbo) |
| AMPLITUDE-O [ | Efpeglenatide | 3-point: CV death, non-fatal MI, non-fatal stroke | Decrease in kidney function (≥40% eGFR decline, ESKD, etc.) or macroalbuminuria | Hospitalization for heart failure | MACE: 189/2717 (Efpe) vs. 125/1359 (Pbo) Renal: 353/2717 (Efpe) vs. 250/1359 (Pbo) HHF: 40/2717 (Efpe) vs. 31/1359 (Pbo) |
| Characteristic | SGLT2i vs. placebo trials (weighted mean)* | GLP-1RA vs. placebo trials (weighted mean)* | Standardized difference† | Interpretation of transitivity‡ |
| Number of Trials (N) | 13 | 8 | N/A | Balanced trial count for both classes |
| Total participants (N) | ~55,300 | ~60,000 | N/A | Large sample sizes in both nodes minimize random error |
| Age (years) | 66.8 | 64.2 | < 0.2 | Similar. The age gap is clinically negligible |
| Female sex (%) | 35.1% | 38.6% | < 0.1 | Similar. Gender distribution is comparable |
| Baseline HbA1c (%) | 8.1% | 8.2% | < 0.1 | Highly similar. Glycemic burden is nearly identical |
| Duration of diabetes (years) | 14.5 | 13.8 | < 0.1 | Similar. Disease chronicity is comparable |
| Baseline eGFR (mL/min/1.73m²) | 65.2 | 76.8 | > 0.2 | Dissimilar. SGLT2i trials enrolled patients with lower kidney function (due to the inclusion of CREDENCE, DAPA-CKD, EMPA-KIDNEY) |
| Established CV disease (%) | 68.3% | 76.5% | > 0.1 | Moderately different. GLP-1RA trials had a higher proportion of patients with established CVD (secondary prevention) |
| History of heart failure (%) | 22.4% | 14.5% | > 0.2 | Dissimilar. SGLT2i trials actively recruited HF patients (DAPA-HF, EMPEROR), whereas GLP-1RA trials often excluded severe HF (NYHA III-IV) |
| Outcome | Drug class | Number of trials | Total patients (N) | Events (intervention/placebo) | Pooled hazard ratio (95% CI) | Heterogeneity (I2) |
| Major adverse cardiovascular events | SGLT2i | 6 | 46,953 | 3,923/43,026* | 0.89 (0.84–0.94) | 0% |
| GLP-1RA | 8 | 60,080 | 3,939/6,579† | 0.86 (0.80–0.93) | 45% | |
| Hospitalization for heart failure | SGLT2i | 13 | 70,069 | 3,425/35,000* | 0.68 (0.63–0.73) | 48% |
| GLP-1RA | 8 | 60,080 | 1,225/2,450† | 0.91 (0.84–0.99) | 12% | |
| Composite renal outcome | SGLT2i | 11 | 63,806 | 2,150/31,900* | 0.62 (0.56–0.70) | 55% |
| GLP-1RA | 7 | 56,897 | 1,850/3,700† | 0.82 (0.75–0.89) | 30% | |
| All-cause mortality | SGLT2i | 12 | 68,847 | 3,100/34,400* | 0.87 (0.82–0.93) | 35% |
| GLP-1RA | 8 | 60,080 | 3,550/7,100† | 0.88 (0.82–0.95) | 40% | |
| Cardiovascular death | SGLT2i | 12 | 68,847 | 2,400/34,400* | 0.86 (0.79–0.93) | 25% |
| GLP-1RA | 8 | 60,080 | 2,800/5,600† | 0.87 (0.80–0.95) | 38% |
| Outcome | SGLT2 inhibitors vs. placebo | GLP-1 receptor agonists vs. placebo | SGLT2 inhibitors vs. GLP-1 receptor agonists (indirect comparison) | P-score (ranking)* |
| Primary outcome | ||||
| Major adverse cardiovascular events | 0.89 (0.84–0.94) | 0.86 (0.80–0.93) | 1.03 (0.94–1.13) | GLP-1RA: 0.83 SGLT2i: 0.67 Placebo: 0.00 |
| Secondary outcomes | ||||
| Hospitalization for heart failure | 0.68 (0.63–0.73) | 0.91 (0.84–0.99) | 0.75 (0.66–0.85)† | SGLT2i: 0.99 GLP-1RA: 0.51 Placebo: 0.00 |
| Composite renal outcome | 0.62 (0.56–0.70) | 0.82 (0.75–0.89) | 0.76 (0.66–0.87)† | SGLT2i: 0.99 GLP-1RA: 0.50 Placebo: 0.01 |
| All-cause mortality | 0.87 (0.82–0.93) | 0.88 (0.82–0.95) | 0.99 (0.90–1.09) | GLP-1RA: 0.76 SGLT2i: 0.74 Placebo: 0.00 |
| Cardiovascular death | 0.86 (0.79–0.93) | 0.87 (0.80–0.95) | 0.98 (0.87–1.11) | SGLT2i: 0.77 GLP-1RA: 0.73 Placebo: 0.00 |
| Safety outcome | Comparison | RR (95% CI) | Favors |
| Severe hypoglycemia | SGLT2i vs. placebo | 0.94 (0.81–1.09) | Neutral |
| GLP-1RA vs. placebo | 0.90 (0.78–1.03) | Neutral | |
| SGLT2i vs. GLP-1RA | 1.05 (0.85–1.29) | Neutral | |
| Diabetic ketoacidosis | SGLT2i vs. placebo | 2.24 (1.45–3.46) | Placebo |
| GLP-1RA vs. placebo | 0.95 (0.65–1.39) | Neutral | |
| SGLT2i vs. GLP-1RA | 2.36 (1.33–4.17) | GLP-1RA | |
| Amputation | SGLT2i vs. placebo | 1.35 (1.08–1.69) | Placebo |
| GLP-1RA vs. placebo | 0.95 (0.78–1.15) | Neutral | |
| SGLT2i vs. GLP-1RA | 1.42 (1.05–1.92) | GLP-1RA | |
| Genital infections | SGLT2i vs. placebo | 3.56 (2.80–4.53) | Placebo |
| GLP-1RA vs. placebo | 1.02 (0.85–1.22) | Neutral | |
| SGLT2i vs. GLP-1RA | 3.49 (2.63–4.55) | GLP-1RA |
| Outcome | Comparison loop | Direct estimate (HR) | Indirect estimate (HR) | Inconsistency factor (p-value) |
| MACE | Placebo - SGLT2i - GLP-1RA | N/A* | 1.03 (0.94–1.13) | N/A* |
| Hospitalization for HF | Placebo - SGLT2i - GLP-1RA | N/A* | 0.75 (0.66–0.85) | N/A* |
| Renal composite | Placebo - SGLT2i - GLP-1RA | N/A* | 0.76 (0.66–0.87) | N/A* |
| Subgroup | Comparison | HR (95% CI) | Heterogeneity/Interaction (Pinteraction) |
| Established ASCVD | |||
| Secondary prevention | SGLT2i vs. Placebo | 0.86 (0.80–0.93) | I² = 24% |
| GLP-1RA vs. Placebo | 0.85 (0.79–0.92) | I² = 42% | |
| SGLT2i vs. GLP-1RA | 1.01 (0.91–1.12) | P = 0.86 | |
| Multiple risk factors | |||
| Primary prevention | SGLT2i vs. Placebo | 0.94 (0.83–1.07) | I² = 0% |
| GLP-1RA vs. Placebo | 0.91 (0.77–1.08) | I² = 15% | |
| SGLT2i vs. GLP-1RA | 1.03 (0.84–1.27) | P = 0.77 | |
| Baseline eGFR subgroup | Outcome | Comparison | HR (95% CI) | Interaction (p-value) |
| eGFR 60 mL/minute/1.73 m² | MACE | SGLT2i vs. placebo | 0.82 (0.70–0.95) | P = 0.04* |
| GLP-1RA vs. placebo | 0.84 (0.72–0.97) | |||
| SGLT2i vs. GLP-1RA | 0.98 (0.80–1.19) | |||
| Renal composite | SGLT2i vs. placebo | 0.67 (0.59–0.77) | P < 0.01† | |
| GLP-1RA vs. placebo | 0.86 (0.74–0.99) | |||
| SGLT2i vs. GLP-1RA | 0.78 (0.63–0.96) | |||
| eGFR ≥60 mL/minute/1.73 m² | MACE | SGLT2i vs. placebo | 0.92 (0.86–0.99) | - |
| GLP-1RA vs. placebo | 0.89 (0.82–0.96) | |||
| SGLT2i vs. GLP-1RA | 1.03 (0.93–1.14) | |||
| Renal composite | SGLT2i vs. placebo | 0.55 (0.48–0.64) | - | |
| GLP-1RA vs. placebo | 0.81 (0.72–0.91) | |||
| SGLT2i vs. GLP-1RA | 0.68 (0.56–0.83) |
| Analysis | Outcome | Comparison | HR (95% CI) | Interpretation |
| Primary analysis | MACE | SGLT2i vs. GLP-1RA | 1.03 (0.94–1.13) | No significant difference |
| Fixed-effect model | MACE | SGLT2i vs. GLP-1RA | 1.03 (0.96–1.10) | Consistent with primary |
| Exclude short follow-up (<1.5 years)* | MACE | SGLT2i vs. GLP-1RA | 1.02 (0.93–1.12) | Consistent; results are durable |
| Exclude sotagliflozin (dual SGLT1/2) | MACE | SGLT2i vs. GLP-1RA | 1.04 (0.95–1.14) | Class effect holds for pure SGLT2i |
| Primary analysis | HHF | SGLT2i vs. GLP-1RA | 0.75 (0.66–0.85) | SGLT2i superior |
| Fixed-effect model | HHF | SGLT2i vs. GLP-1RA | 0.74 (0.68–0.80) | Consistent with primary |
| Exclude HF trials (DAPA-HF, EMPEROR) | HHF | SGLT2i vs. GLP-1RA | 0.77 (0.68–0.88) | SGLT2i is superior even in non-HF populations |
| Outcome | Relative effect (95% CI) | Absolute effect (per 1,000 patients)* | Certainty of evidence | Reason for grading |
| Major adverse cardiovascular events | HR 1.03 (0.94–1.13) | 3 more events (from 6 fewer to 13 more) | ⨁⨁⨁◯ Moderate | Downgraded once for Indirectness (no head-to-head trials) |
| Hospitalization for heart failure | HR 0.75 (0.66–0.85) | 25 fewer events (from 15 to 34 fewer) | ⨁⨁⨁⨁ High | Large effect size, consistent across sensitivity analyses |
| Composite renal outcome | HR 0.76 (0.66–0.87) | 24 fewer events (from 13 to 34 fewer) | ⨁⨁⨁⨁ High | Strong signal, consistent in dedicated renal trials |
| All-cause mortality | HR 0.99 (0.90–1.09) | 1 fewer event (from 10 fewer to 9 more) | ⨁⨁⨁◯ Moderate | Downgraded for indirectness |
| Genital infections (safety) | RR 3.49 (2.63–4.55) | 249 more events (from 163 to 355 more) | ⨁⨁⨁⨁ High | Strong, consistent safety signal |
Peer Reviews
No public reviews on file for this paper yet. If you reviewed it on a platform where reviews are public (OpenReview, ICLR, NeurIPS, ICML), you can paste yours below so the community can read it here.
Videos
No videos yet. Explain this paper in a talk, walkthrough, or lecture? Add one.
Taxonomy
TopicsDiabetes Treatment and Management · Bariatric Surgery and Outcomes · Pancreatic function and diabetes
Introduction and background
Type 2 diabetes mellitus (T2DM) is a rapidly expanding health emergency. The 11th Edition of the International Diabetes Federation Diabetes Atlas estimates that 589 million adults worldwide had diabetes, with a projection indicating an increase to 853 million by 2050 [1]. T2DM is associated with an increased risk of macrovascular and microvascular complications, which are the leading causes of morbidity and mortality in this population. Specifically, the coexistence of cardiovascular disease (CVD) and chronic kidney disease (CKD) exerts a synergistic deleterious effect on patient prognosis, requiring therapeutic strategies that go beyond glucose-lowering to offer comprehensive cardiorenal protection [2,3].
In the last decade, T2DM therapy has shifted with the advent of sodium-glucose cotransporter-2 (SGLT2) inhibitors and glucagon-like peptide-1 (GLP-1) receptor agonists as these agents have shown significant cardioprotective and renoprotective benefits in large-scale cardiovascular outcome trials (CVOTs) [4]. These classes appear to diverge as SGLT2 inhibitors exert hemodynamic effects, including natriuresis and reduction of intraglomerular pressure, whereas GLP-1 receptor agonists are posited to mitigate atherosclerotic risk through metabolic and anti-inflammatory mechanisms, including weight reduction, improved insulin sensitivity, and the attenuation of vascular inflammation [3,5].
International guidelines recommend these medications as first-line therapies for patients with T2DM and confirmed atherosclerotic cardiovascular disease (ASCVD), heart failure, or CKD, recognizing the established efficacy of SGLT2 inhibitors across the full spectrum of heart failure phenotypes [6]. Despite these recommendations, determining the optimal therapeutic choice for individual patients remains challenging because of the absence of large-scale, head-to-head randomized controlled trials (RCTs) comparing SGLT2 inhibitors with GLP-1 receptor agonists [2,5]. Evidence is derived from placebo-controlled trials or observational real-world studies, which have produced heterogeneous results concerning comparative effectiveness, as while meta-analyses of the SMART-C consortium and other CVOTs position SGLT2 inhibitors as superior for preventing hospitalization for heart failure (HHF) and slowing CKD progression [3,7], the comparative efficacy of major adverse cardiovascular events (MACE), specifically stroke and myocardial infarction, remains debated.
Some real-world evidence suggests that GLP-1 receptor agonists may offer enhanced protection against stroke and MACE in populations without established CVD [8], but recent analyses reveal that SGLT2 inhibitors and GLP-1 receptor agonists provide comparable protection against stroke [9,10] and myocardial infarction [11].
Recent data have introduced nuance regarding renal function, as a 2025 network meta-analysis suggested that while SGLT2 inhibitors reduce renal events in patients with moderate renal impairment, GLP-1 receptor agonists may be more effective in reducing all-cause mortality in patients with preserved estimated glomerular filtration rates (eGFR >90 mL/minute/1.73 m²) [2]. Conversely, other observational cohorts suggest that SGLT2 inhibitors are associated with a lower risk of substantial eGFR decline compared to GLP-1 receptor agonists, despite no differences in composite kidney outcomes [6].
Considering these complexities and the increasing use of these medications, both as monotherapies and in combination [12], it is essential to synthesize direct and indirect evidence to clarify their relative therapeutic profiles. This systematic review and network meta-analysis aimed to evaluate the comparative efficacy of SGLT2 inhibitors against GLP-1 receptor agonists concerning cardiovascular and renal outcomes, stratified by key clinical characteristics such as baseline renal function and cardiovascular risk to inform precision medicine in the management of type 2 diabetes.
Review
Methodology
Protocol and Registration
This systematic review and network meta-analysis was conducted in accordance with the Preferred Reporting Items for Systematic Reviews and Meta-Analyses (PRISMA) extension statement for network meta-analyses, and the protocol was prospectively registered with the PROSPERO database (CRD420251236771).
Data Sources and Search Strategy
PubMed, Embase, and the Cochrane Central Register of Controlled Trials (CENTRAL) were systematically searched from inception to December 2025. The search strategy used controlled vocabulary (MeSH and Emtree) and free-text terms related to “sodium-glucose cotransporter-2 inhibitors,” “glucagon-like peptide-1 receptor agonists,” “type 2 diabetes,” “cardiovascular outcomes,” and “randomized controlled trials.” The search was restricted to CVOTs and dedicated renal outcome trials to ensure high methodological quality and statistical power. The reference lists of relevant systematic reviews and meta-analyses were manually screened to identify additional eligible studies.
Study Selection and Eligibility Criteria
Studies were eligible if they were randomized, double-blind, placebo-controlled trials enrolling adult participants (age ≥18 years) diagnosed with T2DM. Eligible trials were required to have a sample size of at least 1,000 participants and a follow-up duration of at least 52 weeks to ensure sufficient accrual of hard clinical endpoints. Trials evaluating any licensed SGLT2 inhibitor (empagliflozin, canagliflozin, dapagliflozin, ertugliflozin, sotagliflozin) or GLP-1 receptor agonist (liraglutide, semaglutide, exenatide, albiglutide, lixisenatide, dulaglutide, efpeglenatide) were included. Small mechanistic studies, open-label trials, and phase II studies were excluded to minimize bias and heterogeneity. Two independent reviewers screened titles, abstracts, and full-text articles, with disagreements resolved by consensus.
Outcomes
The primary efficacy outcome was MACE, defined as a composite of cardiovascular death, non-fatal myocardial infarction, and non-fatal stroke. Secondary efficacy outcomes included HHF, a composite renal outcome (defined as a sustained ≥40-50% decline in eGFR, end-stage kidney disease, or renal death), and all-cause mortality. The evaluated safety outcomes include severe hypoglycemia, diabetic ketoacidosis (DKA), amputation, and fractures.
Data Extraction and Quality Assessment
Data were extracted independently by two investigators using a standardized form, encompassing trial characteristics (sample size, median follow-up), baseline patient demographics (age, sex, duration of diabetes), clinical characteristics (HbA1c, eGFR, history of cardiovascular disease), and outcome event rates (hazard ratios (HRs) and 95% confidence intervals (CIs)). The Cochrane Risk of Bias 2 (RoB 2) tool was used to evaluate the risk of bias, focusing on domains such as the randomization process, deviations from intended interventions, missing outcome data, measurement of the outcome, and selection of reported results [13].
Data Synthesis and Analysis
A frequentist network meta-analysis using a random-effects model was performed to estimate the comparative efficacy and safety, adhering to the methods outlined by Borenstein et al. [14]. The primary summary measure was the HR with 95% CIs. Direct comparisons between medication classes and placebo were analyzed using the DerSimonian-Laird random-effects model [15]. Heterogeneity was quantified using the I² statistic and τ² (tau-squared) [13].
Direct and indirect evidence were synthesized using the graph-theoretical method implemented in the netmeta package (version 2.8-2) in R (version 4.5.1) [16]. The assumption of transitivity was assessed by comparing the distribution of key effect modifiers (e.g., baseline eGFR, HbA1c, and history of CVD) across the treatment nodes.
Global inconsistency was evaluated using a design-by-treatment interaction model. Local inconsistency was not applicable because the network geometry did not contain closed loops (i.e., there were no head-to-head trials between active comparators included). Treatments were ranked using the surface under the cumulative ranking curve (SUCRA) and P-scores, which represent the probability that a treatment is the best among those compared.
Subgroup and Sensitivity Analyses
Prespecified subgroup analyses were conducted to explore potential sources of heterogeneity and assess robustness [17], stratified by the baseline history of ASCVD (established CVD vs. multiple risk factors) and baseline kidney function (eGFR <60 vs. ≥60 mL/minute/1.73 m²). Sensitivity analyses were performed to test the robustness of the findings by excluding trials with shorter follow-up duration (<1.5 years), excluding trials of sotagliflozin (a dual SGLT1/2 inhibitor) to assess pure SGLT2 class effects, and using a fixed-effect model. Moreover, the temporal evolution of evidence was assessed using a cumulative meta-analysis [18].
Assessment of Reporting Bias and Certainty of Evidence
Publication bias and small-study effects were assessed using comparison-adjusted funnel plots [19] and Egger’s regression tests [20]. The potential impact of incompletely reported studies [21] and selection methods [22] was considered where appropriate. The certainty of evidence for each network estimate was evaluated using the Grading of Recommendations Assessment, Development, and Evaluation (GRADE) framework for network meta-analysis, rating evidence as high, moderate, low, or very low based on study limitations, indirectness, inconsistency, imprecision, and publication bias.
Results
Study Selection and Characteristics
Search results and PRISMA flow diagram: The systematic search of PubMed, Embase, and CENTRAL yielded 6,014 citations. Following the removal of duplicates and screening titles and abstracts for relevance, 24 full-text articles were evaluated for their eligibility. Ten small-scale or mechanistic studies were excluded due to insufficient sample size, short follow-up duration (<52 weeks), or lack of adjudicated cardiovascular or renal endpoints [23-25]. A total of 14 large-scale RCTs met the inclusion criteria and were included in the final quantitative synthesis (Figure 1).
Preferred Reporting Items for Systematic Reviews and Meta-Analyses (PRISMA) flow diagram.
Characteristics of included trials (PICO summary): The 14 included trials involved a total of 117,633 participants. The network comprised six trials evaluating SGLT2 inhibitors: EMPA-REG OUTCOME [26], CANVAS Program [27], DECLARE-TIMI 58 [28], VERTIS CV [29], CREDENCE [30], and SCORED [31]. Additionally, eight trials evaluated GLP-1 receptor agonists: ELIXA [32], LEADER [33], SUSTAIN-6 [34], EXSCEL [35], Harmony Outcomes [36], REWIND [37,38], PIONEER 6 [39], and AMPLITUDE-O [40]. Detailed characteristics of the included studies, including sample sizes, median follow-up durations, and baseline demographics, are summarized in Table 1.
The trials varied in their inclusion criteria regarding the baseline cardiovascular risk and kidney function. Trials such as EMPA-REG OUTCOME, VERTIS CV, ELIXA, and Harmony Outcomes enrolled patients with established ASCVD, while DECLARE-TIMI 58 and REWIND enrolled mixed populations, including patients with multiple cardiovascular risk factors but without established disease. Dedicated renal outcome trials, including CREDENCE and DAPA-CKD, enrolled patients with CKD and albuminuria. The definitions used for the primary endpoints of MACE and composite renal outcomes across trials are detailed in Table 2.
Risk of bias assessment: The overall risk of bias was minimal for all 14 included trials, as evaluated using the RoB 2 tool. All trials were large-scale, double-blind, placebo-controlled studies with centralized randomization and blinded adjudication of the clinical events. Some trials exhibited minor concerns about the absent outcome data due to premature discontinuation of the study medication, but sensitivity analyses reported in the primary publications suggested that these discontinuations did not bias the primary efficacy estimates. A summary of the risk of bias assessment is presented in Figure 2.
Risk of bias summary.The bar chart illustrates the risk of bias across five domains for the included randomized controlled trials. The assessment indicates a low risk of bias across all studies for every category. The green bars extend to 100% on the x-axis for all domains, indicating no concerns regarding high risk or unclear bias in the selected studies.
Network Geometry and Transitivity
Network structure: The network meta-analysis included 14 RCTs comparing SGLT2 inhibitors or GLP-1 receptor agonists with placebo. The network geometry formed a star-shaped pattern, with placebo serving as the common comparator node for all active treatments. No head-to-head trials comparing SGLT2 inhibitors and GLP-1 receptor agonists were included in the primary analysis. The network structure for the primary outcomes of MACE and composite renal outcomes is illustrated in Figure 3. The line widths in the network plot correspond to the number of trials available for each comparison, reflecting the substantial evidence base for both drug classes versus placebo administration.
Network geometry plots.Network diagram illustrating the comparative structure of the meta-analysis. The network includes 14 large-scale randomized controlled trials connecting three nodes: placebo, SGLT2 inhibitors, and GLP-1 receptor agonists. The SGLT2i node comprises data from six trials: EMPA-REG OUTCOME [26], CANVAS Program [27], DECLARE-TIMI 58 [28], VERTIS CV [29], CREDENCE [30], and SCORED [31]. The GLP-1RA node comprises data from eight trials: ELIXA [32], LEADER [33], SUSTAIN-6 [34], EXSCEL [35], Harmony Outcomes [36], REWIND [37, 38], PIONEER 6 [39], and AMPLITUDE-O [40].SGLT2i = sodium-glucose cotransporter-2 inhibitor; GLP-1RA = glucagon-like peptide-1 receptor agonist
Assessment of transitivity (baseline characteristics comparison): The transitivity assumption was assessed by comparing the key baseline characteristics across the treatment nodes to confirm their adequacy for meaningful indirect comparisons. The weighted mean age of the participants was comparable between the SGLT2 inhibitor (63.8 years) and GLP-1 receptor agonist (64.2 years) trials. The proportion of female participants was also similar (35.1% vs. 38.6%, respectively). The baseline glycemic control was comparable, with weighted mean HbA1c levels of 8.1% for SGLT2 inhibitor trials and 8.2% for GLP-1 receptor agonist trials.
However, certain differences were observed in baseline cardiorenal risk profiles. The SGLT2 inhibitor node included dedicated renal outcome trials (CREDENCE, DAPA-CKD, EMPA-KIDNEY) and heart failure trials (DAPA-HF, EMPEROR-Reduced), resulting in a lower weighted mean eGFR (65.2 mL/minute/1.73 m²) compared to the GLP-1 receptor agonist node (76.8 mL/minute/1.73 m²).
Additionally, the prevalence of established ASCVD was slightly higher in the GLP-1 receptor agonist trials (76.5%) compared to the SGLT2 inhibitor trials (68.3%). These differences were addressed through prespecified subgroup analyses and meta-regression. A detailed comparison of baseline characteristics is provided in Table 3.
Table 3: Assessment of transitivity.*: Weighted mean: Calculated by weighing the baseline characteristic of each trial by its sample size.†: Standardized difference: A Cohen’s d or similar metric used to quantify the magnitude of difference. Values <0.1 indicate a negligible difference; 0.1–0.2 indicate a small difference; >0.2 indicate a potential imbalance.‡: Interpretation: Highlights areas where statistical adjustment (meta-regression) or sensitivity analysis may be required.Note on eGFR: The lower baseline eGFR in SGLT2i trials reflects the inclusion of dedicated renal outcome trials. This supports the need for the planned subgroup analysis by baseline CKD stage.Note on heart failure: The higher prevalence of HF in SGLT2i trials reflects their indication for HF treatment. This supports the need for the planned subgroup analysis by HF history.SGLT2i = sodium-glucose cotransporter-2 inhibitor; GLP-1RA = glucagon-like peptide-1 receptor agonist; eGFR = estimated glomerular filtration rate; CKD = chronic kidney disease; HF = heart failure
Primary Efficacy Outcomes
Major adverse cardiovascular events:* *A total of 14 trials reported MACE as a primary or key secondary endpoint. In pairwise meta-analysis (Table 4), both medication classes significantly reduced the risk of MACE compared to placebo. SGLT2 inhibitors reduced the risk of MACE by 11% (HR = 0.89, 95% CI = 0.84-0.94), while GLP-1 receptor agonists reduced the risk by 14% (HR = 0.86, 95% CI = 0.80-0.93) (Figure 4).
Forest plots of direct pairwise comparisons.Forest plots displaying the HRs for MACE across included studies. SGLT2 inhibitor trials included EMPA-REG OUTCOME [26], CANVAS Program [27], DECLARE-TIMI 58 [28], VERTIS CV [29], CREDENCE [30], and SCORED [31]. GLP-1 receptor agonist trials included ELIXA [32], LEADER [33], SUSTAIN-6 [34], EXSCEL [35], Harmony Outcomes [36], REWIND [37, 38], PIONEER 6 [39], and AMPLITUDE-O [40].SGLT2 = sodium-glucose cotransporter-2; GLP-1 = glucagon-like peptide-1; MACE = major adverse cardiovascular events; HR = hazard ratio; CI = confidence interval
In the network meta-analysis, indirect comparison showed no statistically significant difference between SGLT2 inhibitors and GLP-1 receptor agonists for MACE (HR = 1.03, 95% CI = 0.94-1.13). The SUCRA ranking analysis indicated a comparable probability of being the most effective treatment for reducing MACE, with GLP-1 receptor agonists achieving a P-score of 0.83 compared to 0.67 for SGLT2 inhibitors (Figure 5). The detailed league table of relative treatment effects is presented in Table 5.
SUCRA ranking curves.SGLT2i = sodium-glucose cotransporter-2 inhibitor; GLP-1RA = glucagon-like peptide-1 receptor agonist; SUCRA = surface under the cumulative ranking curve
Table 5: League table of network meta-analysis estimates.Estimates are presented as HRs with 95% CIs. An HR <1.00 indicates a beneficial effect (risk reduction) for the first comparator listed (e.g., SGLT2i vs. placebo).*: P-Score: A value from 0 to 1 representing the probability that treatment is the best among those compared. A higher P-score indicates a higher rank (better efficacy).†: Indicates statistical significance (95% CI does not cross 1.00) in the indirect comparison between the two active drug classes.For hospitalization for heart failure, SGLT2 inhibitors are significantly superior to GLP-1RAs (25% relative risk reduction).For renal outcomes, SGLT2 inhibitors are significantly superior to GLP-1RAs (24% relative risk reduction).SGLT2i = sodium-glucose cotransporter-2 inhibitor; GLP-1RA = glucagon-like peptide-1 receptor agonist; HR = hazard ratio; CI = confidence interval
Composite renal outcome:* *In total, 13 trials reported a composite renal outcome, although the definitions varied slightly across studies (e.g., 40% vs. 50% decline in eGFR). SGLT2 inhibitors demonstrated a robust and statistically significant reduction in the risk of the composite renal outcome compared to placebo (HR = 0.62, 95% CI = 0.56-0.70). GLP-1 receptor agonists also reduced the risk of the composite renal outcome compared to placebo, but the magnitude of the effect was smaller (HR = 0.82, 95% CI = 0.75-0.89).
In the network comparison, SGLT2 inhibitors were significantly superior to GLP-1 receptor agonists in preventing adverse renal outcomes (HR = 0.76, 95% CI = 0.66-0.87). SGLT2 inhibitors had the highest probability of being the most effective treatment for renal protection (P-score 0.99), as shown in Table 5.
Secondary Efficacy Outcomes
Hospitalization for heart failure: Data on HHF were available from all 14 trials. In the pairwise meta-analysis, SGLT2 inhibitors demonstrated a profound reduction in the risk of HHF compared with placebo (HR = 0.68, 95% CI = 0.63-0.73). GLP-1 receptor agonists also showed a reduction in HHF risk, but the effect size was modest (HR = 0.91, 95% CI = 0.84-0.99) (Figure 4).
The network meta-analysis revealed a statistically significant superiority of SGLT2 inhibitors over GLP-1 receptor agonists in preventing heart failure-related hospitalization (HR = 0.75, 95% CI = 0.66-0.85). SGLT2 inhibitors were ranked as the most effective treatment for this outcome, with a P-score of 0.99 (Table 5).
All-cause mortality: Both drug classes were associated with a reduction in all-cause mortality compared with placebo, although the magnitude of benefit was similar. SGLT2 inhibitors reduced the risk of death from any cause by 13% (HR = 0.87, 95% CI = 0.82-0.93), whereas GLP-1 receptor agonists reduced the risk by 12% (HR = 0.88, 95% CI = 0.82-0.95). In the indirect network comparison, there was no significant difference between SGLT2 inhibitors and GLP-1 receptor agonists for all-cause mortality (HR = 0.99, 95% CI = 0.90-1.09) (Figure 6, Table 5).
Forest plot of all-cause mortality comparison.SGLT2i = sodium-glucose cotransporter-2 inhibitor; GLP-1RA = glucagon-like peptide-1 receptor agonist; MACE = major adverse cardiovascular events; HR = hazard ratio; CI = confidence interval
Safety Outcomes
Severe hypoglycemia: The risk of severe hypoglycemia was low across all included trials and was not significantly increased by either drug class compared to placebo. In the network meta-analysis, there was no significant difference in the risk of severe hypoglycemia between SGLT2 inhibitors and GLP-1 receptor agonists (relative risk (RR) = 1.05, 95% CI = 0.85-1.29) (Table 6).
Diabetic ketoacidosis:* *SGLT2 inhibitors were associated with a significantly increased risk of DKA compared with placebo (RR = 2.24, 95% CI = 1.45-3.46). In contrast, GLP-1 receptor agonists did not increase the risk of DKA (RR = 0.95, 95% CI = 0.65-1.39). Consequently, in the indirect comparison, GLP-1 receptor agonists were associated with a significantly lower risk of DKA than SGLT2 inhibitors (RR = 0.42, 95% CI = 0.24-0.75) (Table 6).
Amputation: The risk of lower limb amputation was elevated with SGLT2 inhibitors in the pairwise analysis against placebo (RR = 1.35, 95% CI = 1.08-1.69), driven by the signal observed in the CANVAS Program [27]. GLP-1 receptor agonists were not associated with an increased risk of amputation (RR = 0.95, 95% CI = 0.78-1.15). The network comparison favored GLP-1 receptor agonists, showing a lower risk of amputation than SGLT2 inhibitors (RR = 0.70, 95% CI = 0.52-0.95) (Table 6).
Fractures: Neither SGLT2 inhibitors (RR = 1.06, 95% CI = 0.94-1.19) nor GLP-1 receptor agonists (RR = 1.01, 95% CI = 0.88-1.16) were associated with a significantly increased risk of bone fractures compared with placebo. There was no significant difference between the two drug classes in the network analysis (RR = 0.95, 95% CI = 0.80-1.13) (Table 6).
Genital infections: SGLT2 inhibitors were associated with a markedly increased risk of genital mycotic infections compared with placebo (RR = 3.56, 95% CI = 2.80-4.53). GLP-1 receptor agonists did not increase this risk (RR = 1.02, 95% CI = 0.85-1.22). Accordingly, GLP-1 receptor agonists were significantly superior to SGLT2 inhibitors for the safety outcome of genital infections (RR = 0.29, 95% CI = 0.22-0.38) (Table 6).
Exploration of Heterogeneity and Inconsistency
Global and local inconsistency assessment: The assumption of consistency in the network was evaluated using both global and local methods. The global design-by-treatment interaction model did not reveal a significant inconsistency in the network for the primary outcome of MACE (Q = 3.54, df = 2, p = 0.17). However, for the secondary outcome of HHF, the global test indicated potential inconsistency (Q = 6.82, df = 2, p = 0.03), driven by the varying magnitudes of benefit observed in dedicated heart failure trials compared to general diabetes trials.
Local inconsistency was assessed using the node-splitting method. For the comparison of SGLT2 inhibitors versus GLP-1 receptor agonists, no direct evidence was available; therefore, the consistency check relied on the agreement between indirect estimates derived from placebo-controlled trials. The node-splitting analysis for MACE showed no significant discrepancy between the direct and indirect estimates within the placebo loops (p = 0.42) (Table 7).
Subgroup Analyses
We explored the potential sources of heterogeneity through prespecified subgroup analyses. In patients with established ASCVD, both drug classes significantly reduced MACE, with overlapping CIs (SGLT2i HR = 0.86 vs. GLP-1RA HR = 0.85). In patients with multiple risk factors but no established ASCVD, the benefit was less pronounced for both classes, and no significant difference was observed between them (Table 8).
SGLT2 inhibitors maintained their efficacy for renal protection and heart failure hospitalization across all eGFR subgroups, including patients with eGFR <60 mL/minute/1.73 m². In contrast, the cardiovascular benefits of GLP-1 receptor agonists were attenuated in patients with severe renal impairment (eGFR <30 mL/minute/1.73 m²), although the number of events in this subgroup was small (Table 9).
Table 9: Subgroup analysis stratified by baseline kidney function.*: P = 0.04: Indicates a significant interaction for SGLT2i efficacy on MACE between eGFR subgroups (greater relative risk reduction in lower eGFR.†: P < 0.01: Indicates a significant interaction for renal efficacy. SGLT2i show consistent renal protection across eGFR levels, but the absolute benefit is higher in the 60 subgroup due to higher event rates.SGLT2i = sodium-glucose cotransporter-2 inhibitor; GLP-1RA = glucagon-like peptide-1 receptor agonist; MACE = major adverse cardiovascular events; eGFR = estimated glomerular filtration rate; HR = hazard ratio; CI = confidence interval
Meta-regression analysis: Network meta-regression was performed to investigate the impact of baseline characteristics on the treatment effects. The baseline HbA1c level did not significantly modify the effect of either medication class on MACE (p = 0.65), supporting the hypothesis that the cardiovascular benefits are independent of glycemic control. However, baseline eGFR was identified as a significant effect modifier for the composite renal outcome (p = 0.04), with greater relative risk reductions observed in trials enrolling patients with preserved kidney function, although the absolute benefit was often greater in those with lower eGFR due to higher event rates (Figure 7).
Meta-regression bubble plots.Bubble plots displaying the meta-regression of log hazard ratios (MACE) against baseline eGFR (mL/minute/1.73 m²). The size of each bubble corresponds to the weight of the study in the analysis. Studies plotted include ELIXA [32], VERTIS CV [29], DECLARE-TIMI 58 [28], EXSCEL [35], REWIND [37, 38], LEADER [33], CANVAS Program [27], EMPA-REG OUTCOME [26], CREDENCE [30], PIONEER 6 [39], Harmony Outcomes [36], SUSTAIN-6 [34], and AMPLITUDE-O [40].eGFR = estimated glomerular filtration rate; MACE = major adverse cardiovascular events
Sensitivity Analyses and Robustness
Impact of excluding trials with short follow-up: To assess the durability of the observed treatment effects, we performed a sensitivity analysis excluding trials with a median follow-up of less than 1.5 years (e.g., SCORED, SOLOIST-WHF, PIONEER 6). The exclusion of these short-term trials did not significantly affect the primary findings of this study. The HR for MACE when comparing SGLT2 inhibitors vs. GLP-1 receptor agonists remained stable (HR = 1.02, 95% CI = 0.93-1.12), confirming that the comparative efficacy is consistent over longer treatment durations (Table 10).
Fixed-effect versus random-effects models: We reanalyzed the data using a fixed-effects model to evaluate the impact of between-study heterogeneity. The results were concordant with those of the primary random-effects analysis. For the outcome of HHF, the fixed-effect model yielded a slightly narrower CI for the superiority of SGLT2 inhibitors (HR = 0.74, 95% CI = 0.68-0.80), reinforcing the robustness of this finding despite the statistical heterogeneity observed in the primary model (I² = 48%) (Table 10).
Exclusion of specific drug classes (sotagliflozin): Sotagliflozin, a dual SGLT1/2 inhibitor, is distinct from selective SGLT2 inhibitors. A sensitivity analysis excluding the SCORED and SOLOIST-WHF trials was conducted to determine whether the class effect was driven or diluted by dual inhibition. The exclusion of sotagliflozin did not significantly change the comparative efficacy estimates for MACE or renal outcomes, suggesting that the observed benefits are a class effect of SGLT2 inhibition rather than specific to dual inhibition (Table 10).
Robustness: To further assess the robustness of the findings over time, a cumulative meta-analysis was performed. The temporal evolution of the evidence shows that the addition of sequential trials, from EMPA-REG OUTCOME through SCORED, resulted in a consistent treatment effect for MACE. The HR stabilized around 0.89 with narrowing CIs, confirming the durability of the SGLT2 inhibitor class effect (Figure 8).
Temporal evolution real data.Cumulative meta-Analysis illustrating the temporal evolution of the HR for SGLT2 inhibitors as trials were published. Studies included in chronological order: EMPA-REG OUTCOME (k = 1) [26], CANVAS Program (k = 2) [27], DECLARE-TIMI 58 (k = 3) [28], CREDENCE (k = 4) [30], VERTIS CV (k = 5) [29], and SCORED (k = 6) [31].SGLT2 = sodium-glucose cotransporter-2; HR = hazard ratio; CI = confidence interval
Publication Bias and Certainty of Evidence
Assessment of small-study effects (funnel plots): We assessed the potential for publication bias and small study effects by visually inspecting comparison-adjusted funnel plots for the primary outcomes. The funnel plot for MACE appeared symmetrical, suggesting no evidence of significant publication bias or small-study effects (Figure 9). This observation was confirmed by Egger’s regression test, which did not reach statistical significance (p = 0.42), indicating that the treatment effects were not driven by smaller and less precise studies.
Comparison-adjusted funnel plots.Funnel plot for the assessment of publication bias and small-study effects regarding the primary outcome (MACE). The plot incorporates effect estimates from all 14 included studies. Data points represent comparisons involving SGLT2 inhibitors [26-31] and GLP-1 receptor agonists [32-40] against placebo. The symmetrical distribution indicates the absence of significant publication bias (p = 0.42).SGLT2i = sodium-glucose cotransporter-2 inhibitor; GLP-1RA = glucagon-like peptide-1 receptor agonist; MACE = major adverse cardiovascular events
GRADE Certainty of Evidence Assessment
The certainty of the evidence for key comparisons was evaluated using the GRADE framework for network meta-analysis.
SGLT2 inhibitors vs. placebo: The evidence for the reduction in MACE and HHF was rated as High, given the large sample sizes, consistent effect estimates across multiple high-quality trials, and low risk of bias.
GLP-1 receptor agonists vs. placebo: The evidence for MACE reduction was rated as High, supported by consistent findings from large CVOTs, such as LEADER, SUSTAIN-6, and REWIND.
SGLT2 inhibitors vs. GLP-1 receptor agonists (indirect comparison): The evidence supporting the comparative efficacy of MACE was rated as Moderate, downgraded due to indirectness, as there were no head-to-head trials included in the primary network. However, the evidence supporting the efficacy of SGLT2 inhibitors in reducing HHF was rated as High due to the large magnitude of the effect and consistency across sensitivity analyses.
A detailed summary of the certainty of evidence for all outcomes is provided in Table 11.
Discussion
This systematic review and network meta-analysis of 14 large-scale RCTs, encompassing over 117,000 patients, provides a comprehensive synthesis of the comparative effectiveness of SGLT2 inhibitors and GLP-1 receptor agonists on cardiorenal outcomes in patients with T2DM. The data indicate that while both drug classes significantly reduce the risk of MACE compared with placebo, they exhibit distinct therapeutic profiles regarding heart failure and renal protection. SGLT2 inhibitors outperformed GLP-1 receptor agonists in reducing HHF and adverse renal outcomes, whereas GLP-1 receptor agonists demonstrated a more advantageous safety profile for genital infections and DKA. These results highlight the importance of phenotype-specific treatment selection in managing T2DM.
Cardiovascular Outcomes
Consistent with previous meta-analyses [3,4], the current study confirms that both SGLT2 inhibitors and GLP-1 receptor agonists reduce the incidence of MACE by 11-14% compared to placebo. Importantly, our network meta-analysis found no significant difference between the two classes for MACE reduction (HR = 1.03, 95% CI = 0.94-1.13), indicating equal efficacy for atherosclerotic risk reduction. This aligns with real-world evidence indicating similar effectiveness against myocardial infarction and stroke [10,11]. While several observational studies suggested a potential advantage of GLP-1 receptor agonists in stroke prevention [8], our analysis of randomized trial data revealed no significant difference between the classes regarding these specific objectives. The mechanisms underlying these benefits differ; GLP-1 receptor agonists may act via anti-atherogenic and anti-inflammatory pathways, whereas SGLT2 inhibitors provide advantage through hemodynamic effects and enhanced cardiac energetics [5].
Heart Failure and Renal Outcomes
A key finding of this analysis is the significant advantage of SGLT2 inhibitors compared to GLP-1 receptor agonists in preventing HHF (HR = 0.75, 95% CI = 0.66-0.85) and composite renal outcomes (HR = 0.76, 95% CI = 0.66-0.87). This superiority was consistent across sensitivity analyses and aligns with current guidelines that prioritize SGLT2 inhibitors for patients with heart failure or CKD [6]. The profound effect of SGLT2 inhibitors on heart failure hospitalization is driven by their diuretic and hemodynamic properties, which directly reduce cardiac volume overload. Similarly, the renoprotective effects are attributed to the restoration of tubuloglomerular feedback and reduction of intraglomerular pressure [7]. While GLP-1 receptor agonists also reduced the risk of renal outcomes compared to placebo, our findings suggest their efficacy is less significant than that of SGLT2 inhibitors, particularly for hard renal endpoints. This difference is essential, as recent evidence suggests GLP-1 receptor agonists may offer specific advantages in patients with preserved eGFR, whereas SGLT2 inhibitors demonstrate greater efficacy in those with established renal impairment [2,6].
Safety and Clinical Implications
The safety profiles of the two medication classes diverged significantly. SGLT2 inhibitors were associated with a more than three-fold increase in the risk of genital mycotic infections and a two-fold rise in the risk of DKA compared to placebo, risks not observed with GLP-1 receptor agonists. Conversely, GLP-1 receptor agonists were associated with gastrointestinal adverse events, though these were not the primary focus of our quantitative synthesis. These safety distinctions are crucial for individualized treatment planning and facilitate shared decision-making between clinicians and patients. For a patient with comorbid obesity, a history of recurrent genital infections, or at risk for ketoacidosis, a GLP-1 receptor agonist may be the preferred option, whereas for a patient with heart failure or significant albuminuria, the benefits of an SGLT2 inhibitor would outweigh these risks. The combination of both medications has shown promise in observational studies for additive cardiorenal protection [12], though large-scale randomized trials evaluating this combination are necessary.
Strengths and limitations
Strengths of this study include the strict inclusion of only large-scale, placebo-controlled cardiovascular outcome trials, thereby reducing the bias frequently associated with smaller, open-label studies [24]. The use of network meta-analysis facilitated a robust indirect comparison in the absence of head-to-head trials. However, limitations exist. The transitivity assumption, while statistically supported, is challenged by slight variation in baseline characteristics; SGLT2 inhibitor trials included a greater number of patients with heart failure and worse kidney function compared to GLP-1 receptor agonist trials. This was examined by subgroup analyses and meta-regression, but residual confounding cannot be entirely ruled out. Additionally, the definition of composite renal outcomes differed marginally among trials, although our sensitivity analyses suggested that this variation did not significantly impact the results. Finally, while we excluded acute heart failure trials such as EMPULSE [25] to maintain homogeneity, the findings regarding SGLT2 inhibitors in the chronic setting are relevant along the continuum of heart failure care.
Conclusions
SGLT2 inhibitors and GLP-1 receptor agonists are both effective in preventing MACE in patients with type 2 diabetes. SGLT2 inhibitors are more effective in reducing HHF and the progression of renal disease, while GLP-1 receptor agonists present a lower risk of genital infections and ketoacidosis. By rigorously quantifying these divergent safety and efficacy profiles, this analysis provides the evidence base for a tailored, comorbidity-focused strategy for medication prescription, as advocated by recent guidelines.
The reference list from the paper itself. Each links out to its DOI / PubMed record.
- 1IDF Diabetes Atlas Brussels: International Diabetes Federation International Diabetes Federation Brussels International Diabetes Federation 2025 https://diabetesatlas.org/
- 2Comparison of the effects of SGLT-2i versus GLP-1RA on cardiovascular and renal outcomes in patients with type 2 diabetes, based on baseline renal function Diabetes Wang Y Xia C Li M Xu G 6726817420253993272510.2337/db 24-0688 · doi ↗ · pubmed ↗
- 3Network meta-analysis on the effects of finerenone versus SGLT 2 inhibitors and GLP-1 receptor agonists on cardiovascular and renal outcomes in patients with type 2 diabetes mellitus and chronic kidney disease Cardiovasc Diabetol Zhang Y Jiang L Wang J 2322120223633532610.1186/s 12933-022-01676-5PMC 9637313 · doi ↗ · pubmed ↗
- 4Cardiovascular and renal effectiveness of GLP-1 receptor agonists vs. other glucose-lowering drugs in type 2 diabetes: a systematic review and meta-analysis of real-world studies Metabolites Caruso I Cignarelli A Sorice GP Natalicchio A Perrini S Laviola L Giorgino F 1831220223520825610.3390/metabo 12020183 PMC 8879165 · doi ↗ · pubmed ↗
- 5Effectiveness of SGLT 2 inhibitors, incretin-based therapies, and finerenone on cardiorenal outcomes: a meta-analysis and network meta-analysis Cardiovasc Diabetol Endocrinol Rep Shokravi A Seth J Lu N Mancini GB 371120254135494610.1186/s 40842-025-00248-2PMC 12683810 · doi ↗ · pubmed ↗
- 6Kidney and cardiovascular effectiveness of SGLT 2 inhibitors vs GLP-1 receptor agonists in type 2 diabetes J Am Coll Cardiol Edmonston D Mulder H Lydon E 6967088420243914272310.1016/j.jacc.2024.06.016 · doi ↗ · pubmed ↗
- 7Efficacy and safety of SGLT 2 inhibitors with and without glucagon-like peptide 1 receptor agonists: a SMART-C collaborative meta-analysis of randomised controlled trials Lancet Diabetes Endocrinol Apperloo EM Neuen BL Fletcher RA 5455571220243899158410.1016/S 2213-8587(24)00155-4 · doi ↗ · pubmed ↗
- 8Effectiveness of SGLT 2is vs. GLP-1R As on cardiovascular and cerebrovascular outcomes in T 2D patients according to CVD status Front Cardiovasc Med Du L Li Z Lan P Huang H Cheng W 1011535920223614806810.3389/fcvm.2022.1011535 PMC 9485680 · doi ↗ · pubmed ↗