Characterization of genomic diversity and population structure of worldwide Duroc subpopulations and other pig breeds
Hui Wen, Harvey D. Blackburn, Henrique A. Mulim, Hinayah R. Oliveira, Susanne Hermesch, Ching-Yi Chen, Justin Holl, Allan P. Schinckel, Luiz F. Brito

TL;DR
This study explores the genetic diversity and population structure of Duroc pigs and other breeds, revealing insights into their ancestry and inbreeding levels.
Contribution
The study provides new insights into the genetic diversity and population structure of Duroc pigs and their relationships with other pig breeds.
Findings
Duroc subpopulations have lower effective population sizes and higher inbreeding levels compared to other pig breeds.
ROH islands in Duroc pigs are associated with genes related to growth, metabolism, and immune system pathways.
Strong correlations between inbreeding metrics suggest shared genetic patterns across studied pig populations.
Abstract
Duroc is one of the most popular terminal sire pig breeds worldwide due to its greater growth rate, meat quality, feed efficiency, and carcass characteristics compared to other breeds. Despite the breed’s popularity, its developmental history, genetic diversity, and genetic relationships with other pig breeds remain largely unknown. Therefore, the primary objective of this study was to investigate population structure and genetic diversity of Duroc subpopulations from Europe, North America, and Australia, and of other pig breeds. The studied pig populations were differentiated into five subgroups(European and North American Durocs, Australian Durocs, Asian-Pacific pig breeds, and two other breed groups [OBP1 and OBP2]), consistent with their geographical origins, as revealed by population structure analyses. The estimated effective population size (Ne) of Duroc subpopulations ranged…
Genes, proteins, chemicals, diseases, species, mutations and cell lines named across the full text — each resolved to its canonical identifier and authoritative record.
Click any figure to enlarge with its caption.
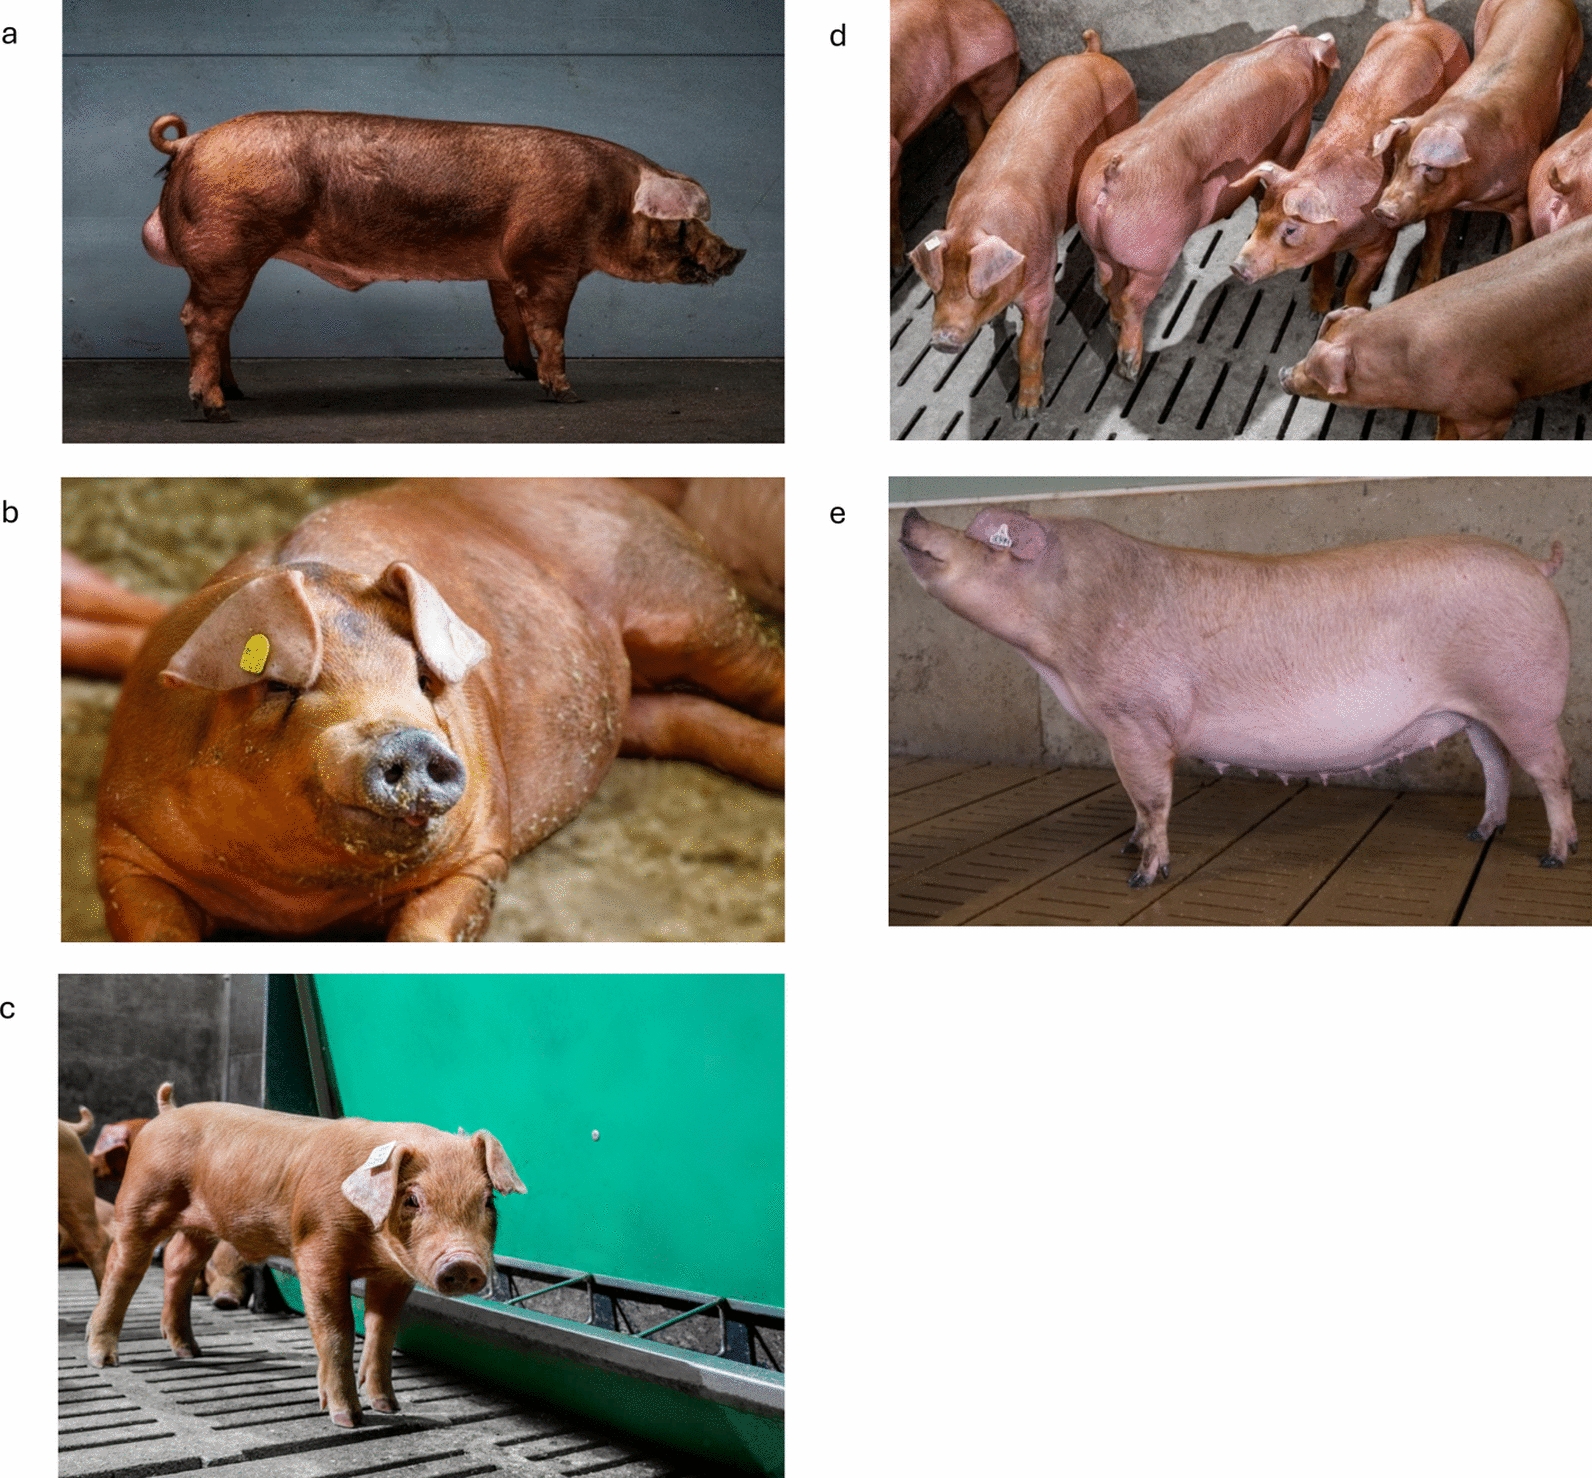 Figure 1
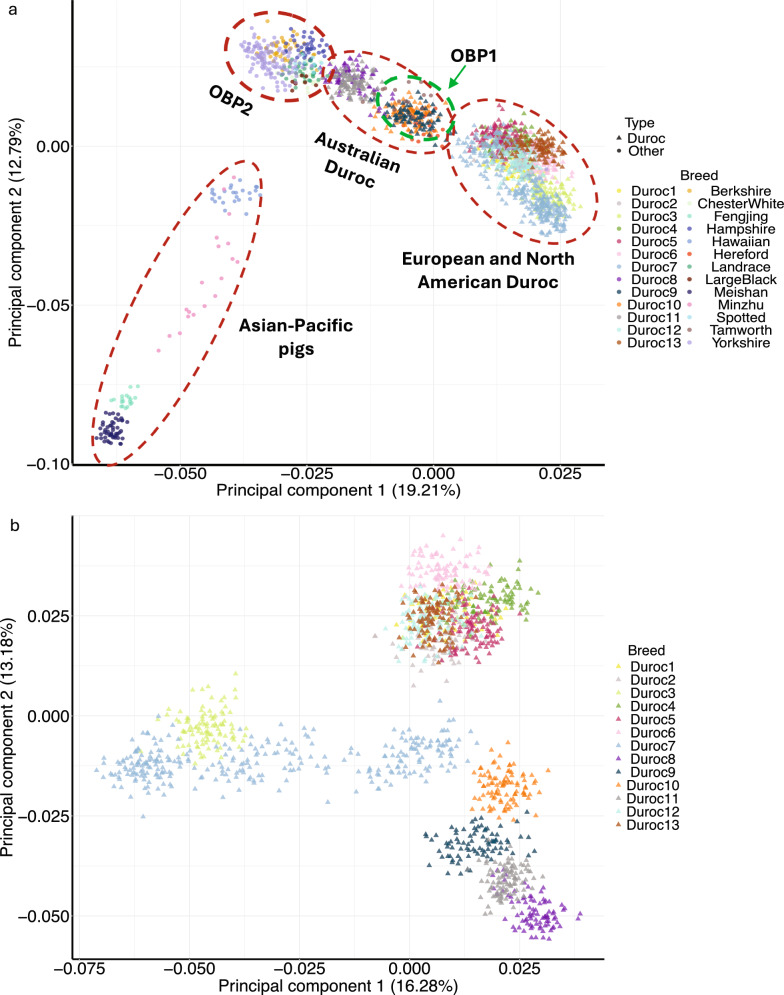 Figure 2
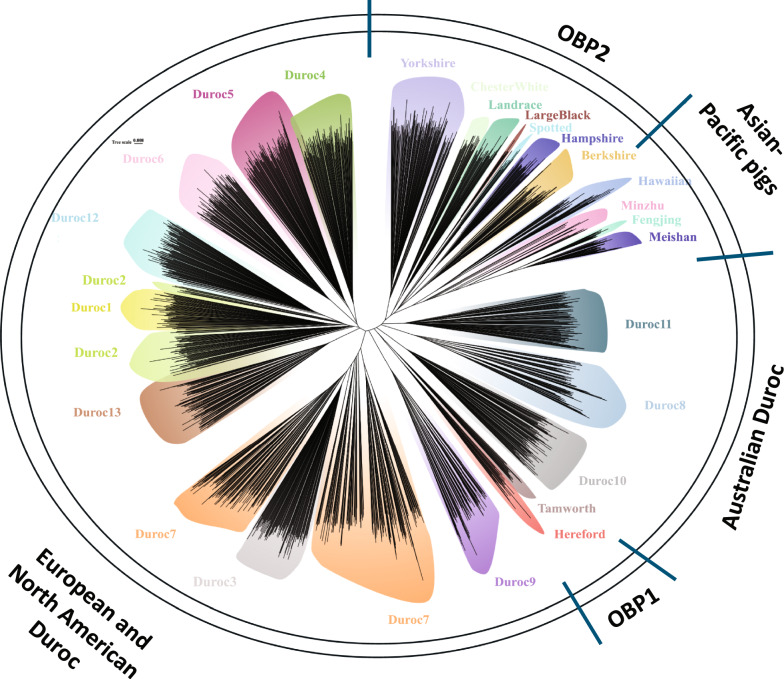 Figure 3
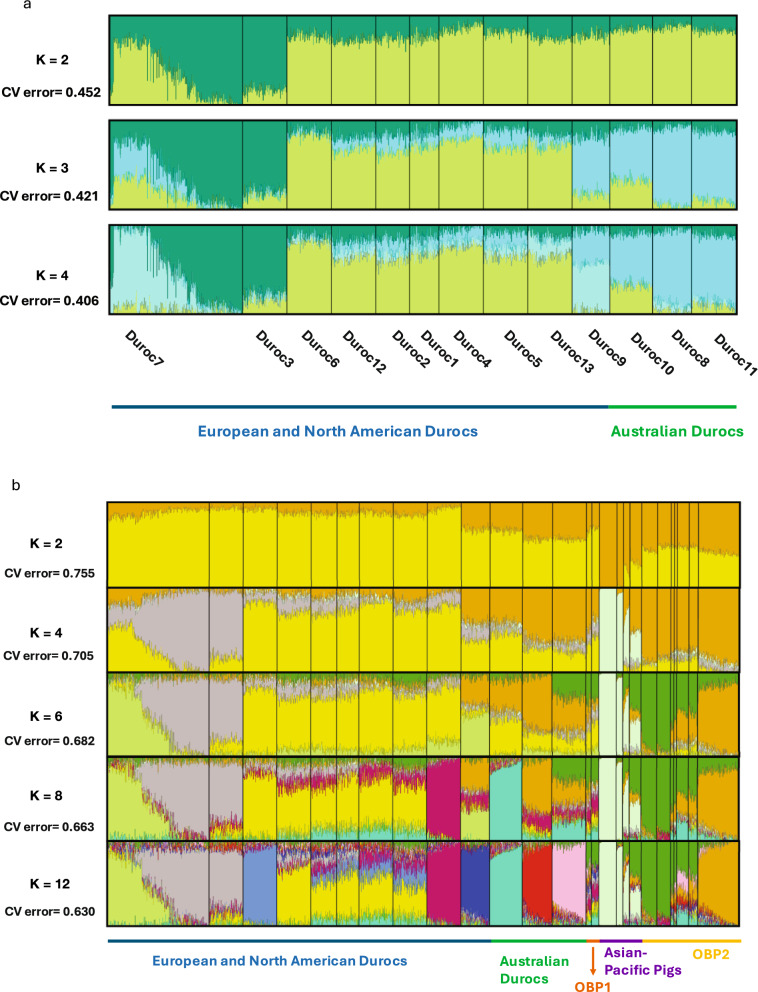 Figure 4
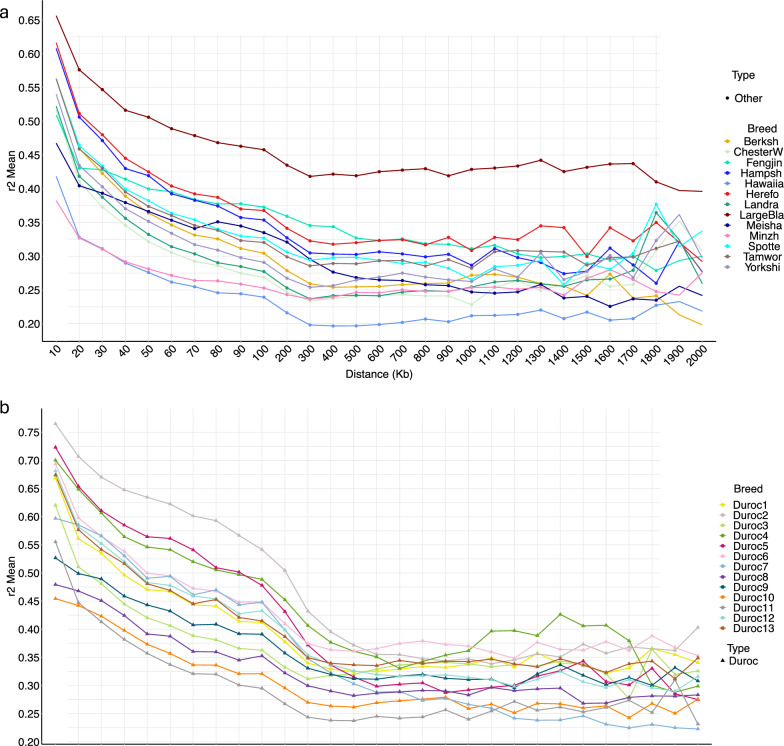 Figure 5
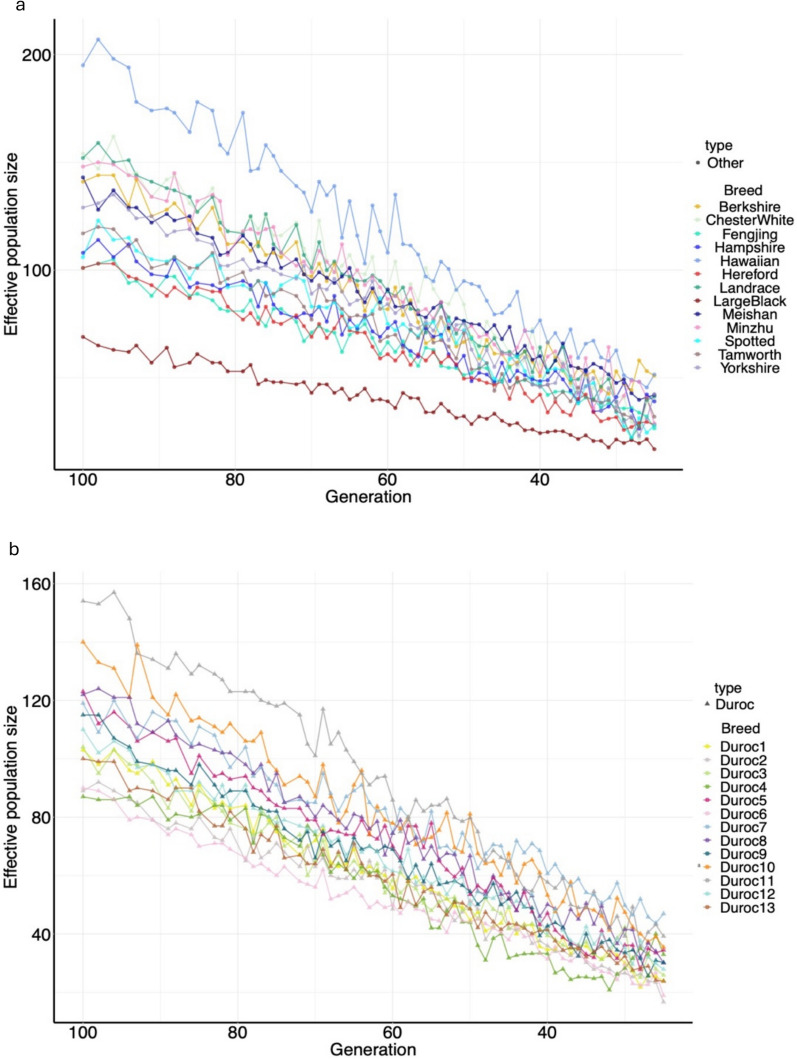 Figure 6
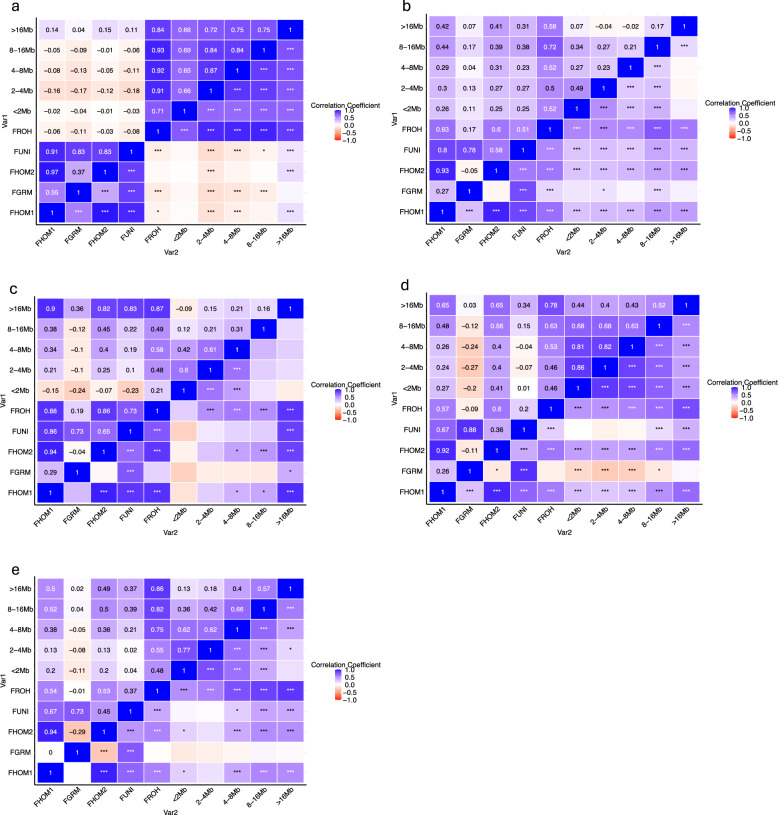 Figure 7
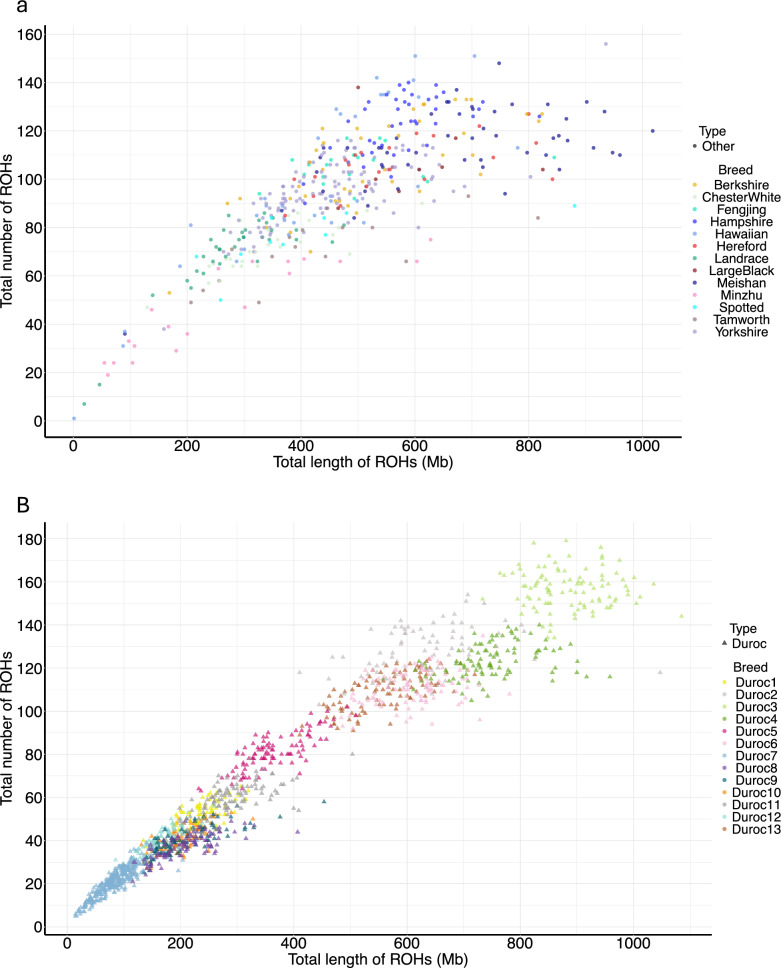 Figure 8
- —http://dx.doi.org/10.13039/100007917Agricultural Research Service
Peer Reviews
No public reviews on file for this paper yet. If you reviewed it on a platform where reviews are public (OpenReview, ICLR, NeurIPS, ICML), you can paste yours below so the community can read it here.
Videos
No videos yet. Explain this paper in a talk, walkthrough, or lecture? Add one.
Taxonomy
TopicsGenetic Mapping and Diversity in Plants and Animals · Xenotransplantation and immune response · Genetic and phenotypic traits in livestock
Background
Duroc is one of the most popular terminal sire pig breeds in the world due to its high growth rate, meat quality, feed efficiency, and carcass characteristics [1]. The Duroc breed (Fig. 1) was developed in the United States in the early to mid-1800s, particularly in the areas around New York and New Jersey [2]. However, the origin of Durocs and the breeds that contributed to their formation are still unknown. The Duroc breed provides an interesting model for evaluating the genetic diversity of Sus scrofa. Previous scientific literature has consistently shown them to be unique when compared to other pig breeds. Furthermore, both principal component (PCA) and admixture analyses by Ding et al. [3] indicate that the Duroc breed is distinct from European and Asian pig breeds. The history of the Duroc breed can be traced back to 1812, when “Red Hogs” (pigs with a reddish coat color and undefined breed) were being bred in New York and New Jersey. The modern Duroc is believed to have been developed between 1822 and 1877 by combining the Old Duroc from New York and the Jersey Red (so named in 1857) from New Jersey. The American Duroc-Jersey Association was formed in 1883 [4]. In the early formation of the breed, Durocs were known to gain weight quickly and to have relatively large litters [5]. The deeper origins of Duroc progenitors are, however, not clear. There are reports of red pigs being imported from the UK, perhaps a Red Berkshire [6]. However, it is also known that, similar to the trade routes for goats proposed by Paim et al. [7], red hogs from the Iberian Peninsula and Africa, may have played a role in breed formation of the Duroc.Fig. 1. Figures of Duroc pigs. a and b European Durocs (Photo credits: Topigs Norsvin); c a North American Duroc piglet (Photo credits: Hendrix Genetics); d North American Duroc gilts (Photo credits: Hendrix Genetics); and, e an Australian Duroc sow
Over the past century, Durocs have been exported from the United States to many other countries and bred into various lines with distinct characteristics through continuous selection and breeding programs. However, many questions still remain regarding the development history of the Duroc breed, such as its genetic diversity and its genetic relationships with other pig breeds. Previous research has shown that genetic diversity in the Duroc breed has decreased over the past decade in China [16] and elsewhere. Wang et al. [8] reported that American Duroc pigs exhibit greater genetic diversity and lower inbreeding levels compared to Canadian Durocs. These findings indicate that there may be genetic differences within the breed due to various selection intensities and breeding goals across geographical regions and breeding companies, as well as potential introgressions from other breeds in some Duroc subpopulations. Therefore, it is important to quantify the genetic structure and variability within and between Duroc subpopulations and other pig breeds. Such an evaluation is expected to contribute to our understanding of genetic diversity in the Duroc breed and to the development of sustainable breeding strategies and the potential exchange of genetic material across subpopulations.
Due to the breed’s popularity as terminal sire in commercial crossbreeding schemes, Duroc pigs have undergone intensive selection for key breeding goals based on terminal sire indexes focusing on postweaning performance, carcass characteristics, feed efficiency, and meat quality [9, 10]. The most commonly evaluated traits in Duroc pigs include average daily gain, feed conversion ratio, backfat thickness, and intramuscular fat [8]. Evaluating the inbreeding level and maintaining sufficient genetic diversity in each (sub)population is essential for long-term sustainable genetic improvement. Accumulation of inbreeding can increase the likelihood of genetic drift and the appearance of harmful recessive mutations [11]. Furthermore, decreased genetic diversity can undermine selection progress for any trait in a breeding program [12]. This is particularly important for enhancing their fitness and adaptation to face global warming conditions [13]. Moreover, understanding inbreeding levels and overall genetic diversity within the Duroc breed is essential for informing future breeding decisions and could contribute to long-term conservation strategies, including the use of national gene banks [14, 15].
The availability of large-scale genomic information allows us to evaluate runs of homozygosity (ROH) for individuals and populations. ROH has been widely used to investigate evolutionary history and the inbreeding levels in populations by examining different patterns of ROH length and distribution in the genome [17]. For instance, Shi et al. [18] reported twelve ROH islands harboring genes associated with reproduction, muscle development, fat deposition, and adaptation in Yorkshire pigs. However, a comprehensive comparison of ROH among Durocs and other breeds has not yet been performed.
In this study, we systematically compared the genome of domestic Duroc pigs from different geographic origins and Duroc subpopulations from various corporate lines and smaller Duroc breeders. Our main objectives were to: (1) assess the within- and between-population genetic diversity of Duroc pigs from Europe, North America, and Australia, in comparison with other 13 pig breed populations; (2) quantify the genomic inbreeding level of each (sub)population; and, (3) identify shared ROH islands between subgroups and fixation index (F_ST_) regions between Duroc and Yorkshire (a maternal line breed) populations.
Material and methods
Populations studied
Data from 1,858 pigs were used in this study, including 1,409 Duroc pigs and 449 pigs from other breeds (abbreviated as “OBPs”, including Berkshire, Chester White, Fengjing, Hampshire, Hawaiian, Hereford, Landrace, Large Black, Meishan, Minzhu, Spotted, Tamworth, and Yorkshire breeds; Table 1). Thirteen Duroc subpopulations were sampled. Twelve of which were from corporate nucleus lines, and one (Duroc9) was a White Duroc population, which is a composite population developed based on Durocs and maternal line breeds (e.g., Yorkshire). Although the term “White Duroc” is commercially used, to our knowledge, there is no official breed definition for this composite population. The corporate lines were from Europe (n = 1, Duroc13), Australia (n = 3, Duroc8, Duroc10, Duroc11), Canada (n = 3, Duroc4, Duroc5, Duroc6), and the United States of America (n = 5, Duroc1, Duroc2, Duroc3, Duroc7, Duroc12). However, some of these subpopulations are owned by large multinational companies that have nucleus herds in multiple countries or continents. One Duroc subpopulation (Duroc3) was curated by the USDA’s National Animal Germplasm Program (NAGP) as part of their work to conserve livestock genetic resources. The NAGP animals were broadly sampled from traditional purebred Duroc breeders in North America. Data on animals from other pig breeds included in the study were also provided by the NAGP swine collection. However, some of the large populations may have been underrepresented based on the sampling strategies used, especially the largest and most common breeds in certain geographical regions (e.g., Danish Landrace and Chinese Meishan).Table 1. Descriptive statistics and genetic diversity estimates for each pig populationGroupBreedRegionN^a^SNP N^b^MAF^c^Ho^d^He^e^DurocDuroc1North America6632,9920.2760.3740.366Duroc2North America10033,4540.2690.3640.360Duroc3North America7644,5130.2820.3650.372Duroc4North America10039,6440.2730.3680.363Duroc5North America10035,5030.2820.3710.371Duroc6North America10031,5860.2700.3630.360Duroc7North America29818,3310.3230.3940.414Duroc8Australia8832,0930.2810.3880.372Duroc9 (White Duroc)North America8528,6790.2700.3760.360Duroc10Australia9632,4240.2880.3880.378Duroc11Australia10029,9390.2960.3920.385Duroc12North America10032,4430.2740.3680.365Duroc13Europe10031,9210.2660.3650.356Other breedsBerkshireUK4646,1720.2660.3470.355Chester WhiteUSA2751,9300.2850.3760.375FengjingChina1928,7980.2370.3590.325HampshireUK4044,0200.2610.3570.350HawaiianUSA-Hawaii3543,4320.2930.3250.382HerefordUSA2244,1060.2830.3800.372LandraceDenmark3551,9440.3040.3980.392Large BlackUK840,5360.2630.3890.351MeishanChina5227,0150.2390.3120.328MinzhuChina1948,5980.2670.3580.357SpottedUSA1049,9890.2710.3680.358TamworthUK1648,4810.2810.3810.371YorkshireUK12051,3770.2960.3750.385^a^N: Number of studied animals^b^SNP N: Number of single nucleotide polymorphisms (SNP) after quality control^c^MAF: Minor allele frequency^d^Ho: Observed homozygosity^e^He: Expected homozygosity
SNP genotyping and quality control
Detailed information on the breeds included in this study, including the geographical regions of data collection, breed names, sample size, and number of single nucleotide polymorphisms (SNP) after quality control (QC), are presented in Table 1. The different populations were genotyped using a wide range of SNP arrays, including proprietary genotyping platforms. QC was conducted using the PLINK software v1.90 [19] based on removal of: (1) SNPs with a call rate lower than 0.95; (2) SNPs with a MAF lower than 0.05; (3) SNPs and individuals with a call rate lower than 0.90; (4) SNPs with extreme departure from Hardy–Weinberg Equilibrium (HWE; P-value < 10^–6^) as an indication of genotyping error; (5) SNPs with unknown or duplicated positions on the genome; and, (6) SNPs located in non-autosomal chromosomes. The SNP genome coordinates were obtained from the Sscrofa 11.1 porcine reference genome assembly (http://useast.ensembl.org/Sus_scrofa/Info/Index). After QC, data from 1,858 individuals were kept for further analyses. Please note that the QC differed depending on the analysis, as explained below.
Population structure analyses
Population structure was evaluated by performing PCA using 3,221 SNPs shared among all populations (after QC). PCA was conducted using the PLINK software v1.90 [19]on all populations (n = 1,858) and also exclusively on the Duroc subpopulations. The R software [20] was used for plotting the PCA results, which were based on a variance-standardized genomic relationship matrix. Ancestry estimation was performed using shared genomic data (3,221 SNPs after QC) among all populations and different numbers of ancestral populations were tested for the Duroc subpopulations (K = 2 to 5) and for all populations (K = 2 to 17) using the ADMIXTURE software v1.2 [21]. The optimal K value was determined based on the lowest cross-validation (CV) error and used for plotting the results (see Additional file 1, Fig. S1). The genetic distance matrix of all studied samples was calculated using the PLINK software v1.90 [19]. A neighbor-joining (NJ) phylogenetic tree was constructed using the FastME package v2.0 [22] and plotted using the Chiplot v2.6 package (www.chiplot.online/tvbot.html [23]).
Linkage disequilibrium (LD, \documentclass[12pt]{minimal} \usepackage{amsmath} \usepackage{wasysym} \usepackage{amsfonts} \usepackage{amssymb} \usepackage{amsbsy} \usepackage{mathrsfs} \usepackage{upgreek} \setlength{\oddsidemargin}{-69pt} \begin{document}$${r}^{2}$$\end{document} ) was calculated for each population using full, population-specific genotype information (after QC, please see in Table 1) and PLINK software v1.90 [19]. In addition, effective population size (Ne) was estimated as [24]:
\documentclass[12pt]{minimal} \usepackage{amsmath} \usepackage{wasysym} \usepackage{amsfonts} \usepackage{amssymb} \usepackage{amsbsy} \usepackage{mathrsfs} \usepackage{upgreek} \setlength{\oddsidemargin}{-69pt} \begin{document}$${N}_{E(t)}=\frac{1}{\left(4f\left({c}_{t}\right)\right)}\left(\frac{1}{E\left[\left.{r}_{adj}^{2}\right|{c}_{t}\right]}-\alpha \right)$$\end{document}Here, \documentclass[12pt]{minimal} \usepackage{amsmath} \usepackage{wasysym} \usepackage{amsfonts} \usepackage{amssymb} \usepackage{amsbsy} \usepackage{mathrsfs} \usepackage{upgreek} \setlength{\oddsidemargin}{-69pt} \begin{document}$${N}_{E(t)}$$\end{document} is the Ne estimated t generations in the past, \documentclass[12pt]{minimal} \usepackage{amsmath} \usepackage{wasysym} \usepackage{amsfonts} \usepackage{amssymb} \usepackage{amsbsy} \usepackage{mathrsfs} \usepackage{upgreek} \setlength{\oddsidemargin}{-69pt} \begin{document}$${c}_{t}$$\end{document} is the recombination rate for a specific physical distance between SNP markers t generations in the past, \documentclass[12pt]{minimal} \usepackage{amsmath} \usepackage{wasysym} \usepackage{amsfonts} \usepackage{amssymb} \usepackage{amsbsy} \usepackage{mathrsfs} \usepackage{upgreek} \setlength{\oddsidemargin}{-69pt} \begin{document}$$\alpha$$\end{document} is the probability of the occurrence of mutation, and \documentclass[12pt]{minimal} \usepackage{amsmath} \usepackage{wasysym} \usepackage{amsfonts} \usepackage{amssymb} \usepackage{amsbsy} \usepackage{mathrsfs} \usepackage{upgreek} \setlength{\oddsidemargin}{-69pt} \begin{document}$${r}_{adj}^{2}$$\end{document} is the LD value calculated based on the correlation between two alleles in from a pair of loci as [24]:
\documentclass[12pt]{minimal} \usepackage{amsmath} \usepackage{wasysym} \usepackage{amsfonts} \usepackage{amssymb} \usepackage{amsbsy} \usepackage{mathrsfs} \usepackage{upgreek} \setlength{\oddsidemargin}{-69pt} \begin{document}$${r}_{adj}\left({p}_{a},{p}_{b},{p}_{ab}\right)=\frac{{({p}_{ab}-{p}_{a}{p}_{b})}^{2}}{{p}_{a}(1-{p}_{a}){p}_{b}(1-{p}_{b})},$$\end{document}where \documentclass[12pt]{minimal} \usepackage{amsmath} \usepackage{wasysym} \usepackage{amsfonts} \usepackage{amssymb} \usepackage{amsbsy} \usepackage{mathrsfs} \usepackage{upgreek} \setlength{\oddsidemargin}{-69pt} \begin{document}$${p}_{a}$$\end{document} is the frequency of allele \documentclass[12pt]{minimal} \usepackage{amsmath} \usepackage{wasysym} \usepackage{amsfonts} \usepackage{amssymb} \usepackage{amsbsy} \usepackage{mathrsfs} \usepackage{upgreek} \setlength{\oddsidemargin}{-69pt} \begin{document}$$a$$\end{document} , \documentclass[12pt]{minimal} \usepackage{amsmath} \usepackage{wasysym} \usepackage{amsfonts} \usepackage{amssymb} \usepackage{amsbsy} \usepackage{mathrsfs} \usepackage{upgreek} \setlength{\oddsidemargin}{-69pt} \begin{document}$${p}_{b}$$\end{document} is the frequency of allele \documentclass[12pt]{minimal} \usepackage{amsmath} \usepackage{wasysym} \usepackage{amsfonts} \usepackage{amssymb} \usepackage{amsbsy} \usepackage{mathrsfs} \usepackage{upgreek} \setlength{\oddsidemargin}{-69pt} \begin{document}$$b$$\end{document} , and \documentclass[12pt]{minimal} \usepackage{amsmath} \usepackage{wasysym} \usepackage{amsfonts} \usepackage{amssymb} \usepackage{amsbsy} \usepackage{mathrsfs} \usepackage{upgreek} \setlength{\oddsidemargin}{-69pt} \begin{document}$${p}_{ab}$$\end{document} is the haplotype frequency with allele \documentclass[12pt]{minimal} \usepackage{amsmath} \usepackage{wasysym} \usepackage{amsfonts} \usepackage{amssymb} \usepackage{amsbsy} \usepackage{mathrsfs} \usepackage{upgreek} \setlength{\oddsidemargin}{-69pt} \begin{document}$$a$$\end{document} at the first locus and allele \documentclass[12pt]{minimal} \usepackage{amsmath} \usepackage{wasysym} \usepackage{amsfonts} \usepackage{amssymb} \usepackage{amsbsy} \usepackage{mathrsfs} \usepackage{upgreek} \setlength{\oddsidemargin}{-69pt} \begin{document}$$b$$\end{document} at the second locus. We estimated Ne at different numbers of past generations (ranging from 25 to 100), for each population and for the whole Duroc population.
Identification of runs of homozygosity
Runs of homozygosity were detected in each population using the PLINK v1.90 software [19]. For ROH analyses, each population was analyzed separately using its full, population-specific SNP set, and the genotype data was not filtered for low MAF. ROH were identified using the following [18], (1) minimum ROH length of 500 kb; (2) a minimum of 15 consecutive SNPs; (3) a maximum gap between consecutive SNPs of 500 kb; (4) a minimum density of one SNP per 75 kb; (5) a sliding window of 50 SNPs across the genome that moved one SNP at a time; and, (6) a maximum of five missing genotypes and one heterozygous genotype. Five classes of ROHs were defined based on their length: < 2 Mb, 2 – 4 Mb, 4 – 8 Mb, 8 – 16 Mb, and > 16 Mb. ROH islands were identified based on the per-SNP ROH incidence, calculated as the percentage of individuals for which the SNP was included in a ROH. A dual-threshold approach was used to define relevant SNPs, which were required to satisfy two criteria: (1) an incidence within the top 1% quantile (99th percentile) of that population’s empirical distribution [25], and (2) an incidence of at least 35%. Finally, candidate SNPs that satisfied both conditions and that were separated by less than 100 kb were merged to form contiguous ROH island regions.
The detectRUNs [26] and GenomicRanges [27] R packages were used to detect shared ROH islands in five groups of subpopulations that were identified based on PCA and phylogenetic tree analyses. These included European and North American Durocs, Australian Durocs (Duroc9, Duroc10, and Duroc11), Asian-Pacific breeds (Meishan, Minzhu, Fengjing, and Hawaiian pigs), OBP1 (Tamworth and Hereford), and OBP2 (Berkshire, ChesterWhite, Hampshire, Landrace, Large Black, Spotted, and Yorkshire). The shared ROH islands were used to retrieve positional candidate genes, whichwere annotated based on the latest genome reference Sscrofa 11.1 assembly (http://useast.ensembl.org/Sus_scrofa/Info/Index). Gene Ontology (GO) terms [28] and Kyoto Encyclopedia of Genes and Genomes (KEGG) [29] enrichment analyses were conducted for the candidate genes using the ClusterProfiler R package [30].
Genomic inbreeding coefficients
Ten metrics of genomic inbreeding coefficients ( \documentclass[12pt]{minimal} \usepackage{amsmath} \usepackage{wasysym} \usepackage{amsfonts} \usepackage{amssymb} \usepackage{amsbsy} \usepackage{mathrsfs} \usepackage{upgreek} \setlength{\oddsidemargin}{-69pt} \begin{document}$$\text{F}$$\end{document} ) were calculated using the PLINK software v1.90 [19], including:
- \documentclass[12pt]{minimal} \usepackage{amsmath} \usepackage{wasysym} \usepackage{amsfonts} \usepackage{amssymb} \usepackage{amsbsy} \usepackage{mathrsfs} \usepackage{upgreek} \setlength{\oddsidemargin}{-69pt} \begin{document}$${\text{F}}_{\text{GRM}},$$\end{document} genomic inbreeding coefficients based on the genomic relationship (G) matrix, which was calculated as [31]:
where \documentclass[12pt]{minimal} \usepackage{amsmath} \usepackage{wasysym} \usepackage{amsfonts} \usepackage{amssymb} \usepackage{amsbsy} \usepackage{mathrsfs} \usepackage{upgreek} \setlength{\oddsidemargin}{-69pt} \begin{document}$${\mathbf{G}}_{\mathbf{i}\mathbf{i}}$$\end{document} is the* i*th G matrix diagonal element for individual \documentclass[12pt]{minimal} \usepackage{amsmath} \usepackage{wasysym} \usepackage{amsfonts} \usepackage{amssymb} \usepackage{amsbsy} \usepackage{mathrsfs} \usepackage{upgreek} \setlength{\oddsidemargin}{-69pt} \begin{document}$$\text{i}$$\end{document}
- \documentclass[12pt]{minimal} \usepackage{amsmath} \usepackage{wasysym} \usepackage{amsfonts} \usepackage{amssymb} \usepackage{amsbsy} \usepackage{mathrsfs} \usepackage{upgreek} \setlength{\oddsidemargin}{-69pt} \begin{document}$${\text{F}}_{\text{ROH}},$$\end{document} genomic inbreeding coefficients based on all ROH segments. Individual \documentclass[12pt]{minimal} \usepackage{amsmath} \usepackage{wasysym} \usepackage{amsfonts} \usepackage{amssymb} \usepackage{amsbsy} \usepackage{mathrsfs} \usepackage{upgreek} \setlength{\oddsidemargin}{-69pt} \begin{document}$${\text{F}}_{\text{ROH}}$$\end{document} (i.e., proportion of the genome covered by ROH) was calculated as:
where \documentclass[12pt]{minimal} \usepackage{amsmath} \usepackage{wasysym} \usepackage{amsfonts} \usepackage{amssymb} \usepackage{amsbsy} \usepackage{mathrsfs} \usepackage{upgreek} \setlength{\oddsidemargin}{-69pt} \begin{document}$${\text{L}}_{{\text{ROH}}_{\text{I}}}$$\end{document} is the length of all \documentclass[12pt]{minimal} \usepackage{amsmath} \usepackage{wasysym} \usepackage{amsfonts} \usepackage{amssymb} \usepackage{amsbsy} \usepackage{mathrsfs} \usepackage{upgreek} \setlength{\oddsidemargin}{-69pt} \begin{document}$${\text{ROH}}_{\text{I}}$$\end{document} of individual \documentclass[12pt]{minimal} \usepackage{amsmath} \usepackage{wasysym} \usepackage{amsfonts} \usepackage{amssymb} \usepackage{amsbsy} \usepackage{mathrsfs} \usepackage{upgreek} \setlength{\oddsidemargin}{-69pt} \begin{document}$$\text{i}$$\end{document} and \documentclass[12pt]{minimal} \usepackage{amsmath} \usepackage{wasysym} \usepackage{amsfonts} \usepackage{amssymb} \usepackage{amsbsy} \usepackage{mathrsfs} \usepackage{upgreek} \setlength{\oddsidemargin}{-69pt} \begin{document}$${\text{L}}_{\text{auto}}$$\end{document} is the autosomal genome length covered by the SNPs that passed the QC. The \documentclass[12pt]{minimal} \usepackage{amsmath} \usepackage{wasysym} \usepackage{amsfonts} \usepackage{amssymb} \usepackage{amsbsy} \usepackage{mathrsfs} \usepackage{upgreek} \setlength{\oddsidemargin}{-69pt} \begin{document}$${\text{F}}_{\text{ROH}}$$\end{document} for each individual was calculated including all ROH segments ( \documentclass[12pt]{minimal} \usepackage{amsmath} \usepackage{wasysym} \usepackage{amsfonts} \usepackage{amssymb} \usepackage{amsbsy} \usepackage{mathrsfs} \usepackage{upgreek} \setlength{\oddsidemargin}{-69pt} \begin{document}$${\text{F}}_{\text{ROH}}$$\end{document} ), ROH segments < 2 Mb ( \documentclass[12pt]{minimal} \usepackage{amsmath} \usepackage{wasysym} \usepackage{amsfonts} \usepackage{amssymb} \usepackage{amsbsy} \usepackage{mathrsfs} \usepackage{upgreek} \setlength{\oddsidemargin}{-69pt} \begin{document}$${\text{F}}_{\text{ROH}\left(<2\text{Mb}\right)}$$\end{document} ), as well as ROH segments ranging from 2 to 4 Mb ( \documentclass[12pt]{minimal} \usepackage{amsmath} \usepackage{wasysym} \usepackage{amsfonts} \usepackage{amssymb} \usepackage{amsbsy} \usepackage{mathrsfs} \usepackage{upgreek} \setlength{\oddsidemargin}{-69pt} \begin{document}$${\text{F}}_{\text{ROH}\left(2-4\text{Mb}\right)}$$\end{document} ), 4-8 Mb ( \documentclass[12pt]{minimal} \usepackage{amsmath} \usepackage{wasysym} \usepackage{amsfonts} \usepackage{amssymb} \usepackage{amsbsy} \usepackage{mathrsfs} \usepackage{upgreek} \setlength{\oddsidemargin}{-69pt} \begin{document}$${\text{F}}_{\text{ROH}\left(4-8\text{Mb}\right)}$$\end{document} ), 8-16 Mb ( \documentclass[12pt]{minimal} \usepackage{amsmath} \usepackage{wasysym} \usepackage{amsfonts} \usepackage{amssymb} \usepackage{amsbsy} \usepackage{mathrsfs} \usepackage{upgreek} \setlength{\oddsidemargin}{-69pt} \begin{document}$${\text{F}}_{\text{ROH}\left(8-16\text{Mb}\right)}$$\end{document} ), and > 16 Mb ( \documentclass[12pt]{minimal} \usepackage{amsmath} \usepackage{wasysym} \usepackage{amsfonts} \usepackage{amssymb} \usepackage{amsbsy} \usepackage{mathrsfs} \usepackage{upgreek} \setlength{\oddsidemargin}{-69pt} \begin{document}$${\text{F}}_{\text{ROH}\left(> 16\text{Mb}\right)}$$\end{document} ) in length.
- \documentclass[12pt]{minimal} \usepackage{amsmath} \usepackage{wasysym} \usepackage{amsfonts} \usepackage{amssymb} \usepackage{amsbsy} \usepackage{mathrsfs} \usepackage{upgreek} \setlength{\oddsidemargin}{-69pt} \begin{document}$${\text{F}}_{\text{HOM}1},$$\end{document} genomic inbreeding based on the difference between observed and expected homozygous genotypes, calculated as [19]:
where \documentclass[12pt]{minimal} \usepackage{amsmath} \usepackage{wasysym} \usepackage{amsfonts} \usepackage{amssymb} \usepackage{amsbsy} \usepackage{mathrsfs} \usepackage{upgreek} \setlength{\oddsidemargin}{-69pt} \begin{document}$${\text{H}}_{\text{exp}}$$\end{document} and \documentclass[12pt]{minimal} \usepackage{amsmath} \usepackage{wasysym} \usepackage{amsfonts} \usepackage{amssymb} \usepackage{amsbsy} \usepackage{mathrsfs} \usepackage{upgreek} \setlength{\oddsidemargin}{-69pt} \begin{document}$${\text{H}}_{\text{obs}}$$\end{document} are the expected and observed values, respectively, for homozygous genotypes.
- d) \documentclass[12pt]{minimal} \usepackage{amsmath} \usepackage{wasysym} \usepackage{amsfonts} \usepackage{amssymb} \usepackage{amsbsy} \usepackage{mathrsfs} \usepackage{upgreek} \setlength{\oddsidemargin}{-69pt} \begin{document}$${\text{F}}_{\text{HOM}2,}$$\end{document} genomic inbreeding based on homozygous genotype, which was calculated as:
where \documentclass[12pt]{minimal} \usepackage{amsmath} \usepackage{wasysym} \usepackage{amsfonts} \usepackage{amssymb} \usepackage{amsbsy} \usepackage{mathrsfs} \usepackage{upgreek} \setlength{\oddsidemargin}{-69pt} \begin{document}$${\text{x}}_{\text{i}}$$\end{document} is the number of reference allele copies at the ith SNP and \documentclass[12pt]{minimal} \usepackage{amsmath} \usepackage{wasysym} \usepackage{amsfonts} \usepackage{amssymb} \usepackage{amsbsy} \usepackage{mathrsfs} \usepackage{upgreek} \setlength{\oddsidemargin}{-69pt} \begin{document}$${\text{p}}_{\text{i}}$$\end{document} is the reference allele frequency in the population.
- \documentclass[12pt]{minimal} \usepackage{amsmath} \usepackage{wasysym} \usepackage{amsfonts} \usepackage{amssymb} \usepackage{amsbsy} \usepackage{mathrsfs} \usepackage{upgreek} \setlength{\oddsidemargin}{-69pt} \begin{document}$${\text{F}}_{\text{UNI}},$$\end{document} genomic inbreeding coefficients based on uniting gametes, calculated as [32]:
Pearson’s correlations were calculated between all pairs of genomic inbreeding coefficients. A heatmap was created to visualize the inbreeding coefficient correlations using the ggplot2 R package [33].
Selective signals
To more accurately identify potential selective signals (selection sweeps) between terminal sire (Duroc) and maternal (Yorkshire) lines, we used a sliding-window approach (100-kb windows sliding in 10-kb steps) to quantify the levels of genetic differentiation (F_ST_) between Duroc (European and North American Durocs and Australian Durocs) and Yorkshire pigs using VCFtools (v.0.1.14, [34]). The full (population-specific) genotype information (after QC, Table 1) was used for these analyses. Genomic windows that were in the top 1% based on F_ST_ were considered as selection sweeps.
Results
Genetic diversity
Descriptive statistics and genetic diversity estimates for each population, including geographical regions of data collection, breed names, sample size, number of SNPs after QC, average MAF, observed heterozygosity (Ho), and expected heterozygosity (H_E_) are presented in Table 1. The MAF ranged from 0.27 (Duroc13) to 0.32 (Duroc7) and from 0.24 (Fengjing) to 0.30 (Landrace) in Durocs and OBPs, respectively. In Durocs, Ho and He ranged from 0.36 (Duroc6) to 0.39 (Duroc7) and from 0.36 (Duroc13) to 0.41 (Duroc7), respectively. In OBPs, Ho and He ranged from 0.31 (Meishan) to 0.40 (Landrace) and from 0.33 (Fengjing) to 0.39 (Landrace) and, respectively. Two pig breeds (Meishan and Fengjing pigs) had lower MAF and H_E_ indicating that the sampled Chinese indigenous pig breeds had relatively low levels of genetic diversity (Table 1). Most populations in our study exhibited similar levels of H_E_ and Ho. However, Fengjing pigs had higher Ho (0.36) than H_E_ (0.33), while Hawaiian pigs had greater H_E_ (0.38) than Ho (0.33).
Population structure analyses
The genetic relationships among pig populations were examined using PCA (Fig. 2a and b) and phylogenetic trees (Fig. 3). The first three principal components explained 19.2%, 12.8%, and 10.4% of the total variation for all Durocs, respectively. The first two PCs differentiated the European and North American Durocs, Australian Durocs, Asia–Pacific pigs, OBP1 (Tamworth and Hereford), and OBP2 (Berkshire, Chester White, Hampshire, Landrace, Large Black, Spotted, and Yorkshire) subgroups (Fig. 2a). The Duroc3 and Duroc7 clustered together based on the Fig. 2b, especially compared to other Duroc populations. The same five clades (see Fig. 3) were observed in the NJ tree. Clade I consisted of all Durocs from North America and Europe, Clade II was formed by Tamworth and Hereford, which are phenotypically similar to the Duroc breed, Clade III consisted of Durocs from Australia, Clade IV included Chinese indigenous pigs and Hawaiian pigs, and Clade V contained the remaining breeds that originated in Europe. OBP1 pigs (Hereford and Tamworth) occupied intermediate positions between the two major clades—European and North American Durocs, and Australian Durocs. This pattern was observed based on both PCA (Fig. 2) and NJ phylogenetic tree (Fig. 3) results.Fig. 2. Global genetic structure of various Duroc sub-populations and other pig breedsFig. 3Neighbor-joining phylogenetic tree of 1835 individuals from Duroc sub-populations and other pig breeds
The European and North American Durocs clade in the phylogenetic tree included four main branches: (i) Duroc9, the White Duroc population, is a composite population of Duroc and white pig breeds (e.g., Yorkshire or Landrace). Both of these breeds are commonly used in commercial breeding for their desirable traits; (ii) Duroc7 and Duroc3, with Duroc7 further subdividing into three sub-branches; (iii) Duroc2, which was divided into two parts; and, (iv) Duroc4, Duroc5, and Duroc6, which clustered together.
For the combined Duroc populations, ADMIXTURE was run for K values ranging from 2 to 5 (Fig. 4a for K from 2 to 4). The lowest CV error was found for K = 4, which represents the most probable number of ancestral populations in Durocs. At K = 2, the majority of Duroc populations had relatively similar proportions of the two clusters, however two populations (Duroc7 and Duroc3) did not exhibit this pattern, consistent with the results observed based on the PCA (Fig. 2b). At K = 3, the Australian populations differed from the European and North American populations, except for Duroc3, Duroc7, and Duroc9. At K = 4, the proportion assignments to the clusters differed globally (e.g., Duroc7 and Duroc3, Australian Duroc group, and the rest of the Duroc populations).Fig. 4. Admixture analysis a) in Duroc sub-populations (K = 2 to 4); and b) in all pig populations (K = 4 to 15). Each vertical bar stands for an individual and each color represent a different ancestral population. In Fig. 4b, the pig populations are Duroc7, Duroc3, Duroc6, Duroc12, Duroc2, Duroc1, Duroc4, Duroc5, Duroc13, Duroc9, Duroc10, Duroc8, Duroc11, Tamworth, Hereford, Meishan, Fengjing, Minzhu, Hawaiian, Berkshire, Hampshire, Spotted, Landrace, Chester White, and Yorkshire, respectively.
To compare Durocs and other pig breeds, K values from 2 to 17 (Fig. 4b) were tested for all pig populations included in the study. However, for K = 13 to 17, the CV error values decreased by less than 1% per unit increase in K. Therefore, only results for K values of 2, 4, 6, 8, 12, and 15 were plotted. At K = 4, European and North American Durocs, Australian Durocs, OBP1, and OBP2 were more similar to each other. At K = 2, 4, 6, and 8, the Duroc9 White Duroc population (located at the extreme right of the European and North American Duroc population cluster) showed a more similar ancestral background with Australian Durocs, a pattern also observed in the PCA plot. This may indicate that both White Duroc and Australian Durocs have genetic contributions from similar other breeds (e.g., Yorkshire). At K = 12, we observed greater variability within European and North American Durocs.
To compare the extent of LD across all studied populations, mean \documentclass[12pt]{minimal} \usepackage{amsmath} \usepackage{wasysym} \usepackage{amsfonts} \usepackage{amssymb} \usepackage{amsbsy} \usepackage{mathrsfs} \usepackage{upgreek} \setlength{\oddsidemargin}{-69pt} \begin{document}$${r}^{2}$$\end{document} was calculated for each 100 kb window and the LD decay based on physical distance between SNP pairs up to 2,000 kb was plotted (Fig. 5a and b). European and North American Durocs had relatively higher LD levels compared to Australian Durocs (Fig. 5b) but these differences decreased as the distance between markers increased and approached background LD levels. The latter refers to average level of LD that is more stable across the genome in a population, at 500 kb distance in all the Duroc populations, with an average \documentclass[12pt]{minimal} \usepackage{amsmath} \usepackage{wasysym} \usepackage{amsfonts} \usepackage{amssymb} \usepackage{amsbsy} \usepackage{mathrsfs} \usepackage{upgreek} \setlength{\oddsidemargin}{-69pt} \begin{document}$${r}^{2}$$\end{document} = 0.316. However, most OBP populations reached their background LD levels at 300 kb (see Fig. 5a). More rapid LD decay was observed for the other breeds than for the Duroc subpopulations.Fig. 5. Linkage disequilibrium (LD; measured as r^2^) of different pig populations. a) LD of selected pig breeds; b) LD of Duroc sub-populations
We also estimate the Ne of all studied populations over their past 25 to 100 generations (Fig. 6 and see Additional file 3, Table S1). The estimated Ne (172) for the whole Duroc population indicates substantial genetic variability across sub-populations. The estimated Ne for Duroc subpopulations at the most recent evaluated generation (generation 25) ranged from 17 (Duroc2) to 47 (Duroc7). Australian Durocs had relatively high Ne (30 for Duroc8 to 39 for Duroc11). Hawaiian pigs had the highest Ne estimate (52) in the most recent generation, while Large Black pigs had the lowest estimate of Ne (17).Fig. 6. Effective population size (Ne) of different pig populations. a) Ne of selected pig breeds; b) Ne of each Duroc sub-population
Among the ten genomic inbreeding coefficients evaluated, F_ROH_ consistently had the highest estimates across all populations (Table 2). The Duroc3 population showed the greatest inbreeding based on F_ROH_ (0.362), not only among Durocs but across all populations studied. In contrast, the indigenous Fengjing population exhibited the lowest average genomic inbreeding based on \documentclass[12pt]{minimal} \usepackage{amsmath} \usepackage{wasysym} \usepackage{amsfonts} \usepackage{amssymb} \usepackage{amsbsy} \usepackage{mathrsfs} \usepackage{upgreek} \setlength{\oddsidemargin}{-69pt} \begin{document}$${F}_{HOM1}$$\end{document} (-0.104), \documentclass[12pt]{minimal} \usepackage{amsmath} \usepackage{wasysym} \usepackage{amsfonts} \usepackage{amssymb} \usepackage{amsbsy} \usepackage{mathrsfs} \usepackage{upgreek} \setlength{\oddsidemargin}{-69pt} \begin{document}$${F}_{GRM}$$\end{document} (-0.086), \documentclass[12pt]{minimal} \usepackage{amsmath} \usepackage{wasysym} \usepackage{amsfonts} \usepackage{amssymb} \usepackage{amsbsy} \usepackage{mathrsfs} \usepackage{upgreek} \setlength{\oddsidemargin}{-69pt} \begin{document}$${F}_{HOM2}$$\end{document} (-0.086), and \documentclass[12pt]{minimal} \usepackage{amsmath} \usepackage{wasysym} \usepackage{amsfonts} \usepackage{amssymb} \usepackage{amsbsy} \usepackage{mathrsfs} \usepackage{upgreek} \setlength{\oddsidemargin}{-69pt} \begin{document}$${F}_{UNI}$$\end{document} (-0.086), except for \documentclass[12pt]{minimal} \usepackage{amsmath} \usepackage{wasysym} \usepackage{amsfonts} \usepackage{amssymb} \usepackage{amsbsy} \usepackage{mathrsfs} \usepackage{upgreek} \setlength{\oddsidemargin}{-69pt} \begin{document}$${F}_{ROH}$$\end{document} and its derived metrics.Table 2. Measures of genomic inbreeding coefficients in Duroc subpopulations and other pig breedsGroupBreedFHOM1^a^FGRM^b^FHOM2^c^FUNI^d^FROH^e^ < 2Mb^f^2− 4Mb^g^4− 8Mb^h^8− 16Mb^i^ > 16Mb^j^DurocDuroc10.1900.0980.1550.1540.0980.0050.0290.0340.0220.008Duroc2− 0.011− 0.011− 0.011− 0.0110.2620.0250.0520.0640.0660.088Duroc30.0300.0250.0300.0270.3620.0190.0590.0880.0970.100Duroc4− 0.015− 0.014− 0.014− 0.0140.3050.0060.0630.0850.0720.080Duroc5− 0.001− 0.001− 0.001− 0.0010.1490.0100.0360.0500.0370.016Duroc6− 0.009− 0.010− 0.010− 0.0100.2490.0110.0530.0640.0680.054Duroc70.0490.0440.0440.0440.0350.0020.0120.0130.0060.001Duroc8− 0.043− 0.042− 0.042− 0.0420.0860.0030.0170.0260.0230.017Duroc9 (White Duroc)− 0.044− 0.042− 0.042− 0.0420.0860.0030.0200.0280.0250.011Duroc10− 0.026− 0.027− 0.027− 0.0270.0830.0040.0210.0280.0180.012Duroc11− 0.018− 0.018− 0.018− 0.0180.1200.0080.0280.0350.0320.017Duroc12− 0.007− 0.006− 0.006− 0.0060.0660.0040.0200.0260.0140.002Duroc13− 0.025− 0.024− 0.024− 0.0240.2280.0120.0540.0620.0580.043Other BreedsBerkshire0.030− 0.0320.0500.0090.2220.0280.0570.0640.0610.078ChesterWhite− 0.004− 0.005− 0.005− 0.0050.1410.0140.0290.0290.0310.038Fengjing− 0.104− 0.086− 0.086− 0.0860.2030.0190.0490.0400.0310.064Hampshire− 0.019− 0.021− 0.021− 0.0210.2360.0230.0500.0600.0470.057Hawaiian0.1050.1050.1040.1050.1680.0180.0380.0420.0330.035Hereford− 0.020− 0.020− 0.020− 0.0200.2320.0190.0400.0490.0530.071Landrace− 0.012− 0.011− 0.011− 0.0110.1140.0140.0290.0300.0250.017LargeBlack− 0.093− 0.090− 0.090− 0.0900.2460.0190.0400.0480.0540.085Meishan0.0470.0440.0440.0440.2730.0190.0410.0560.0510.105Minzhu− 0.0040.0020.0020.0020.1060.0090.0200.0180.0150.043Spotted− 0.028− 0.031− 0.031− 0.0310.1660.0140.0300.0330.0310.058Tamworth− 0.028− 0.027− 0.027− 0.0270.1730.0120.0270.0300.0430.062Yorkshire0.0300.0420.0320.0370.1830.0190.0360.0400.0410.051^a^FHOM1: Genomic inbreeding based on homozygous genotypes observed and expected^b^FGRM: Genomic inbreeding coefficients based on the diagonal elements of the genomic relationship matrix^c^FHOM2: Genomic inbreeding based on homozygous genotype^d^FUNI: Genomic inbreeding coefficients based on the uniting gametes method^e^FROH: Genomic inbreeding coefficients based on runs of homozygosity (ROH)^f^ < 2 Mb: Genomic inbreeding coefficients based on ROHs shorter than 2 Mb in length^g^2-4 Mb: Genomic inbreeding coefficients based on ROHs ranging from 2 to 4 Mb in length^h^4-8 Mb: Genomic inbreeding coefficients based on ROHs ranging from 4 to 8 Mb in length^i^8-16 Mb: Genomic inbreeding coefficients based on ROHs ranging from 8 to 16 Mb in length^j^ > 16 Mb: Genomic inbreeding coefficients based on ROHs greater than 16 Mb in length
Pearson’s correlation coefficients among all pairs of inbreeding coefficients for each subgroup (European and North American Durocs, Australian Durocs, OBP1, OBP2, and Asian-Pacific pigs) are presented in Fig. 7. Strong correlations (> 0.67) were found for all subgroups between \documentclass[12pt]{minimal} \usepackage{amsmath} \usepackage{wasysym} \usepackage{amsfonts} \usepackage{amssymb} \usepackage{amsbsy} \usepackage{mathrsfs} \usepackage{upgreek} \setlength{\oddsidemargin}{-69pt} \begin{document}$${F}_{HOM1}$$\end{document} and \documentclass[12pt]{minimal} \usepackage{amsmath} \usepackage{wasysym} \usepackage{amsfonts} \usepackage{amssymb} \usepackage{amsbsy} \usepackage{mathrsfs} \usepackage{upgreek} \setlength{\oddsidemargin}{-69pt} \begin{document}$${F}_{UNI}$$\end{document} , \documentclass[12pt]{minimal} \usepackage{amsmath} \usepackage{wasysym} \usepackage{amsfonts} \usepackage{amssymb} \usepackage{amsbsy} \usepackage{mathrsfs} \usepackage{upgreek} \setlength{\oddsidemargin}{-69pt} \begin{document}$${F}_{HOM1}$$\end{document} and \documentclass[12pt]{minimal} \usepackage{amsmath} \usepackage{wasysym} \usepackage{amsfonts} \usepackage{amssymb} \usepackage{amsbsy} \usepackage{mathrsfs} \usepackage{upgreek} \setlength{\oddsidemargin}{-69pt} \begin{document}$${F}_{HOM2}$$\end{document} , and \documentclass[12pt]{minimal} \usepackage{amsmath} \usepackage{wasysym} \usepackage{amsfonts} \usepackage{amssymb} \usepackage{amsbsy} \usepackage{mathrsfs} \usepackage{upgreek} \setlength{\oddsidemargin}{-69pt} \begin{document}$${F}_{GRM}$$\end{document} and \documentclass[12pt]{minimal} \usepackage{amsmath} \usepackage{wasysym} \usepackage{amsfonts} \usepackage{amssymb} \usepackage{amsbsy} \usepackage{mathrsfs} \usepackage{upgreek} \setlength{\oddsidemargin}{-69pt} \begin{document}$${F}_{UNI}$$\end{document} . In the European and North American Duroc populations, \documentclass[12pt]{minimal} \usepackage{amsmath} \usepackage{wasysym} \usepackage{amsfonts} \usepackage{amssymb} \usepackage{amsbsy} \usepackage{mathrsfs} \usepackage{upgreek} \setlength{\oddsidemargin}{-69pt} \begin{document}$${F}_{ROH}$$\end{document} had zero to negative correlations (0 to − 0.11) with \documentclass[12pt]{minimal} \usepackage{amsmath} \usepackage{wasysym} \usepackage{amsfonts} \usepackage{amssymb} \usepackage{amsbsy} \usepackage{mathrsfs} \usepackage{upgreek} \setlength{\oddsidemargin}{-69pt} \begin{document}$${F}_{UNI}$$\end{document} , \documentclass[12pt]{minimal} \usepackage{amsmath} \usepackage{wasysym} \usepackage{amsfonts} \usepackage{amssymb} \usepackage{amsbsy} \usepackage{mathrsfs} \usepackage{upgreek} \setlength{\oddsidemargin}{-69pt} \begin{document}$${F}_{HOM2}$$\end{document} , \documentclass[12pt]{minimal} \usepackage{amsmath} \usepackage{wasysym} \usepackage{amsfonts} \usepackage{amssymb} \usepackage{amsbsy} \usepackage{mathrsfs} \usepackage{upgreek} \setlength{\oddsidemargin}{-69pt} \begin{document}$${F}_{GRM}$$\end{document} , and \documentclass[12pt]{minimal} \usepackage{amsmath} \usepackage{wasysym} \usepackage{amsfonts} \usepackage{amssymb} \usepackage{amsbsy} \usepackage{mathrsfs} \usepackage{upgreek} \setlength{\oddsidemargin}{-69pt} \begin{document}$${F}_{HOM1}$$\end{document} , which was not expected. In other subgroups, \documentclass[12pt]{minimal} \usepackage{amsmath} \usepackage{wasysym} \usepackage{amsfonts} \usepackage{amssymb} \usepackage{amsbsy} \usepackage{mathrsfs} \usepackage{upgreek} \setlength{\oddsidemargin}{-69pt} \begin{document}$${F}_{GRM}$$\end{document} had correlations ranging from low negative to positive with \documentclass[12pt]{minimal} \usepackage{amsmath} \usepackage{wasysym} \usepackage{amsfonts} \usepackage{amssymb} \usepackage{amsbsy} \usepackage{mathrsfs} \usepackage{upgreek} \setlength{\oddsidemargin}{-69pt} \begin{document}$${F}_{ROH}$$\end{document} (-0.09 for OBP2: to 0.18 for Australian Durocs), and consistently low to negative correlations with \documentclass[12pt]{minimal} \usepackage{amsmath} \usepackage{wasysym} \usepackage{amsfonts} \usepackage{amssymb} \usepackage{amsbsy} \usepackage{mathrsfs} \usepackage{upgreek} \setlength{\oddsidemargin}{-69pt} \begin{document}$${F}_{HOM2}$$\end{document} (-0.29 for Asian-Pacific pigsto − 0.04 for OBP1). In Australian Durocs, \documentclass[12pt]{minimal} \usepackage{amsmath} \usepackage{wasysym} \usepackage{amsfonts} \usepackage{amssymb} \usepackage{amsbsy} \usepackage{mathrsfs} \usepackage{upgreek} \setlength{\oddsidemargin}{-69pt} \begin{document}$${F}_{ROH(>16Mb)}$$\end{document} had nearly zero correlations with \documentclass[12pt]{minimal} \usepackage{amsmath} \usepackage{wasysym} \usepackage{amsfonts} \usepackage{amssymb} \usepackage{amsbsy} \usepackage{mathrsfs} \usepackage{upgreek} \setlength{\oddsidemargin}{-69pt} \begin{document}$${F}_{ROH(<2Mb)}$$\end{document} , \documentclass[12pt]{minimal} \usepackage{amsmath} \usepackage{wasysym} \usepackage{amsfonts} \usepackage{amssymb} \usepackage{amsbsy} \usepackage{mathrsfs} \usepackage{upgreek} \setlength{\oddsidemargin}{-69pt} \begin{document}$${F}_{ROH(2-4Mb)}$$\end{document} , \documentclass[12pt]{minimal} \usepackage{amsmath} \usepackage{wasysym} \usepackage{amsfonts} \usepackage{amssymb} \usepackage{amsbsy} \usepackage{mathrsfs} \usepackage{upgreek} \setlength{\oddsidemargin}{-69pt} \begin{document}$${F}_{ROH(4-8Mb)}$$\end{document} , and \documentclass[12pt]{minimal} \usepackage{amsmath} \usepackage{wasysym} \usepackage{amsfonts} \usepackage{amssymb} \usepackage{amsbsy} \usepackage{mathrsfs} \usepackage{upgreek} \setlength{\oddsidemargin}{-69pt} \begin{document}$${F}_{ROH(8-16Mb)}$$\end{document} . Conversely, in European and North American Durocs, positive and moderate to high correlations were observed among \documentclass[12pt]{minimal} \usepackage{amsmath} \usepackage{wasysym} \usepackage{amsfonts} \usepackage{amssymb} \usepackage{amsbsy} \usepackage{mathrsfs} \usepackage{upgreek} \setlength{\oddsidemargin}{-69pt} \begin{document}$${F}_{ROH(<2Mb)}$$\end{document} , \documentclass[12pt]{minimal} \usepackage{amsmath} \usepackage{wasysym} \usepackage{amsfonts} \usepackage{amssymb} \usepackage{amsbsy} \usepackage{mathrsfs} \usepackage{upgreek} \setlength{\oddsidemargin}{-69pt} \begin{document}$${F}_{ROH(2-4Mb)}$$\end{document} , \documentclass[12pt]{minimal} \usepackage{amsmath} \usepackage{wasysym} \usepackage{amsfonts} \usepackage{amssymb} \usepackage{amsbsy} \usepackage{mathrsfs} \usepackage{upgreek} \setlength{\oddsidemargin}{-69pt} \begin{document}$${F}_{ROH(4-8Mb)}$$\end{document} , \documentclass[12pt]{minimal} \usepackage{amsmath} \usepackage{wasysym} \usepackage{amsfonts} \usepackage{amssymb} \usepackage{amsbsy} \usepackage{mathrsfs} \usepackage{upgreek} \setlength{\oddsidemargin}{-69pt} \begin{document}$${F}_{ROH(8-16Mb)},$$\end{document} and \documentclass[12pt]{minimal} \usepackage{amsmath} \usepackage{wasysym} \usepackage{amsfonts} \usepackage{amssymb} \usepackage{amsbsy} \usepackage{mathrsfs} \usepackage{upgreek} \setlength{\oddsidemargin}{-69pt} \begin{document}$${F}_{ROH(>16Mb)}$$\end{document} .Fig. 7. Pearson’s correlation coefficients for pairs of genomic inbreeding coefficients for the five subgroups of pigs. a) European and North American Durocs; b) Australian Durocs; c) OBP1; d) OBP2; e) Asian-Pacific Pigs
Runs of homozygosity
Table 3 summarizes the average length and range of ROH, as well as descriptive statistics of the five classes of ROH for each population. Across all populations, we identified 140,713 ROHs, with Durocs (98,039) contributing more than twice as many as OBPs (42,674). The number of ROHs varied significantly, with Duroc3 exhibiting the highest count (n = 15,648) and the Spotted population the lowest count (n = 754). The most common ROHs were 2–4 Mb in length for both Durocs (40.0%) and OBPs (34.5%), while long ROHs (> 16 Mb) were the least frequent (3.5% and 5.5%, respectively). The average ROH length was slightly greater in Durocs (5.178 ± 5.388 Mb) than in OBPs (4.975 ± 6.795 Mb).Table 3. Average length and range of runs of homozygosity (ROH) and descriptive statistics of the five classes of ROHs for each pig populationGroupBreedAverage Length (Mb)CategoryMean (SD)Range < 2 Mb2-4 Mb4-8 Mb8-16 Mb > 16 MbDurocDuroc14.537(3.622)0.504–43.1145171565100633659Duroc24.947(6.092)0.502–110.3653046315819321021491Duroc35.671(6.434)0.503–115.9653662496538842152985Duroc46.077(6.546)0.505–101.345843535737681586750Duroc54.498(4.136)0.506–48.411193729562218840172Duroc65.525(5.787)0.522–80.4961688452328051508534Duroc74.026(2.805)0.565–26.16311892869176444250Duroc85.638(5.154)0.547–58.69945511811029457167Duroc9 (White Duroc)5.244(4.387)0.530–44.3024341396102047597Duroc104.944(4.394)0.506–76.63957116871160384130Duroc114.874(4.719)0.512–70.464121623841532724177Duroc124.183(2.820)0.520–28.0346571670121333320Duroc135.136(5.072)0.512–69.2191836458927041330433Other breedsBerkshire4.939(6.698)0.545–93.63315891702959452252Chester White4.804(6.214)0.515–80.09162169234817996Fengjing4.719(7.336)0.632–95.06361881334013399Hampshire4.696(5.853)0.514–78.189151517241048428213Hawaiian4.348(5.116)0.608–73.52811041154660263125Hereford5.361(6.883)0.502–72.028696754479260146Landrace4.032(4.731)0.502–68.23884287346519254Large Black5.664(7.735)0.501–102.4902552741689361Meishan5.934(8.568)0.515–129.485169018421289594450Minzhu5.570(9.871)0.537–107.0292913221476557Spotted5.405(7.698)0.640–81.7272332561486849Tamworth5.990(8.147)0.611–90.92331337621114986Yorkshire4.768(6.282)0.567–115.4933835371321341062555
A key finding emerged from the geographic structuring of Durocs (Fig. 8b). The European and North American Durocs exhibited two different patterns: one group clustered near the coordinate origin and included Duroc1, Duroc5, Duroc7, and Duroc9, each carrying 1 to 80 ROH spanning 20 to 600 Mb (Fig. 8b). The other group clustered on the right-hand side, with each individual carrying 80 to 150 ROH and a total length of 500 to 1,100 Mb (Fig. 8b). Notably, the majority of Duroc3 animals had more than 120 ROH segments, covering over 800 Mb of their autosomes (nearly one-third of their genome covered by SNPs). However, it is important to emphasize that the number of SNPs available for the ROH analyses was relatively small, which can influence the length of the ROH segments, and therefore, the proportion of the genome covered by ROH segments.Fig. 8. Illustration of the total number versus length of runs of homozygosity (ROH) segments of each individual of pigs. a) selected pig breeds; b) Duroc sub-populations
ROH islands
Identification of shared ROH regions between populations can provide valuable insights into their genetic history and selection pressures. European and North American Duroc, Australian Duroc, Asian-Pacific, OBP1, and OBP2 pigs had 4, 4, 12, 10, and 7 shared ROH islands, respectively, which were located on different chromosomes (SSC1, SSC2, SSC6, SSC7, SSC8, and SSC14). A total of 43, 18, 27, 37, and 20 genes that overlapped these regions were identified for European and North American Duroc, Australian Duroc, Asian-Pacific, OBP1, and OBP2 pigs, respectively (see Additional file 4, Table S2).
Based on the candidate genes identified, 9, 14, and 2 KEGG pathways were significantly enriched for Australian Duroc, Asian-Pacific, and OBP1 pigs, respectively (Table 4). No significant KEGG pathway was enriched for European and North American Duroc and OBP2 pigs. Enriched KEGG pathways in Australian Durocs were mainly associated with growth and tissue development, protein synthesis, and immune responses. In Asian-Pacific pigs, they were primarily linked to detoxification, environmental adaptation, and nutrient and hormone metabolism. In OBP2 pigs, enriched pathways related to reproductive system stability and long-term physiological robustness.Table 4. Significantly enriched (P < 0.05) Kyoto Encyclopedia of Genes and Genomes (KEGG) pathways identified for the five subgroupsGroupCategoryIDDescriptionP-valueAustralian DurocEnvironmental Information Processingssc04392Hippo signaling pathway - multiple species0.009Genetic Information Processingssc03008Ribosome biogenesis in eukaryotes0.025Cellular Processesssc04520Adherens junction0.03Organismal Systemsssc04670Leukocyte transendothelial migration0.037Environmental Information Processingssc04390Hippo signaling pathway0.05Cellular Processesssc04530Tight junction0.053Environmental Information Processingssc04015Rap1 signaling pathway0.068Environmental Information Processingssc04024cAMP signaling pathway0.072Environmental Information Processingssc04014Ras signaling pathway0.075Asian-Pacific pigsOrganismal Systemsssc04976Bile secretion<0.001Metabolismssc00053Ascorbate and aldarate metabolism<0.001Metabolismssc00040Pentose and glucuronate interconversions<0.001Metabolismssc00860Porphyrin metabolism0.001Metabolismssc00982Drug metabolism - cytochrome P4500.001Metabolismssc00980Metabolism of xenobiotics by cytochrome P4500.002Human Diseasesssc05204Chemical carcinogenesis - DNA adducts0.002Metabolismssc00140Steroid hormone biosynthesis0.002Metabolismssc00983Drug metabolism - other enzymes0.002Metabolismssc00830Retinol metabolism0.002Metabolismssc01240Biosynthesis of cofactors0.01Human Diseasesssc05207Chemical carcinogenesis - receptor activation0.019Organismal Systemsssc04964Proximal tubule bicarbonate reclamation0.024Environmental Information Processingssc04392Hippo signaling pathway - multiple species0.03OBP1Human Diseasesssc05213Endometrial cancer0.001Organismal Systemsssc04211Longevity regulating pathway0.003
A total of 16, 24, 4, and 8 GO terms were significantly enriched for European and North American Duroc, Australian Duroc, OBP1, and OBP2 pigs, respectively (Table 5). No GO terms were enriched for Asian-Pacific pigs.Table 5. Significantly enriched (P < 0.05) gene ontology (GO) terms identified for the breed groupsGroupONTOLOGYID****DescriptionP**-value**North American / European DurocBPGO:0051321meiotic cell cycle<0.001BPGO:1902532negative regulation of intracellular signal transduction<0.001BPGO:0051445regulation of meiotic cell cycle<0.001BPGO:0051726regulation of cell cycle<0.001BPGO:0035329hippo signaling<0.001BPGO:2000241regulation of reproductive process0.001BPGO:1903046meiotic cell cycle process0.001BPGO:0051446positive regulation of meiotic cell cycle0.001BPGO:0007260tyrosine phosphorylation of STAT protein0.001BPGO:0040020regulation of meiotic nuclear division0.001BPGO:0042509regulation of tyrosine phosphorylation of STAT protein0.001BPGO:0009968negative regulation of signal transduction0.001BPGO:0014013regulation of gliogenesis0.001BPGO:0010564regulation of cell cycle process0.001BPGO:0010648negative regulation of cell communication0.001BPGO:0023057negative regulation of signaling0.001Australian DurocBPGO:0032735positive regulation of interleukin-12 production0.003BPGO:0050918positive chemotaxis0.003BPGO:0032615interleukin-12 production0.004BPGO:0032655regulation of interleukin-12 production0.004BPGO:0032732positive regulation of interleukin-1 production0.005BPGO:0032612interleukin-1 production0.008BPGO:0032652regulation of interleukin-1 production0.008BPGO:0032755positive regulation of interleukin-6 production0.009BPGO:0030301cholesterol transport0.009BPGO:0015918sterol transport0.010BPGO:0050729positive regulation of inflammatory response0.011BPGO:0050921positive regulation of chemotaxis0.011BPGO:0032635interleukin-6 production0.014BPGO:0032675regulation of interleukin-6 production0.014BPGO:0051924regulation of calcium ion transport0.015BPGO:0050920regulation of chemotaxis0.017MFGO:0120015sterol transfer activity0.003MFGO:0120020cholesterol transfer activity0.003MFGO:0015485cholesterol binding0.006MFGO:0120013lipid transfer activity0.007MFGO:0032934sterol binding0.009MFGO:0043178alcohol binding0.009MFGO:0005496steroid binding0.014MFGO:0005319lipid transporter activity0.016OBP1MFGO:0004659prenyltransferase activity0.008MFGO:0008320protein transmembrane transporter activity0.008MFGO:0140318protein transporter activity0.009MFGO:0022884macromolecule transmembrane transporter activity0.010OBP2MFGO:0003682chromatin binding0.007MFGO:0016702oxidoreductase activity, acting on single donors with incorporation of molecular oxygen, incorporation of two atoms of oxygen0.008MFGO:0141052histone H3 demethylase activity0.008MFGO:0016701oxidoreductase activity, acting on single donors with incorporation of molecular oxygen0.009MFGO:0032452histone demethylase activity0.009MFGO:0140457protein demethylase activity0.009MFGO:0032451demethylase activity0.012MFGO:0017069snRNA binding0.012
FST results
To compare the differences between the Duroc (a terminal sire breed) and Yorkshire pigs (a selected maternal breed), we performed an F_ST_ analysis between these two breeds. For the different Durocs-Yorkshire pairs, genomic regions with the top 1% F_ST_ values were determined as outliers, i.e., the most relevant regions. Like the ROH islands analysis, we also identified shared F_ST_ genomic regions between the European and North American Duroc, Australian Duroc, Asian-Pacific, OBP1, and OBP2 subgroups. Based on the outliers, a total of 13,596 candidate genes were found for the European and North American Duroc– Yorkshire pair of breeds and 17,612 genes for the Australian Duroc—Yorkshire pair, respectively (see Additional file 5, Tables S3 and see Additional file 6, Table S4). Eleven and 36 KEGG pathways were significantly enriched among the identified candidate genes for the European and North American Durocs—Yorkshire pair and the Australian Durocs—Yorkshire pair,, respectively (Table 6). Enriched KEGG pathways for the two pairs were mainly related to immune system functions, disease susceptibility, signal transduction, and metabolism. For the European and North American Durocs—Yorkshire pair, the most significant KEGG pathway was related to nitrogen metabolism. For the Australian Durocs—Yorkshire pair, six disease related pathways (especially cardiovascular disease) were enriched (Table 6). Also, many fatty acid related pathways were enriched, such as cholesterol metabolism, bile secretion, and fatty acid elongation. Five and 18 GO terms were significantly enriched for the European and North American Durocs—Yorkshire and Australian Durocs—Yorkshire pairs, respectively (Table 7). Most of these GO terms were related to cytokine activity and signaling receptor activator activity.Table 6. Significantly enriched (P < 0.05) Kyoto Encyclopedia of Genes and Genomes (KEGG) pathways among genes in shared runs of homozygosity for the European and North American Duroc – Yorkshire pair of breeds and the Australian Duroc – Yorkshire pair of breedsGroupCategorySubcategoryIDDescriptionq-valueNorth American / European DurocMetabolismEnergy metabolismssc00910Nitrogen metabolism0.023Environmental Information ProcessingSignal transductionssc04350TGF-beta signaling pathway0.023ssc04148Efferocytosis0.029Organismal SystemsImmune systemssc04622RIG-I-like receptor signaling pathway0.029Environmental Information ProcessingSignal transductionssc04371Apelin signaling pathway0.03Human DiseasesInfectious disease: viralssc05167Kaposi sarcoma-associated herpesvirus infection0.032Organismal SystemsDigestive systemssc04979Cholesterol metabolism0.032Human DiseasesInfectious disease: viralssc05163Human cytomegalovirus infection0.032Environmental Information ProcessingSignal transductionssc04022cGMP-PKG signaling pathway0.04Human DiseasesInfectious disease: viralssc05165Human papillomavirus infection0.04ssc04820Cytoskeleton in muscle cells0.04MetabolismMetabolism of other amino acidsssc00430Taurine and hypotaurine metabolism0.04Organismal SystemsEndocrine systemssc04925Aldosterone synthesis and secretion0.04Australian DurocHuman DiseasesCardiovascular diseasessc05412Arrhythmogenic right ventricular cardiomyopathy0.001MetabolismMetabolism of other amino acidsssc00430Taurine and hypotaurine metabolism0.001Organismal SystemsDigestive systemssc04976Bile secretion0.001MetabolismXenobiotics biodegradation and metabolismssc00982Drug metabolism—cytochrome P4500.001Human DiseasesCardiovascular diseasessc05410Hypertrophic cardiomyopathy0.001ssc04820Cytoskeleton in muscle cells0.002Human DiseasesCardiovascular diseasessc05414Dilated cardiomyopathy0.003Environmental Information ProcessingSignaling molecules and interactionssc04061Viral protein interaction with cytokine and cytokine receptor0.003Genetic Information ProcessingFolding, sorting and degradationssc04141Protein processing in endoplasmic reticulum0.004Environmental Information ProcessingSignal transductionssc04350TGF-beta signaling pathway0.004Environmental Information ProcessingSignaling molecules and interactionssc04512ECM-receptor interaction0.008Organismal SystemsDevelopment and regenerationssc04360Axon guidance0.008Organismal SystemsCirculatory systemssc04261Adrenergic signaling in cardiomyocytes0.011Organismal SystemsImmune systemssc04062Chemokine signaling pathway0.012MetabolismMetabolism of cofactors and vitaminsssc00830Retinol metabolism0.014Organismal SystemsCirculatory systemssc04260Cardiac muscle contraction0.017-ssc04148Efferocytosis0.024MetabolismLipid metabolismssc00062Fatty acid elongation0.024MetabolismLipid metabolismssc00140Steroid hormone biosynthesis0.024Environmental Information ProcessingSignal transductionssc04151PI3K-Akt signaling pathway0.029Environmental Information ProcessingSignal transductionssc04371Apelin signaling pathway0.030Organismal SystemsEndocrine systemssc04915Estrogen signaling pathway0.030MetabolismXenobiotics biodegradation and metabolismssc00983Drug metabolism—other enzymes0.030Environmental Information ProcessingSignal transductionssc04390Hippo signaling pathway0.030Human DiseasesInfectious disease: bacterialssc05150Staphylococcus aureus infection0.031Human DiseasesInfectious disease: viralssc05167Kaposi sarcoma-associated herpesvirus infection0.037MetabolismCarbohydrate metabolismssc00562Inositol phosphate metabolism0.038Environmental Information ProcessingSignaling molecules and interactionssc04060Cytokine-cytokine receptor interaction0.038MetabolismMetabolism of cofactors and vitaminsssc00770Pantothenate and CoA biosynthesis0.039Organismal SystemsDigestive systemssc04979Cholesterol metabolism0.040Human DiseasesInfectious disease: viralssc05165Human papillomavirus infection0.040MetabolismAmino acid metabolismssc00280Valine, leucine and isoleucine degradation0.040MetabolismCarbohydrate metabolismssc00053Ascorbate and aldarate metabolism0.040Human DiseasesDrug resistance: antineoplasticssc01521EGFR tyrosine kinase inhibitor resistance0.042Organismal SystemsImmune systemssc04622RIG-I-like receptor signaling pathway0.042Environmental Information ProcessingSignal transductionssc04630JAK-STAT signaling pathway0.045Table 7Significantly enriched (P < 0.05) gene ontology (GO) terms among genes in shared runs of homozygosity for the European and North American Duroc-Yorkshire pair of breeds and the Australian Duroc – Yorkshire pair of breedsGroupONTOLOGYIDDescriptionq-valueNorth American / European DurocMFGO:0005125Cytokine activity2.15E-05MFGO:0030546Signaling receptor activator activity0.001MFGO:0048018Receptor ligand activity0.001MFGO:0030545Signaling receptor regulator activity0.002MFGO:0005132Type I interferon receptor binding0.008Australian DurocBPGO:0042330Taxis0.017BPGO:0006935Chemotaxis0.017BPGO:0030030Cell projection organization0.017BPGO:0120036Plasma membrane bounded cell projection organization0.017BPGO:0002323Natural killer cell activation involved in immune response0.023BPGO:0051093Negative regulation of developmental process0.031BPGO:0002286T cell activation involved in immune response0.031BPGO:0051241Negative regulation of multicellular organismal process0.033BPGO:0040011Locomotion0.034BPGO:0060322Head development0.042BPGO:0150063Visual system development0.042MFGO:0005125Cytokine activity0.002MFGO:0008289Lipid binding0.012MFGO:0042379Chemokine receptor binding0.012MFGO:0005132Type I interferon receptor binding0.012MFGO:0005126Cytokine receptor binding0.012MFGO:0030546Signaling receptor activator activity0.022MFGO:0048018Receptor ligand activity0.022
Discussion
The exact origin of the Duroc breed is still unclear. Over generations, Durocs have been exported and imported across countries, leading to variations in their genetic background due to differences in founder populations, selection strategies, and (cross)breeding programs. This is the first genetic diversity and population structure study focusing on a broad assessment of Duroc pigs, representing various North American, European, and Australian corporate breeding programs and traditional purebred breeding entities. As with other species, selective breeding to improve relevant traits has resulted in reduced genetic diversity [35, 36]. Studies on genetic diversity and population structure are essential to design long-term sustainable breeding programs. Several additional commercial pig breeds were also included in this study to better contextualize the Duroc genetic diversity and population structure, including Berkshire, Chester White, Fengjing, Meishan, and Large Black, originating from Asia, Europe, and the Pacific islands.
The greater than expected Ho for Fengjing pigs and the greater than expected He in Hawaiian pigs indicate that there is sufficient genetic variation in Fengjing pigs and greater inbreeding in Hawaiian pigs [37, 38]. The relatively low H_O_ and H_E_ estimates for Asian-Pacific pigs (Meishan, Fengjing, and Hawaiian pigs) were not unexpected. Previous study has indicated that Chinese domestic pigs often show higher He and genetic diversity than European pigs [39]. However, low values have also been reported in previous studies. For instance, Faria et al. [38] reported that Meishan pigs had the lowest He and Ho and other Asian pigs (Fengjing, Minzhu, Hawaii island) had relatively low He (0.339 to 0.353) and Ho (0.322 to 0.374) [38]. Ai et al. [40] and Wang et al. [41] both reported that European and composite breeds had greater H_O_ than most Chinese indigenous breeds. These results may be attributed to ascertainment bias in the genotyping arrays, as the most commonly used SNP panels were designed based on European and North American pig breeds [42]. Furthermore, the small sample sizes used for the studies and the sampling strategies may have under-represented the true genetic variability of Chinese indigenous pigs.
The PCA (Fig. 2) and phylogenetic tree (Fig. 3) analyses provided a high-resolution view of the Duroc breed’s complex history and revealed five distinct subgroups. These results offer strong genomic support for the foundation of the Australian Duroc population from North American Durocs, as these groups clustered closely, reflecting historical germplasm exchanges. Beyond this recent history, our data also revealed a deeper ancestral connection to the OBP1 cluster (comprising Hereford and Tamworth), consistent with the historic use of Duroc sires in development of the Hereford breed. A clear example of these connections is the specific genetic similarity observed among the North American White Duroc (Duroc9), the Australian Duroc, and the OBP1 cluster. The close relationship between the White Duroc and Australian Duroc may be due to the fact that both lines stem from a common North American gene pool from the mid-to-late twentieth century, with their divergence resulting from direct importation versus selective outcrossing. There may also have been introgression of maternal lines (white breeds) into the Australian Durocs over time, which could explain their similarity with the Duroc9 population. The observed similarity with the OBP1 cluster can be explained by its constituent breeds, with the link to Hereford being attributable to its known foundational Duroc ancestry [43], while the connection to Tamworth, for which there is no documented Duroc origin, may reflect shared North American ancestry or unrecorded historic gene flow. By contrast, Asian-Pacific pigs were more distinct, indicating their potentially independent domestication paths and considerable genetic divergence from both the Duroc populations and other commercial breeds.
In phylogenetic tree results, the distinct separation of White Duroc (Duroc9) reflects its composite origin based on Durocs and white pig breeds (e.g., Yorkshire or Landrace), both commonly used in commercial breeding for their desirable traits. The subdivision of Duroc7 suggests that pigs from Duroc7 may be a recent combination of different sub-lines, while the split in Duroc2 may reflect different breeding goals such as their use in the show ring segment of the industry or productivity improvement. There were also significant importations and extensive exchanges of genetic material between North America and Europe (especially Denmark), which is known to have happened with Duroc3 and a proportion of Duroc7, which may explain their closer genetic relationship. The cluster of Duroc4, Duroc5, and Duroc6 was expected, as these three populations are from Canada and may share founder animals.
The admixture analysis showed different ancestry among the Duroc populations. The distinct pattern of Duroc7 and Duroc3 at K = 2 indicates that these two subpopulations may have differed from others due to their selection strategies and potential migration events. The European and North American and Australian Durocs split at K = 3 (except for Duroc3, Duroc7, and Duroc9) implying breeding and selection strategy differences over time. The similarity among Duroc6 through Duroc13 at K = 4 indicates that these corporate lines have not become substantially differentiated over time. Interestingly, these populations are all similar to the Duroc3 group, which includes boars from the NAGP, suggesting the collection has broadly captured the Duroc’s genetic diversity.
More K values were used to test the ancestry among Durocs and other breeds. At lower K values (e.g., K = 2 and K = 4), European and North American Durocs, Australian Durocs, OBP1, and OBP2 exhibited strong similarity, showing that they share a common ancestor with few differences having emerged over time. Australian Durocs and Duroc9 (White Duroc) were more similar compared to the rest of the European and North American Durocs. This could reflect shared ancestry or potential introgression events. Additionally, Asian-Pacific pigs have a more distinct genetic background, influenced by both Chinese indigenous pigs and European pigs. The distinct separation of Duroc subpopulations highlights the need for an industry-driven strategy to conserve the breed's genetic variability. While genetic drift within populations can reduce variation, combining these populations offers a valuable opportunity to restore and enhance genetic diversity in the entire Duroc breed.
Estimates of average \documentclass[12pt]{minimal} \usepackage{amsmath} \usepackage{wasysym} \usepackage{amsfonts} \usepackage{amssymb} \usepackage{amsbsy} \usepackage{mathrsfs} \usepackage{upgreek} \setlength{\oddsidemargin}{-69pt} \begin{document}$${r}^{2}$$\end{document} (0.41) for markers with pairwise distance below 100 kb were similar to previous studies ( \documentclass[12pt]{minimal} \usepackage{amsmath} \usepackage{wasysym} \usepackage{amsfonts} \usepackage{amssymb} \usepackage{amsbsy} \usepackage{mathrsfs} \usepackage{upgreek} \setlength{\oddsidemargin}{-69pt} \begin{document}$${r}^{2}$$\end{document} = 0.42) in Durocs [44]. However, differences exist between Duroc subpopulations. Compared to American Durocs, Canadian Durocs (Duroc4, Duroc5, and Duroc6) had relatively higher LD levels, which was also observed by Wang et al. [8]. Lower LD levels were observed in Australian Durocs and Asian-Pacific pigs, such as Hawaiian, Minzhu, Meishan, and Fengjing, implying that they did not lose as much genetic diversity over time as compared to European and North American Durocs. However, this low level of LD may require the use of higher-density SNP panels and larger reference populations for genomic selection and genome-wide association study (GWAS) purposes. In addition, LD decayed faster with distance in the OBP than in the Duroc populations. The different marker distances to reach background LD levels in Durocs (500 kb) and OBPs (300 kb) suggest that Durocs may have experienced more inbreeding over time. This observation aligns with the development of the Duroc breed, which has been intensively used as a terminal sire breed in crossbreeding programs.
D'Augustin et al. [45] used pedigree information of Durocs from multiple herds that were part of the across-herd genetic evaluations of the National Pig Improvement Program in Australia, and estimated Ne to range from 42 to 61 over time, similar to our results. Welsh et al. [46] estimated Ne using pedigree information for Berkshire (Ne = 77.3), Duroc (Ne = 113.1), Hampshire (Ne = 109.2), Landrace (Ne = 74.2), and Yorkshire (Ne = 112.9), which were more similar to our Ne result for the whole Duroc population (Ne = 172). The Ne for the entire Duroc population was greater than that of each Duroc subpopulation, which was as expected as the subpopulations may have diverged over time due to selection, migration (e.g., introgression of other breeds in the subpopulations), and random drift. Faria et al. [38] also observed similar Ne of around 100 for different pig breeds, such as Berkshire, Chester White, and Duroc,. The estimated Ne value at 25 generations ago observed in the Złotnicka White (~ 65) and Złotnicka Spotted (~ 50) pig breeds is more similar to the values observed in our study [47]. Estimates of Ne are largely affected by the methods used, even for the same population. For example, Ne estimates for U.S. Polypay sheep (i.e., single population) ranged from 41 based on the increase in inbreeding by complete generation to 249 based on the increase in inbreeding by maximum generation [48]. Our estimates of Ne were not high for any of the (sub)populations, indicating that caution should be taken to avoid inbreeding and enable long-term genetic progress in pig populations. There may be value in exchanging sires across corporate lines to increase genetic variability within subpopulations and avoid inbreeding.
The low Ne is probably driven by selection and the number of founders used to establish closed populations (e.g., corporate lines). This then leads to increased LD and subsequent fixation of some LD blocks [49]. Khathar et al. [50] mentioned that a sample size of 75 individuals is enough for LD estimation based on the \documentclass[12pt]{minimal} \usepackage{amsmath} \usepackage{wasysym} \usepackage{amsfonts} \usepackage{amssymb} \usepackage{amsbsy} \usepackage{mathrsfs} \usepackage{upgreek} \setlength{\oddsidemargin}{-69pt} \begin{document}$${r}^{2}$$\end{document} metric. The small sample size used for the analyses in some of our populations may have led to overestimated LD and underestimated Ne. The number of SNPs after QC can also affect the accuracy of the LD and Ne estimates. In addition, for the corporate lines animals were sampled from the last two generations, while there could have been greater variability in the other populations.
Assessing the loss of genetic variability over time is crucial for maintaining effective breeding programs. \documentclass[12pt]{minimal} \usepackage{amsmath} \usepackage{wasysym} \usepackage{amsfonts} \usepackage{amssymb} \usepackage{amsbsy} \usepackage{mathrsfs} \usepackage{upgreek} \setlength{\oddsidemargin}{-69pt} \begin{document}$${F}_{HOM}$$\end{document} was negative for most populations, which may have been due to the small sample sizes used for the analyses, the reduced number of SNPs after QC, and potential ascertainment bias of SNP panels. Random sampling errors may have also contributed to the negative values observed. Mulim et al. [51] observed similar correlation patterns among inbreeding metrics in cattle populations, i.e. high correlations between \documentclass[12pt]{minimal} \usepackage{amsmath} \usepackage{wasysym} \usepackage{amsfonts} \usepackage{amssymb} \usepackage{amsbsy} \usepackage{mathrsfs} \usepackage{upgreek} \setlength{\oddsidemargin}{-69pt} \begin{document}$${F}_{HOM1}$$\end{document} and \documentclass[12pt]{minimal} \usepackage{amsmath} \usepackage{wasysym} \usepackage{amsfonts} \usepackage{amssymb} \usepackage{amsbsy} \usepackage{mathrsfs} \usepackage{upgreek} \setlength{\oddsidemargin}{-69pt} \begin{document}$${F}_{UNI}$$\end{document} , \documentclass[12pt]{minimal} \usepackage{amsmath} \usepackage{wasysym} \usepackage{amsfonts} \usepackage{amssymb} \usepackage{amsbsy} \usepackage{mathrsfs} \usepackage{upgreek} \setlength{\oddsidemargin}{-69pt} \begin{document}$${F}_{HOM1}$$\end{document} and \documentclass[12pt]{minimal} \usepackage{amsmath} \usepackage{wasysym} \usepackage{amsfonts} \usepackage{amssymb} \usepackage{amsbsy} \usepackage{mathrsfs} \usepackage{upgreek} \setlength{\oddsidemargin}{-69pt} \begin{document}$${F}_{HOM2}$$\end{document} , and \documentclass[12pt]{minimal} \usepackage{amsmath} \usepackage{wasysym} \usepackage{amsfonts} \usepackage{amssymb} \usepackage{amsbsy} \usepackage{mathrsfs} \usepackage{upgreek} \setlength{\oddsidemargin}{-69pt} \begin{document}$${F}_{GRM}$$\end{document} and \documentclass[12pt]{minimal} \usepackage{amsmath} \usepackage{wasysym} \usepackage{amsfonts} \usepackage{amssymb} \usepackage{amsbsy} \usepackage{mathrsfs} \usepackage{upgreek} \setlength{\oddsidemargin}{-69pt} \begin{document}$${F}_{UNI}$$\end{document} . The \documentclass[12pt]{minimal} \usepackage{amsmath} \usepackage{wasysym} \usepackage{amsfonts} \usepackage{amssymb} \usepackage{amsbsy} \usepackage{mathrsfs} \usepackage{upgreek} \setlength{\oddsidemargin}{-69pt} \begin{document}$${F}_{ROH}$$\end{document} values were the highest among all the inbreeding coefficients and this was also observed previously, including for Duroc [8, 52], Berkshire, Landrace, and Piétrain [53]. \documentclass[12pt]{minimal} \usepackage{amsmath} \usepackage{wasysym} \usepackage{amsfonts} \usepackage{amssymb} \usepackage{amsbsy} \usepackage{mathrsfs} \usepackage{upgreek} \setlength{\oddsidemargin}{-69pt} \begin{document}$${F}_{ROH(8-16Mb)}$$\end{document} and \documentclass[12pt]{minimal} \usepackage{amsmath} \usepackage{wasysym} \usepackage{amsfonts} \usepackage{amssymb} \usepackage{amsbsy} \usepackage{mathrsfs} \usepackage{upgreek} \setlength{\oddsidemargin}{-69pt} \begin{document}$${F}_{ROH(>16Mb)}$$\end{document} both made a major contribution to \documentclass[12pt]{minimal} \usepackage{amsmath} \usepackage{wasysym} \usepackage{amsfonts} \usepackage{amssymb} \usepackage{amsbsy} \usepackage{mathrsfs} \usepackage{upgreek} \setlength{\oddsidemargin}{-69pt} \begin{document}$${F}_{ROH}$$\end{document} of Duroc populations, revealing the more recent inbreeding and increase in homozygosity, which may be related to the implementation of genomic selection in the past two decades. However, it is worth noting that genomic information can be used for more accurate mating designs and, therefore, minimizing the rate of inbreeding. Correlations between \documentclass[12pt]{minimal} \usepackage{amsmath} \usepackage{wasysym} \usepackage{amsfonts} \usepackage{amssymb} \usepackage{amsbsy} \usepackage{mathrsfs} \usepackage{upgreek} \setlength{\oddsidemargin}{-69pt} \begin{document}$${F}_{ROH}$$\end{document} and \documentclass[12pt]{minimal} \usepackage{amsmath} \usepackage{wasysym} \usepackage{amsfonts} \usepackage{amssymb} \usepackage{amsbsy} \usepackage{mathrsfs} \usepackage{upgreek} \setlength{\oddsidemargin}{-69pt} \begin{document}$${F}_{ROH(<2Mb)}$$\end{document} were low to moderate in Australian Durocs (0.41), OBP1 (0.18), OBP2 (0.46), and Asian-Pacific populations (0.49). \documentclass[12pt]{minimal} \usepackage{amsmath} \usepackage{wasysym} \usepackage{amsfonts} \usepackage{amssymb} \usepackage{amsbsy} \usepackage{mathrsfs} \usepackage{upgreek} \setlength{\oddsidemargin}{-69pt} \begin{document}$${F}_{ROH}$$\end{document} can uncover the approximate age of inbreeding based on the length of ROH and have the advantage of not being affected by estimates of allele frequencies, unlike other measures ( \documentclass[12pt]{minimal} \usepackage{amsmath} \usepackage{wasysym} \usepackage{amsfonts} \usepackage{amssymb} \usepackage{amsbsy} \usepackage{mathrsfs} \usepackage{upgreek} \setlength{\oddsidemargin}{-69pt} \begin{document}$${F}_{HOM1}$$\end{document} , \documentclass[12pt]{minimal} \usepackage{amsmath} \usepackage{wasysym} \usepackage{amsfonts} \usepackage{amssymb} \usepackage{amsbsy} \usepackage{mathrsfs} \usepackage{upgreek} \setlength{\oddsidemargin}{-69pt} \begin{document}$${F}_{UNI}$$\end{document} , \documentclass[12pt]{minimal} \usepackage{amsmath} \usepackage{wasysym} \usepackage{amsfonts} \usepackage{amssymb} \usepackage{amsbsy} \usepackage{mathrsfs} \usepackage{upgreek} \setlength{\oddsidemargin}{-69pt} \begin{document}$${F}_{HOM2}$$\end{document} ) [54]. As a breed with intense selection over many generations and controlled matings, the relatively low inbreeding levels of Durocs (average \documentclass[12pt]{minimal} \usepackage{amsmath} \usepackage{wasysym} \usepackage{amsfonts} \usepackage{amssymb} \usepackage{amsbsy} \usepackage{mathrsfs} \usepackage{upgreek} \setlength{\oddsidemargin}{-69pt} \begin{document}$${F}_{ROH}$$\end{document} for all Duroc subpopulations = 0.198) were as expected. However, differences in \documentclass[12pt]{minimal} \usepackage{amsmath} \usepackage{wasysym} \usepackage{amsfonts} \usepackage{amssymb} \usepackage{amsbsy} \usepackage{mathrsfs} \usepackage{upgreek} \setlength{\oddsidemargin}{-69pt} \begin{document}$${F}_{ROH}$$\end{document} values still exist among Duroc populations, with many (i.e., Duroc7, Duroc8, and Duroc9) showing relatively low genomic inbreeding levels, possibly due to differences in breeding program designs. ROH detection can also be affected by the marker density used [54], which may partially explain the lowest \documentclass[12pt]{minimal} \usepackage{amsmath} \usepackage{wasysym} \usepackage{amsfonts} \usepackage{amssymb} \usepackage{amsbsy} \usepackage{mathrsfs} \usepackage{upgreek} \setlength{\oddsidemargin}{-69pt} \begin{document}$${F}_{ROH}$$\end{document} value in the Duroc7 population, which had the smallest number of SNPs after QC. Shorter ROHs significantly contributed to \documentclass[12pt]{minimal} \usepackage{amsmath} \usepackage{wasysym} \usepackage{amsfonts} \usepackage{amssymb} \usepackage{amsbsy} \usepackage{mathrsfs} \usepackage{upgreek} \setlength{\oddsidemargin}{-69pt} \begin{document}$${F}_{ROH}$$\end{document} of all the studied populations, especially of the non-Duroc populations. Future studies on these populations with larger density SNP panels or whole-genome sequence data would be valuable to validate these results.
The ROH number, length, and distribution can provide information on the levels of population size reduction, inbreeding events, demography history, and natural or artificial selection [55]. Significant variation in recent inbreeding was observed within the Duroc breed. In particular the Duroc2, Duroc3, Duroc4, and Duroc6 populations stood out, each showing a very high number and proportion of individuals with long ROHs (> 8 Mb). In addition, maximum ROH lengths exceeded 100 Mb in the Duroc2, Duroc3, and Duroc4 populations, strongly indicating that these subpopulations are undergoing more intensive selection and mating of closely related individuals compared to most OBP subpopulations. When averaged across all subpopulations, the mean proportion of long ROHs (> 8 Mb) was similar in Duroc and OBP populations, indicating comparable levels of recent inbreeding but likely forvery different reasons. In Durocs, high levels of long ROHs are the direct results of deliberate, intensive selection and line-breeding, aimed at maximizing genetic gain. In contrast, for OBPs, this pattern is more likely an unavoidable outcome of their demographic reality, including critically small population sizes and closed-herd conservation strategies that lead to mating among related individuals. This high level of recent inbreeding poses a significant threat to the long-term viability of these breeds, elevating the risk of inbreeding depression and genetic diversity reduction.
Among all subpopulations, Duroc3 had the greatest total number of ROHs (n = 15,648), far exceeding that of other Duroc lines and OBP breeds. In contrast, breeds like Yorkshire also had high ROH counts (11,299 segments), but all OBPs were dominated by short segments (< 2 Mb) compared to Durocs, pointing to sustained genetic drift in a large but historically bottlenecked population rather than to very recent inbreeding. Conversely, Duroc subpopulations had a higher proportion of individuals carrying ROHs between 2 to 4 Mb, potentially reflecting targeted line-breeding without reaching critical inbreeding thresholds.
While Ceballos et al. [55] showed that populations with smaller Ne tend to have more ROH, our results revealed notable exceptions. For example, the Duroc4 line (Ne = 33) showed the highest ROH count, whereas Duroc12 (Ne = 28) displayed the lowest ROH frequency. Although sample size and sampling strategy (for genotyping) can influence ROH detection, these findings clearly suggest that additional factors beyond long-term Ne significantly influence ROH patterns in commercial pig lines.
While the number of very long ROHs (> 16 Mb) in Duroc3 (n = 87) was notably lower than in some subpopulations like Duroc4 (n = 534) or Meishan (n = 295), its exceptionally high counts of shorter and medium-length ROH segments were remarkable. Most individuals in the Duroc3 subpopulation exhibited a total ROH length exceeding 800 Mb and a total ROH count above 120, as shown in Fig. 8b. This is supported by the highest \documentclass[12pt]{minimal} \usepackage{amsmath} \usepackage{wasysym} \usepackage{amsfonts} \usepackage{amssymb} \usepackage{amsbsy} \usepackage{mathrsfs} \usepackage{upgreek} \setlength{\oddsidemargin}{-69pt} \begin{document}$${F}_{ROH}$$\end{document} value in the Duroc3 subpopulation. These findings point to a need for more effective inbreeding management strategies within the Duroc3 subpopulation. This also indicates an ancient reduction in genetic diversity and loss of homozygosity in the Duroc subpopulations. Pemberton et al. [56] reported that, recent strong directional selection may have a greater impact on long ROH than on medium and small ROH.
The origins of ROH islands are still debated, but they seem to result from extended haplotypes segregating at high frequencies within these regions in the population [55]. A ROH island typically forms when an allele increases in frequency due to selection for certain traits and the genomic regions that overlap with these ROH island regions tend to have low recombination rates [55]. In European and North American Durocs, UQCR10 encodes a component of mitochondrial complex III, a critical element of the inner mitochondrial membrane’s electron transport chain. This gene has been previously reported to be related to intramuscular fat accumulation [57, 58] and feed efficiency [59] in pigs. The VDAC1 gene mediates mitochondrial ATP/ADP exchange, influencing sperm motility, survival rate, fertilization, and embryo development [60–62]. Its fixation in a homozygous region likely reflects selection for improved semen quality. This underscores fertility as a critical economic trait targeted in modern boar breeding [9]. The ADAMTSL3 gene was identified in ROH islands of both European and North American and Australian Durocs and has been identified as a strong selection signature in swine [63, 64]. It has also been associated with feed intake [65] in pigs and is considered an important candidate gene for body length [64, 66].
Twenty-three genes overlapped with ROH islands on SSC8 for Asian-Pacific pigs. These genes are associated with important functions such as lactation (CSN2, CSN3 [67, 68]) and growth (MOB1B [69]). We also identified genes indicative of adaptive selection, such as the Vitamin D binding protein gene GC [70], which may aid in calcium utilization with high-fiber diets [71], and TMPRSS11D, which has been linked to susceptibility to influenza [72]. These genes suggest strong adaptive selection for physiological robustness and disease resistance in their local environments.
Many genes on different chromosomes (SSC1, SSC2, and SSC14) were identified for ROH islands that were shared by OBP1 pigs, and many of these were previously related to growth (ARMC2, AFG1L, NR2E1) [73–75], longevity (FOXO3) [76], and cellular stress-response (SESN1) [77]. In OBP2 pigs, JMJD1C has been shown to regulate de novo lipogenesis [83] and is essential for the long-term maintenance of germ cells in mice [78], while SNRPA1 has been linked to overall fitness and reproductive traits [79].
These KEGG pathways that were enriched within the ROH islands of the Australian Duroc population show that selection in this population has focused on growth and meat quality. Hippo, Ras, and Rap1 signaling pathways can regulate muscle cell proliferation [80], cell differentiation [81], and apoptosis [82, 83], leading to enhanced muscle growth. Ras and Rap1 signaling pathways have been found to be enriched in genomic regions associated with feed efficiency in Durocs before [84]. Previous study has shown that ribosome biogenesis appears to be a key process for increasing protein synthesis and cell growth [85].
The KEGG pathways that were enriched in ROH islands of Asian-Pacific pigs highlight strong environmental adaptation through detoxification and lipid metabolism. Enrichment of cytochrome P450 and xenobiotic-metabolism pathways suggests adaptation to plant-based toxins in their local diets [86]. Independently, steroid-hormone biosynthesis and bile-secretion pathways, both of which are derived from cholesterol, were also enriched, indicating that the entire lipid-processing network has been under selection to support efficient fat digestion and storage [87]. Enrichment of retinol metabolism reinforces this lipid-focused adaptation, since fat-soluble nature of vitamin A ties its uptake and storage directly to lipid pathways [88]. The ascorbate and aldarate metabolism pathway, although not a lipid pathway per se, likely contributes antioxidant protection against oxidative stress caused by high-fat diets [89]. Together, these findings align with observations that native Asian breeds (e.g., Bamei, Meishan) have lower growth rates but higher fat deposition than commercial breeds [90–94], illustrating selection for a robust metabolic system capable of both detoxifying diverse feeds and managing high-fat accumulation.
To compare candidate genes under selection between a maternal line (Yorkshire) and a terminal sire line (Duroc), F_ST_ analysis was used to assess population differentiation. This differentiation could result from a combination of natural and artificial selection on different breeding criteria. Four KEGG pathways were identified in both the North American—Yorkshire pair and the Australian Duroc—Yorkshire pair, including the TGF-beta signaling pathway, efferocytosis, Taurine and Hypotaurine metabolism, and Cytoskeleton in muscle cells. The shared pathways in both these population comparisons emphasize common genetic features related to immune function and muscle maintenance, while the differences highlight distinct genetic influences on each population.
ROH islands for European and North American Durocs were enriched for pathways related to immune responses, viral infections, and metabolic processes, indicating adaptations to different pathogens and dietary factors or resilience to viral infections. In contrast, ROH islands for Australian Durocs were enriched for pathways associated with lipid metabolism, cardiac health, stress responses, and drug metabolism, suggesting genetic predispositions to heart conditions and adaptations to environmental stressors and xenobiotics. The lipid metabolism related pathways could positively affect feed intake and weight gain [95, 96]. While Duroc pigs are well-known for their high growth rate, high glycolytic fiber content, and low intramuscular fat content [97], Yorkshire pigs are recognized for their high number of piglets born alive, high proportion of lean meat and low backfat [98].
These results indicate significant differences in genetic diversity, population structure, and ancestry among Duroc subpopulations and between Duroc and other breeds, which can be attributed to genetic drift, potential migration events, and differential selection strategies. Clear genetic differentiation was found among Duroc subpopulations, reflecting differences breeding strategies between selection programs (e.g., selection objectives, selection intensities, initial size of the founder populations). The separation of Duroc subpopulations supports that there is large genetic variability within the breed across the globe if the subpopulations were combined or if other populations were formed by combining animals from all Duroc subpopulations (i.e., migration across subpopulations). This is supported by the Ne estimate for the entire Duroc population (Ne = 172). It indicates that the closed Duroc subpopulations could exchange genetic material to increase genetic variability within their breeding programs, as there is considerable variation across subpopulations. The Food and Agriculture Organization of the United Nations (FAO) has recommended a goal of maintaining the rate of increase in inbreeding below 1% per generation and an Ne greater than 50 [99]. The high LD levels and small Ne values observed in Durocs and other pig populations suggest the need to monitor rates of inbreeding and develop strategies for maintaining genetic diversity levels over time, including the exchange of genetic material across Duroc subpopulations. The enrichment results for shared ROH islands and F_ST_ from pig subgroups provide new insights into how genetic information has been influenced by selection over generations, identifying many immune response, energy, and metabolic pathways in each subgroup.
Conclusions
Durocs represent an interesting model of how global breeds may be composed of an array of subpopulations that harbour genetic variation. Over time, corporate lines have, and we assume continue to, become divergent, although similar selection objectives are likely used. The separation of Duroc subpopulations suggests a de-facto industry-based approach for conserving this breed’s genetic resources. While individual populations are subject to genetic drift (due to selection and chance), there is the opportunity to increase genetic variation by combining subpopulations. The relatively low Ne estimates and high LD levels in subpopulations of Durocs suggest that subpopulation management should be improved to mitigate potential inbreeding depression and related problems. The ROH islands in each subgroup contained many genes associated with reproductive traits, muscular development, fat deposition, and adaptation. Genetic differences and selection signatures were found to exist when comparing Duroc to commercially important breeds like Yorkshire and to small and isolated populations found in Asia and the Pacific region. As a result, the Duroc breed appears to be positioned to continue its contribution to global pork production.
Supplementary Information
Additional file 1 Cross validation error of each K values in the admixture analysis for (a) Duroc pigs and (b) all pigs Additional file 2 Number of runs of homozygosity in pig populations according to the length (a) in Duroc pigs and (b) other selected pigs Additional file 3 Effective population size of each pig population from generation 100 to 25 ago Additional file 4 Identified genes within shared runs of homozygosity islands for each pig group Additional file 5 Significantly enriched (P < 0.05) genes identified for European and North American Durocs - Yorkshire pair in Fst analysis Additional file 6 Significantly enriched (P < 0.05) genes identified for Australian Durocs - Yorkshire pair in Fst analysis
The reference list from the paper itself. Each links out to its DOI / PubMed record.
- 1NSR About Duroc. National Swine Registry. https://nationalswine.com. Accessed 17 Nov 2025.
- 2Wilkinson S, Lu ZH, Megens H-J, Archibald AL, Haley C, Jackson IJ, et al. Signatures of diversifying selection in European pig breeds. Visscher PM, ed. P Lo S Genet. 2013;9:e 100345310.1371/journal.pgen.1003453 PMC 363614223637623 · doi ↗ · pubmed ↗
- 3NSR about Yorkshire. National Swine Registry. https://nationalswine.com. Accessed 8 Jan 2025.
- 4FAO. Secondary Guidelines for Development of National Farm Animal Genetic Resources Management Plans. 1998. https://openknowledge.fao.org/server/api/core/bitstreams/f 90cbd 36-61d 5-47fa-9ee 8-fb 13b 3d 4977 b/content. Accessed 17 Nov 2025.