Electrolyte-Dependent, “Microscopically Irreversible” H‑Atom Transfer Kinetics of Ce-Based Metal–Organic Framework, Ce-MOF-808
Miguel A. Liuzzi-Vaamonde, Zaheer Masood, Bin Wang, Nikolay V. Tkachenko, Hyunho Noh

TL;DR
This paper shows how changing the electrolyte can greatly affect hydrogen atom transfer reactions in a cerium-based metal-organic framework, leading to faster and more efficient redox reactions.
Contribution
The study reveals that electrolyte composition can dramatically alter PCET kinetics in Ce-MOF-808, defying microscopic reversibility expectations.
Findings
Changing the buffer species and proton activity in the electrolyte can alter PCET hopping kinetics by orders of magnitude.
Reductive reactions in Ce-MOF-808 are 3–10 times faster than oxidative reactions under the same electrochemical driving force.
ITC and simulations show that buffer-node binding thermodynamics differ based on buffer chemistry and node oxidation state.
Abstract
Redox reactions at the interface of metal oxides and protic electrolytes almost always involve protons and electrons in equal amounts. Given the stoichiometry, these proton-coupled electron transfer (PCET) reactions are thermochemically equivalent to net H-atom transfer (HAT) reactions. The correlation between the chemical nature of solid catalysts and HAT kinetics has been employed for decades as the design principle for energy-relevant reactions (e.g., reactions of 2H+/H2). More recently, chemists have experimentally determined that a change in liquid electrolytes that alters the microenvironment at the redox-active sites has an equally profound impact on electrocatalysis involving PCET/HAT. Yet, precise correlations between the chemical nature of electrolytes and the PCET kinetics are, to date, rare in the literature. Herein, we report our findings using the Ce-based metal–organic…
Genes, proteins, chemicals, diseases, species, mutations and cell lines named across the full text — each resolved to its canonical identifier and authoritative record.
Click any figure to enlarge with its caption.
 1
1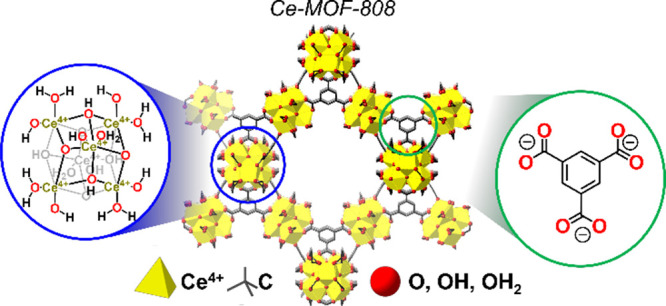 1
1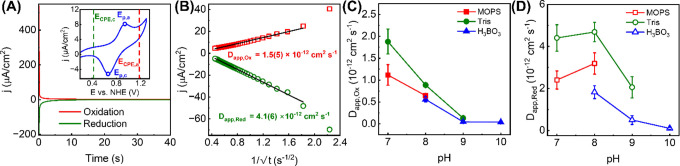 2
2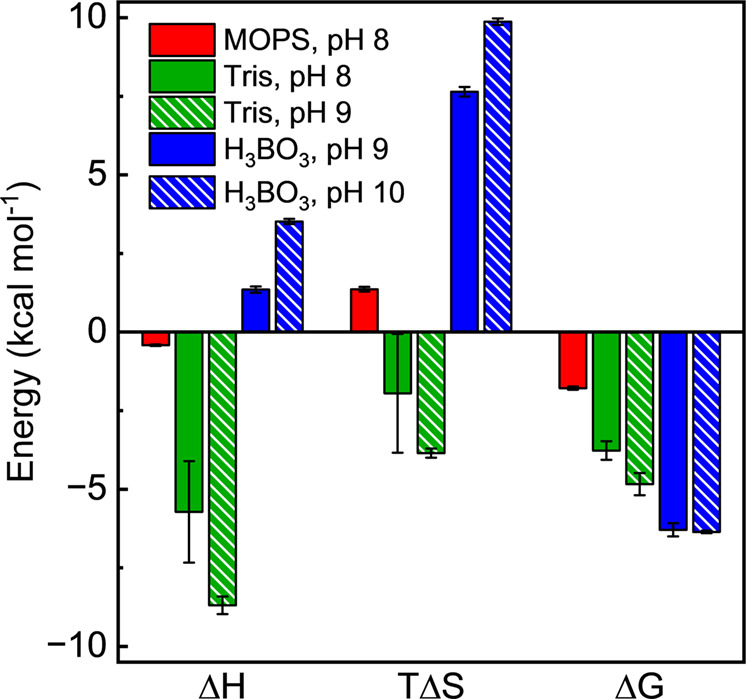 3
3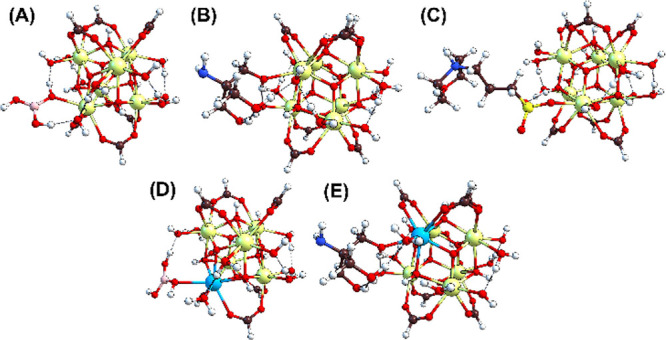 4
4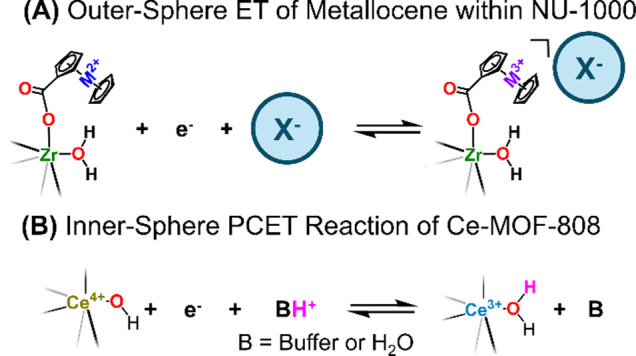 2
2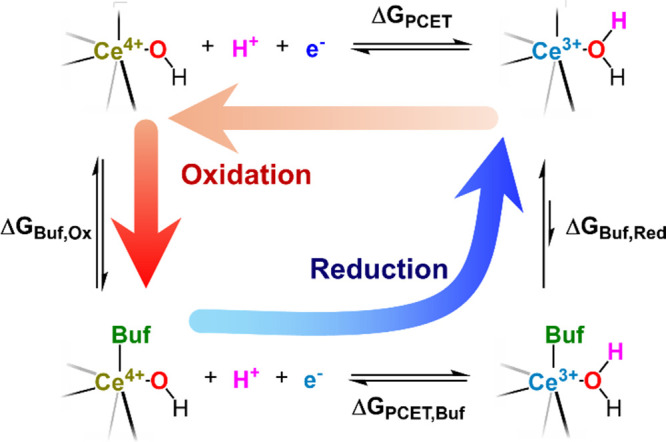 3
3|
|
| |||||
|---|---|---|---|---|---|---|
| pH | MOPS | Tris | H3BO3 | MOPS | Tris | H3BO3 |
| 7 | 1.1(2) | 1.5(2) | 2.4(4) | 3.6(4) | ||
| 8 | 0.64(5) | 0.89(4) | 0.56(6) | 3.2(5) | 4.7(5) | 1.8(3) |
| 9 | 0.13(1) | 0.05(3) | 2.1(5) | 0.5(2) | ||
| 10 | 0.04(2) | 0.10(4) | ||||
|
| ||||||
|---|---|---|---|---|---|---|
| oxidative | reductive | |||||
| pH | MOPS | Tris | H3BO3 | MOPS | Tris | H3BO3 |
| 7 | 0.9(2)/0.19(3) | 1.2(2)/0.25(3) | 2.0(3)/0.40(7) | 2.9(3)/0.61(7) | ||
| 8 | 0.5(4)/0.09(1) | 0.73(3)/0.15(1) | 0.46(5)/0.09(1) | 2.6(4)/0.54(8) | 3.8(4)/0.79(8) | 1.5(2)/0.30(5) |
| 9 | 0.11(1)/0.02(1) | 0.04(2)/0.008(5) | 1.7(4)/0.35(8) | 0.4(2)/0.08(3) | ||
| 10 | 0.03(2)/0.007(3) | 0.08(3)/0.017(7) | ||||
| buffer | pH | Δ |
| Δ |
|---|---|---|---|---|
| MOPS | 8 | –0.4(1) | 1.4(1) | –1.8(1) |
| Tris | 8 | –6(2) | –2(2) | –3.8(3) |
| Tris | 9 | –8.7(3) | –3.8(1) | –4.8(4) |
| H3BO3 | 9 | 1.4(1) | 7.6(2) | –6.3(2) |
| H3BO3 | 10 | 3.5(1) | 9.9(1) | –6.4(1) |
| table entry | buffer | number of added H+/e– | Δ |
|---|---|---|---|
| A | H3BO3 | 0 | –0.29 |
| B | Tris | 0 | –2.11 |
| C | MOPS | 0 | 0.74 |
| D | H3BO3 | 1 | 3.21 |
| E | Tris | 1 | 1.97 |
- —U.S. Department of Energy10.13039/100000015
- —University of Oklahoma10.13039/100007926
Peer Reviews
No public reviews on file for this paper yet. If you reviewed it on a platform where reviews are public (OpenReview, ICLR, NeurIPS, ICML), you can paste yours below so the community can read it here.
Videos
No videos yet. Explain this paper in a talk, walkthrough, or lecture? Add one.
Taxonomy
TopicsMetal-Organic Frameworks: Synthesis and Applications · Metal-Catalyzed Oxygenation Mechanisms · Electrocatalysts for Energy Conversion
Introduction
Hydrogen-atom transfer (HAT) reactions at solid–gas and solid–liquid interfaces lie at the center of reactions relevant to renewable energy and industrial-scale synthesis of commodity chemicals. ?−? ? ? Electrochemically, surface-bound H-atoms are often a product of proton-coupled electron transfer (PCET) reactions with equimolar amounts of protons (H^+^’s) and electrons (e^–^’s); this reaction is called the Volmer reaction (eq). ?,?,? The yielded surface–H bonds essentially serve as a ‘reservoir’ of chemical energy to drive small molecule activations, including but not limited to H_2_ evolution reaction (HER), CO_2_ reduction to chemical fuels, and N_2_ reduction to ammonia (eqs–?). ?,?,?,?
The design of optimal catalysts for small molecule activations, like those shown in eqs–?, commonly stem from an understanding of the Sabatier Principle.? In HER, for example, highly active catalysts must present H-atom binding energy (ΔG°H) that is nearly identical to the free energy necessary to homolytically cleave the H–H bond in H_2_. Thus, plotting ΔG°H of various catalysts against their HER activities result in a volcano-shaped plot, where optimal catalysts like Pt exhibit ΔG°H neither too strong nor too weak.?
While undoubtedly, the Sabatier Principle and the resulting volcano plot have propelled catalyst discovery for decades, there still remains a challenge to apply these concepts to HAT reactions at chemically complex interfaces. ?,? The ΔG°H values are most commonly computed on solid-vacuum interfaces using a single-crystalline, defect-free model. Experimentally, however, these catalysts form surface–H bonds at solid–liquid interfaces, and thus can undergo dynamic interactions with solvents, buffers, ions, and many other components within the electrolyte. ?−? ? ? Even for a single-crystalline Pt(111) surface, for example, there are at least two distinct H-atom binding sites that can present distinct reactivity, particularly in the presence of coordinating anions like phosphate. ?,? Yet, in a typical volcano plot, both the ΔG°H value and the catalytic rate of a given catalyst are often implicitly ascribed to a catalytic motif from crystallographic data, with no liquid in contact. ?,?−? ?
The above complications are further amplified when catalytic motifs exist within porous materials like metal–organic frameworks (MOFs), the focus of this article. MOFs have been extensively employed as catalysts or their support. ?,? In these cases, the pores are as critical as the catalyst itself; within the pores, solvents and other liquid components can be arranged in a fashion distinct from the bulk solution, inducing changes to its physical and chemical properties. ?−? ?
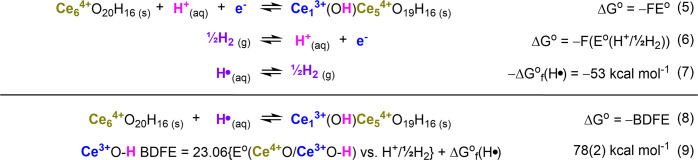
To enhance the quantitative accuracy of the Sabatier Principle, here, we report our findings on the PCET reaction of a Ce-based MOF, Ce-MOF-808 (Figure).? The hexanuclear, Ce_6_(μ_3_–O)4(μ_3_–OH)4(OH)6(H_2_O)6 nodes of this MOF have been shown to be redox active;? furthermore, we have recently demonstrated that this redox reaction involves a Ce^4+/3+^ redox couple and (de)protonation of either the bridging μ_3_–O(H) or the terminal −OH_(2)_ group with a 1:1 proton-to-electron stoichometry.? Because this is a net HAT reaction, we referred to the free energy of this reaction as the Ce^3+^O–H bond dissociation free energy (BDFE).? The average BDFE was experimentally measured to be 78(2) kcal mol^–1^ ?; see eqs 5–9 in Scheme.
Derivation of Ce3+O–H BDFE from Electrochemical Standard Potential (E°) of the Ce4+O/Ce3+OH Redox Reaction
Structures of Ce-MOF-808 and its hexanuclear, Ce-oxo node, and organic linker.
We build on these findings to demonstrate that the kinetics of transferring 1H^+^/1e^–^ within Ce-MOF-808 are highly dependent on the exact chemical nature of the electrolyte, including buffer identity and proton activity. As described below, the difference in PCET kinetics is intimately correlated to the interaction of buffer molecules with the Ce_6_ node of Ce-MOF-808. These findings quantitatively demonstrate that electrolytes have equally important contributions in defining the correlation between thermodynamics and kinetics of PCET reaction. Implications of these results that directly challenge implicit assumptions within the Sabatier principle are discussed.
Experimental Section
Synthesis
and Characterization of Ce-MOF-808
Nanocrystalline Ce-MOF-808 was synthesized, and the solvent was removed from the MOF pores using a previously reported procedure.? The MOF was stored under an N_2_ atmosphere at room temperature until further use. Physical characterization of this MOF, including the N_2_-adsorption–desorption isotherm, powder X-ray diffraction (PXRD) pattern, and scanning electron microscopy (SEM) image, can be found in the Supporting Information (SI; Figures S1–S3).
Brief Elaboration
on the Electrochemical Measurements Using Ce-MOF-808
The Ce-MOF-808-based electrode was prepared through simple drop-casting onto a fluorine-doped tin oxide (FTO) surface, following our previous report.? Here onward, this electrode will be referred to as Ce-MOF-808|FTO.
All electrochemical measurements were performed in aqueous electrolytes with buffers such as 3-(N-morpholino)propanesulfonic acid (MOPS), tris(hydroxymethyl)aminomethane (Tris), and boric acid (H_3_BO_3_), and 0.1 M of NaCl. The concentration of the buffers used, denoted as [buffer], ranged from 0.1 to 1.0 M (vide infra for more details). The pH values of these electrolytes were adjusted between 7 and 10, depending on the buffer identity. For all measurements, Pt wire and Ag/AgCl (3 M KCl) were used as counter and reference electrodes, respectively. Unless otherwise noted, cyclic voltammograms (CVs) were measured at a scan rate (υ) of 25 mV s^–1^. Further details can be found in the SI. Using the same experimental setup as that used for CVs, controlled potential electrolyses (CPEs) of the same films were used to further understand the kinetics of redox reactions within Ce-MOF-808.
Results
Surface Charges
of Ce-MOF-808
Surface charges of Ce-MOF-808 crystals were probed using zeta-potentials (E(ζ)) in buffers and pHs used in the electrochemical measurements (vide infra). E(ζ) of Ce-MOF-808 in buffers like MOPS and H_3_BO_3_ (0.1 M in concentration) that are anionic upon deprotonation, were generally negative. In Tris buffer, at pH 7 and 8, E(ζ) of the MOF was positive, but became negative at pH 9, likely due to deprotonation of otherwise cationic [TrisH]^+^. For all buffers and pHs,
We note that the low colloidal stability of Ce-MOF-808 proved difficult to measure E(ζ), and thus, we prefer not to interpret these values excessively.
Brief Elaboration on the CVs of Ce-MOF-808|FTO
with Varying Scan Rates
This section describes how the anodic and cathodic peak current densities (j p,a and j p,c) scale with the υ in CVs of Ce-MOF-808|FTO. We have previously conducted these measurements in a pH 8-adjusted 0.1 M Tris buffer. Here, we have expanded on our previous work to include varying buffer species and concentrations with pH values adjusted between 7 and 10 (vide supra). As noted in the next section, these electrolytes were further employed to determine PCET kinetics within Ce-MOF-808.
The plots showing log of j p,a or j p,c values vs log(υ) are shown in Figures S7–S11. Regardless of the buffer identity, its concentration, or the proton activity, the two parameters linearly scaled to each other with slopes ranging between to 1; slopes are listed in Table S4. In Tris and borate-based electrolytes, regardless of the pH, the slopes were always for both anodic and cathodic processes, suggesting that the reaction rate is controlled by the kinetics of H^+^/e^–^ addition or removal at the Ce_6_ node. In contrast, in MOPS-containing electrolytes, the slopes were closer to , suggesting that at least in a CV time scale, the reaction is diffusion-controlled. At a glance, this is intuitive as MOPS is more sterically demanding than Tris or borates. Yet, an increase in MOPS concentration resulted in a slope approaching 1, suggesting that the reaction becomes more kinetically controlled; this trend holds for Tris and borate-based electrolytes as well.
CPE Using Ce-MOF-808|FTO and Apparent Diffusion Coefficients
We begin this section by describing CPE measurements of Ce-MOF-808|FTO at pH 8-adjusted 0.1 M Tris buffer as a case study. CVs of Ce-MOF-808|FTO in this electrolyte exhibited one reversible Faradaic couple, which can be attributed to the Ce^4+^O/Ce^3+^OH redox reaction. Here, we emphasize that this H^+^/e^–^ stoichiometry has been established in all buffers employed here by us previously, and we direct the readers to the following reference.? CPEs were conducted at two applied potentials, which are either cathodic or anodic of the peak potentials (E p,c and E p,a) by 240 mV; these potentials are denoted E CPE,c or E CPE,a, respectively, in the inset of FigureA. This ensures that all electrochemically active Ce cations are in either the reduced or the oxidized state.
(A) Representative chronoamperometric curves of Ce-MOF-808|FTO measured at E CPE,a and E CPE,c. The inset shows representative quasi-reversible CVs with positions of E CPE,a and E CPE,c with respect to the peak potentials, E p,a and E p,c. (B) Representative Cottrell plots derived from the chronoamperometric curves shown in (A) with D app,Ox and D app,Red derived from the slopes. The errors in the D app values represent 1σ of linear regressions. For (A,B), 0.1 M Tris buffer at pH = 8 was used. Plots of (C) D app,Ox or (D) D app,Red vs pH of Ce-MOF-808|FTO using various buffers as electrolytes. All buffer concentrations are set at 0.1 M; values at other buffer concentrations can be found in the SI. Errors in these two plots represent 1σ of triplicate measurements. An increase in buffer concentration caused E(ζ) to approach 0 mV, which suggests that buffer species are indeed ‘screening’ the MOF surface charge. These results can be found in Figure S4 and Table S1 in the SI.
Upon conducting CPEs at these potentials, we observed a rapid decrease in measured current density (j) as a function of time; at t = 5 s and beyond, the measured j was <5% of that at t = 1 s (FigureA). Using the Cottrell equation (eq), these chronoamperometric curves yield the apparent diffusion coefficients in oxidative or reductive reactions, denoted D app,Ox or D app,Red, respectively. ?−? ? ? ? ? In eq, C Ce refers to the ‘effective concentration’ of Ce cations within the MOF film, which was estimated from the dimensions of the film and the total amount of charge passed during each CPE measurement; see the following references and the SI for details. ?,? In this equation, F denotes the Faraday constant (96485 C mol^–1^).
During CPE, the node-bound H^+^/e^–^ ‘hop’ to the adjacent node, and thus the PCET hopping kinetics throughout the MOF lattice can be mimicked using diffusion coefficients; as discussed later, these diffusion coefficients can be directly translated to apparent rate constants (k app) using the distance at which the bound H^+^/e^–^ would have to hop.
As shown in FigureB and Table, D app,Red is ca. 3–10 times higher than D app,Ox; in other words, with the same amount of thermodynamic driving force, the addition of H^+^/e^–^ to the Ce_6_ node is kinetically more favorable than the reverse oxidation reaction. PXRD patterns of Ce-MOF-808|FTO before and after CPE measurements were identical, suggesting the retention of crystallinity (see Figure S2).
1: D app Values of Ce-MOF-808|FTO Determined from Cottrell Equations in Electrolytes with Distinct pHs and Buffers
The concentration of the Tris buffer was altered while retaining the pH at 8 to examine its impact on D app values. As shown in Figure S15 and Table S5, D app,Ox was nearly constant when the Tris concentration varied between 0.1 and 1 M, ranging between 0.8(1)–1.1(3) × 10^–12^ cm^2^ s^–1^. D app,Red had an apparent decrease as the concentration of Tris increased; these results are further discussed later.
Diffusion Coefficients
and PCET Hopping Kinetics of Ce-MOF-808|FTO at Various pHs and Buffers
Using the identical experimental protocol as described above, we conducted a series of CPE measurements in electrolytes using buffers beyond Tris, and at various pHs. As shown in FigureC and Table, D app,Ox seemingly decreased asymptotically as pH increases, and this trend was largely consistent over all three buffers, MOPS, H_3_BO_3_, and Tris. In contrast, D app,Red was highly dependent on the electrolyte pH and buffer identity (FigureD and Table). In general, D app,Red measured in Tris buffer were consistently the largest at any given pH, followed by those measured in MOPS, then in H_3_BO_3_ (see the SI). Notably, H_3_BO_3_ or its deprotonated form, [H_2_BO_3_]^−^ is sterically the least demanding, and yet exhibited lower D app,Red than more sterically demanding MOPS or Tris. Thus, we believe the measured differences in D app values between different buffers are not simply due to diffusive complications. Instead, buffers with different functional groups must be interacting in a distinct fashion with the Ce_6_ node of Ce-MOF-808 such that, at least for the reduction of Ce^4+^O to Ce^3+^OH, its hopping kinetics are highly sensitive to the exact chemical composition of the electrolyte.
FigureD further highlights an intriguing trend in D app,Red of Ce-MOF-808, where its reduction kinetics are seemingly the highest at pH 8, regardless of the buffers. We will return to this trend in the Discussion section.
We have further measured D app values at various concentrations of Tris buffers when the pH values of the electrolytes were adjusted to 7–9. Representative Cottrell plots are shown in Figures S14 and S16. As noted above, D app values exhibited complex dependence that was unique to the pH and the buffer identity. For example, in a pH 7-adjusted Tris buffer, the D app,Red seemingly increased from 3.6(4) to 8(1) when the Tris concentration increased from 0.1 to 0.4 M. However, at higher concentrations, D app,Red decreased (see Table S5 and Figure S21). D app,Ox stayed nearly identical to those observed in pH 8-adjusted Tris buffer (vide supra). In contrast, in pH 8-adjusted H_3_BO_3_ buffer, the D app,Ox decreased with the increase in buffer concentration, while D app,Red remained nearly identical (Table S5 and Figure S22).
Diffusion Coefficient vs
Amount of Available Ce4+/3+ at Electrode Surface
Up to this point, all D app values have been measured by applying E CPE,a, then E CPE,c, following the direction of CVs. To examine if this caused any effect on D app values, we conducted similar CPE measurements, but starting with the reductive reaction. Here, we employed pH 8-adjusted 0.1 M MOPS buffer as the measured D app,Ox and D app,Red under this condition is quite distinct from each other.
As shown in Figure S23, D app,Red did not change significantly when the cathodic potential (E CPE,c) was first applied. This suggests that the apparent anisotropy in D app values is intrinsic to the redox properties of Ce-MOF-808.
Conversion of D
app to Rate Constants of PCET Hopping
D app values have been employed to decipher PCET hopping kinetics, as similar values have been reported for other redox-active MOFs. ?−? ? ? ? ? In this section, we describe the conversion of D app values to the apparent hopping rate constants (k app) by using eq and by knowing the distance between the two redox active sites (r).? Here, we note that this apparent rate constant is related to the microscopic hopping of protons and electrons, rather than the intrinsic rate constant of adding protons and electrons to the pristine node. ?,? This is why these rate constants have the units of s^–1^, while those typically reported for PCET reactions of homogeneous species are in the units of M^–1^ s^–1^. ?−? ? Further discussions on this distinction can be found in the Discussion section.
Derivation of k app values allows comparisons of PCET hopping kinetics beyond MOF-based systems (as described in the Discussion section). In essence, k app is the apparent ‘diffusion’ rate constant of H^+^/e^–^ bound on the node to hop to an adjacent site. Furthermore, k app values can be directly applied to many theories defining rate vs driving force relationships (see the Discussion section for more details).
Because CPE measurements do not indicate r, we turned to the crystallographic results of Ce-MOF-808 reported previously (cf. ?). The derived k app values are shown in Table. Here, we considered two Ce–Ce distances. The intranode Ce–Ce distance of ca. 3.5 Å is the shortest, and therefore, according to the Marcus theory, this charge hopping should be the most favorable. As described previously, Ce_6_ nodes within only a few crystallographic units away from the underlying FTO surface are electro-active.? Thus, the intranode hopping should quickly become kinetically uphill. We also considered the internode distance of 7.7 Å. This internodal distance is believed to be the most relevant for through-film charge transport, as discussed later. No other internode distances were considered as PCET hopping of r > 10 Å is unlikely.
2: k app Values of Ce-MOF-808|FTO Determined from D app Values and Two Ce–Ce Distances Derived from Crystallographic Data
Attempts to measure intrinsic electron transfer rate constants (k ET) were unsuccessful. Typically, k ET values are determined through examining how the difference between E p,c and E p,a (ΔE p) changes as a function of a CV scan rate (υ); this method is typically called the Nicholson method. ?,? As shown in Figure S24, this method proved challenging as the ΔE p-derived dimensionless parameter, Ψ, did not scale with υ in an expected manner. Thus, we have further measured the charge transfer resistance (R CT) of Ce-MOF-808|FTO by using electrochemical impedance spectroscopy (EIS).? While this measurement was successful, sample-to-sample variation was high. Namely, the R^ CT ^-derived k ET values of four nominally identical Ce-MOF-808|FTO ranged between 5.7(5) × 10^–7^ and 1.07(4) × 10^–5^ cm s^–1^. This inconsistency is likely due to the difference in the amount of electroactive Ce near the underlying FTO, as further indicated by the difference in the EIS-derived double-layer capacitance (Figure S25 and Table S7). Such a large sample-to-sample variation was not observed in D app measurements because D app probes the kinetics of H^+^’s/e^–^’s hopping within the MOF lattice after the initial charge transfer. Thus, we prefer to focus on D app-derived k app values in this study.
Half-Wave Potentials
of Ce4+O/Ce3+OH Redox under CPE Reaction Conditions
The focus of this work is on PCET kinetics rather than thermodynamics, as we have established the latter in our previous publication.? Nevertheless, we briefly note here that the half-wave potentials (E 1/2) derived from the CVs were somewhat dependent on the buffer concentrations, though not to the extent of D _ app _ values. In general, E 1/2 was higher by ≤100 mV when the buffer concentration increased from 0.1 to 0.2 M and remained nearly identical with further increases in buffer concentration. The only exception to this trend is H_3_BO_3,_ and we describe why the borate-containing buffer was an exception later.
This noticeable change in E 1/2 by ≤100 mV equals ±2 kcal mol^–1^ error on the thermodynamics of this PCET reaction. This error range is within that reported previously for Ce-MOF-808 (see Scheme), and is typical for similar values reported for MOFs, metal oxides, and even molecular species. ?,?,?
Thermodynamics of Buffer Interactions with Ce-MOF-808
To better understand the interaction between Ce-MOF-808 and buffers, we conducted isothermal titration calorimetry (ITC) measurements using a modified procedure from that reported previously by Drout et al.? Experimental details can be found in the SI. ITC measurements were conducted at pH 8-adjusted aqueous solutions for MOPS and Tris buffers, and at pH 9 for H_3_BO_3_ to ensure the partial deprotonation of buffer molecules. The concentrations of the buffers ranged between 8 and 50 mM and were individually determined through a series of optimizations. As shown in Figure and Table, all buffer-MOF interactions were thermoneutral to exergonic. The reaction between borate and Ce-MOF-808 was the most exergonic, with the ΔG of ca. −6.3 kcal mol^–1^. Surprisingly, this borate-Ce-MOF-808 interaction was largely driven entropically and was, if at all, endothermic. This contrasts with MOPS and Tris interactions with Ce-MOF-808, where for ΔH was below zero. Tris–MOF interaction was largely enthalpically driven, where TΔS is negative (i.e., energetically unfavorable).
Figure summarizing thermodynamic parameters, ΔH, TΔS, and ΔG of interactions between buffers and Ce-MOF-808. All errors are 1σ of triplicate measurements.
3: Summary of Thermodynamic Parameters, ΔH, TΔS, and ΔG Derived from the ITC Measurements of Ce-MOF-808 in Various Buffers and pH
At pH 8, about half of the Tris molecules within the solution remain protonated as [TrisH]^+^. This holds true for pH 9-adjusted H_3_BO_3_. To examine the role of protonation, we conducted similar ITC experiments in pH 9-adjusted Tris and pH 10-adjusted borate solutions. As shown in Figure, deprotonation of [TrisH]^+^ to Tris in pH 9 resulted in a slight increase in ΔG largely due to an increase in ΔH. In contrast, the thermodynamic parameters of borates in pH 9 vs 10 were more similar than different.
Computational
Modeling of Interactions between Ce6 Node and Buffers
To computationally model the buffer-MOF interactions, we performed free energy calculations of “buffer insertion” reactions (ΔG Buf) to the cluster model of the Ce_6_ node of Ce-MOF-808. The ωB97M-V/def2-TZVPPD//ωB97X-D4/def2-SVPD level of theory. We have employed both the SMD(water) implicit solvent model and one explicit water molecule as solvent. ?−? ? ? Our primary focus was the insertion of buffers onto the node via the displacement of one or more of −OH/–OH_2_ groups on the node. However, as described below, our initial attempts at examining the buffer-node interaction also resulted in buffer-dependent proton transfer. Full computational details are provided in the SI.
We began with computational modeling of the interaction between a singly deprotonated [H_2_BO_3_]^−^ and the pristine Ce_6_ node. Intriguingly, we observed a proton transfer from μ_3_–OH of the node to the buffer anion. The pK _ a _ values of these μ_3_–OH moieties were calculated to be 7–9, even in the presence of a H_2_O molecule, which indeed suggests that this proton transfer is thermodynamically favorable (see Tables S8 and S9 for the exact pK a values). Given the pK a, MOPS and Tris did not undergo a similar proton transfer. We believe this explains why (A) E 1/2 vs NHE measured in borate buffers resulted in a relatively large shift when buffer concentrations were altered, and (B) borate-node interaction is entropically driven.
Next, we performed calculations solely focusing on insertion reactions. In this section, we will largely focus on thermodynamically most stable states for each buffer, with their energies and structures shown in Table and Figure, respectively; see the SI for the full list of ΔG_Buf_ in various binding motifs (Table S9). FigureA–C summarize the most thermodynamically stable, optimized structures of the three buffers bound to the pristine Ce_6_ node. For H_3_BO_3_/[H_2_BO_3_]^−^, the reaction free energies to displace a terminal −OH_2_ (ΔG Buf) ranged from −0.3 to +2.0 kcal mol^–1^. In contrast, the ΔG Buf values to insert borate buffer to terminal −OH sites or binding in μ_2_-fashion were much more endergonic (+3.5 to +9.5 kcal mol^–1^). For Tris, our simulations indicate that displacement of terminal −OH (via deprotonation of Tris to release H_2_O) is more favorable, but still less energetically preferable than the displacement of terminal −OH_2_, with the difference in free energy of the two states ΔΔG Buf of 2–3 kcal mol^–1^. Similar reactions with MOPS were, overall, mildly to highly endergonic (+0.7 to +20.9 kcal mol^–1^); see Table for all ΔG Buf values.
Optimized structures of the Ce6 node with inserted buffers. (A) H3BO3 bound via terminal −OH2 substitution; (B) Tris bound via terminal −OH2 substitution; (C) MOPS bound via terminal −OH2 substitution. Panels (D, E) show corresponding reduced node structures with the Ce3+ site (cyan) and protonation of a terminal −OH site. Atom colors: Ce4+ = light yellow, Ce3+ = cyan, O = red, C = gray, H = white, N = blue, B = pink, S = yellow.
4: Summary of ΔG Buf between Various Buffers and Ce6 Nodes with or without an Extra 1H+/1e–
We further performed similar simulations as above using Tris and H_3_BO_3_, but with a singly reduced node with a hydrogen atom added to the adjacent terminal −OH group. This effectively reduced the closest Ce cation to the 3+ oxidation state. For both of these species, ΔG Buf became more endergonic by ∼3–4 kcal mol^–1^, suggesting that buffers are less likely to be coordinated upon reduction; see FigureD,E for the optimized structures. As described in the Discussion section, this difference in buffer-node binding thermodynamics drives the apparent anisotropy in PCET hopping kinetics of Ce-MOF-808.
Discussion
CPE-Derived Diffusion Coefficients
of Ce-MOF-808|FTO and in Related MOF-Based Systems
CPE was used to derive apparent diffusion coefficients (D app’s) of the redox reaction within the pores of Ce-MOF-808. The D app values were measured for both the oxidative and reductive reactions involving 1H^+^/1e^–^ transfer to and from the Ce_6_ node and thus involve the Ce^4+^O/Ce^3+^OH couple.? The D app values obtained from Cottrell analysis of chronoamperometric data represent the effective proton/electron hopping between redox-active cerium within the MOF lattice. Unlike conventional diffusion coefficients that describe the movement of solvated ions through porous materials, these values quantify the rate of charge propagation via PCET across the MOF. This interpretation reflects the lack of an ion concentration parameter in the Cottrell equation (eq). The measured D app values were roughly within the expected range for an MOF film fabricated via drop-casting; based on the following references, MOF-based films synthesized in a similar fashion exhibit D app values ranging from 10^–11^ to 10^–13^ cm^2^ s^–1^. ?,?,?
We will first focus on D app values as these values are widely used to understand the redox kinetics and charge hopping within MOFs (vide infra). Discussions of k app values are described later.
Anisotropic D app values have previously been reported by others. A Zr-based MOF, NU-1000, for example, features redox-active pyrene-based organic linkers with D app values that depend on the orientation of the MOF crystals with respect to the underlying electrode, which in turn influences ion diffusion within the MOF pores.? The same MOF decorated with metallocene or 2,2′-bipyridine complexes has been used by Morris and co-workers to determine the D app values of electrons and the charge-balancing ions (SchemeA). ?,? In all cases, electrons reside within the redox-active units and must hop to the nearby unit during CPE measurements; thus, these reactions are considered as outer-sphere electron transfer (ET) reactions.
Schematic Illustration Showing (A) Ion Coupling in Outer-Sphere ET of Metallocene within NU-1000 and (B) O–H Bond Formation Due to Inner-Sphere PCET Reaction within Ce-MOF-808
In contrast, the PCET reaction of Ce-MOF-808 yields a covalent O–H bond at the Ce_6_ node (SchemeB).? Typically, O–H bonds on a surface of metal-oxo sites are localized, unlike the electrons that are ‘loosely coupled’ to counterions. ?,? Our computational simulations also indicate highly localized spin density on one of the six Ce cations upon reduction, suggesting electron localization. We and others have reported similar computational observations upon adding 1H^+^/1e^–^ to the Ti-oxo nodes of the MOF, Ti-MIL-125. ?−? ? In other words, Ce-MOF-808 undergoes an inner-sphere PCET reaction.
For Ce-MOF-808 and other cerium-oxo-based systems, reduction of Ce^4+^O to Ce^3+^OH typically causes large lattice strain as the volume of the Ce^3+^ cation is ca. 50% larger than that of Ce^4+^. ?−? ? Thus, it is not surprising that the delocalization of electrons within CeO_x_ is unfavorable due to ion expansion and contraction within the lattice.
As described below, the inner-sphere nature of the PCET reactions on Ce-MOF-808 is fundamental to understanding the apparent redox anisotropy and kinetic vs electrolyte identity relationship.
Buffer-Dependent D
app Values of Ce-MOF-808 and Their Correlation to the Buffer-Node Interaction
A series of CPE measurements using Ce-MOF-808|FTO have further demonstrated that D app values depend on the identity and concentration of aqueous buffers.
The difference in the free energy of chemical interactions between buffers and Ce_6_ nodes of Ce-MOF-808 may, at first glance, explain the difference in D app values observed in our work. Borate anions bind to the surfaces of metal oxides like nickel and cobalt oxides, ?,? and indeed, our ITC measurements indicate exergonic borate-node interactions. Using instead a weakly coordinating MOPS, on the other hand, the ΔG was nearly thermoneutral; we will elaborate on the exact reaction and the ITC-derived ΔH/ΔS later.
Electrolyte-dependent redox kinetics within MOFs have commonly been explained using the mobility of charge-compensating ions within the MOF pores. For example, D app values of metallocene within NU-1000 (vide supra) are larger when tetrakis(pentafluorophenyl)borate ([BAr^F^ 5]^−^) ions are introduced as charge-compensating anions as compared to hexafluorophosphate (PF_6_ ^–^).? The weak Coulombic interaction between the oxidized, and therefore cationic, metallocenium and large [BAr^F^ 5]^−^ facilitates ion movement within the MOF pores compared to the same reaction with a smaller PF_6_ ^–^ anion. Thus, in an outer-sphere ET reaction, the counteranion mobility often defines the redox kinetics.
However, we believe that the observed electrolyte-dependent PCET kinetics of Ce-MOF-808 cannot be explained, at least completely, by ionic interaction. The reduction of the Ce^4+^ to Ce^3+^ within the node can be charge-compensated by a cation like [TrisH]^+^. Thus, in a pH 7-adjusted Tris buffer enriched in [TrisH]^+^, D app,Red should be lower because of the strong ionic interaction. Yet, D app,Red in Tris buffers, regardless of the pH, was higher than those measured in MOPS or borate buffers. Furthermore, the buffer-node Coulombic interaction cannot explain the apparent anisotropy between D app,Red and D app,Ox. The change in ionic strength via modulation of buffer concentration also resulted in distinct and nonintuitive trends in PCET kinetics (see SI for details).
Here, we further emphasize that the product of the inner-sphere PCET reaction with equimolar amounts of protons and electrons retains charge neutrality. ?,?,?,?,?,? As shown in Scheme, the addition of H^+^ to the terminal –OH and electron to Ce^4+^ does not result in a charged product like those that would otherwise form in outer-sphere ET reaction. Thus, it is difficult to conceive how the kinetics of converting a charge-neutral substrate to a charge-neutral product would depend on Coulombic interactions. Overall, ionic interaction seems to play little to no role in defining the PCET kinetics of Ce-MOF-808.
Thus, it is more appropriate to assign the buffer-dependent D app values to the chemical interactions between the buffers and Ce-MOF-808. We discuss the exact interactions between different buffers and the nodes of Ce-MOF-808 in the next section.
Experimental and Computational Derivation
of Buffer-Node Interactions
In this work, we employed ITC measurements and computational modeling to probe the thermodynamics of buffer-node interactions.
According to the ITC measurements, borate buffer interacted the strongest, followed by Tris, and then MOPS (Table and Figure). This is expected, as borate buffers are known to coordinate to surfaces of transition metal oxides strongly, and can even participate in catalytic reactions (cf. ?). In fact, we employed these three buffers precisely because of the expected difference in coordination thermodynamics with the Ce_6_ nodes of Ce-MOF-808. It was, however, surprising that the borate-node interaction was entropically driven. If the reaction is driven by the strong Ce–O-borate bond, then we expect that this reaction should instead be enthalpically driven. Our initial computational modeling indicated that when a singly deprotonated borate anion, [H_2_BO_3_]^−^, approached the node, the μ_3_–OH donated the proton to the anion. We acknowledge that this reaction is performed en vacuo with at most one proximal H^ 2 ^O molecule. Thus, pore-filled H_2_O network is not considered. However, it is still tempting to claim that this release of solid-bound proton to [H_2_BO_3_]^−^ then quickly to H_2_O (through the Grotthuss mechanism) causes the ‘borate-node’ interaction to be entropically favorable. This is reminiscent of entropically driven proton transfer reactions within micropores of zeolites, ?,? or between membranes in biological systems. ?,?
Protonation of [H_2_BO_3_]^−^ alters the acid–base equilibrium, and, effectively, increases the apparent proton activity within the MOF pores. This explains the relatively large deviation of E 1/2 vs NHE of the Ce^4+^O/Ce^3+^OH redox reaction when the borate concentration was altered at a given pH; at buffer concentrations of 0.1–0.2 M, a large fraction of [H_2_BO_3_]^−^ is protonated within the MOF pores, and thus the local pH proximal to the node should be lower than the bulk electrolyte.
Returning to the buffer-node interaction, our computational simulations indicated that ΔG Buf solely from borate coordination to the pristine Ce_6_ node is around −0.3 kcal mol^–1^ in its most thermodynamically stable configuration. This relatively thermoneutral ΔG Buf suggests that the solubilized, but pore-confined H_3_BO_3_ is in dynamic equilibrium with its node-bound state by displacing the terminal −OH_2_ group. Furthermore, much of the ITC-derived ΔG likely arises from the proton transfer between [H_2_BO_3_]^−^ and the MOF (vide supra). Conversely, when Tris-node interaction was computed, the ΔG Buf was more negative (−2 kcal mol^–1^; see Figure). ITC-derived ΔH of −6 to −8.7 kcal mol^–1^ also corroborates this simulation.
It is noteworthy that, thermodynamically, the most favorable states of all three buffers resulted in the displacement of only one terminal −OH/–OH _ 2 _ group. Given that carboxylate groups on the organic linker of the MOF bridge between two Ce cations, this may look surprising. Indeed, formate anions of similar size to H_3_BO_3_ can bind to two metal cations within MOF-808 and NU-1000 with similar inorganic nodes. ?,? However, recently, Liu et al. have reported that postsynthetically introduced benzoates to the MOF, NU-1000, bind in a similar fashion as H_3_BO_3_ binding to the Ce_6_ node.?
ITC measurements can only indicate the interaction between the pristine Ce-MOF-808 and the buffer. Most, if not all, Ce cations within Ce-MOF-808 are in the 4+ oxidation state.? Thus, we turned to computational simulations of buffer-node interaction when the node is reduced with 1H^+^/1e^–^. As described in the Results section, for both Tris and H_3_BO_3_-bound nodes, reduction by 1H^+^/1e^–^ resulted in an increase in ΔG Buf by around 3–4 kcal mol^–1^.
The ca. 3–4 kcal mol^–1^ difference between the buffer-binding thermodynamics of oxidized vs reduced node, denoted ΔG Buf,Ox or ΔG Buf,Red, respectively, suggests that under otherwise identical conditions, the oxidized node is ∼150–800 times more likely to be bound to the buffer molecules than the reduced node; see eqs and ? and the related equilibrium constants, K Buf,Ox and K Buf,Red.
As described in the next section, it is this difference in buffer affinity that leads to the apparent violation of the principle of microscopic reversibility.
Anisotropic D
app/k app and Apparent Microscopic “Irreversibility”
From here onward, we will employ both D app and k app values as we begin comparisons of PCET kinetics between Ce-MOF-808 and other redox-active systems beyond MOFs. In this section, we focus on the anisotropy in PCET kinetics of Ce^4+^O/Ce^3+^O–H redox couple.
First, we note that for every electrode and electrolyte, the E CPE values were controlled to be ±240 mV with respect to the peak potential of CVs measured prior to any CPE measurements. Thus, in all cases, the additional reaction free energy to drive the PCET reaction should be identical. Yet, as shown in Table, k app,Red values of Ce^4+^O reduction to Ce^3+^OH in all electrolytes were at least 3–10 times larger than those of the oxidation reaction (k app,Ox). All chronoamperometric measurements exhibited a rapid decrease in current within the first 5 s, and the measured current plateaued, suggesting that the system has reached an equilibrium. Thus, the observed trend between k app and pH suggests that, regardless of the electrolyte, buffer molecules facilitate node reduction and/or hinder oxidation. At first glance, this appears to violate the principle of microscopic reversibility (see ref ? for details on microscopic reversibility). As described below, we can explain this through buffer-node interactions to strictly uphold the thermodynamic principles. Nevertheless, this is particularly interesting, as previously, we have demonstrated that the Ce^3+^O–H BDFE is independent of the buffer and the electrolyte pH.?
The previously observed buffer-independent Ce^3+^O–H BDFE does not rule out any interaction between the buffer and the node. The square scheme shown below illustrates the PCET reaction of buffer-free and buffer-bound nodes, where ‘Buf’ is used to denote a generic buffer molecule in the electrolyte (Scheme). Only one out of six Ce cations is shown for clarity. According to Hess’s Law, the PCET thermodynamics of the buffer-free and buffer-bound nodes would be nearly identical if the buffer-node interaction between oxidized and reduced nodes is similar; in other words, ΔG Buf,Ox ≈ ΔG Buf,Red. As described above, our computational modeling indicates that the difference in these two ΔG values was 3–4 kcal mol^–1^; this difference is more or less within the typical error range of BDFE, which is ±2 kcal mol^–1^.?
Square Scheme Illustrating the PCET Reaction of Buffer-Free and Buffer-Bound Nodes of Ce-MOF-808
However, this 3–4 kcal mol^–1^ difference between ΔG Buf,Ox and ΔG Buf,Red can have a more significant effect on PCET hopping kinetics within Ce-MOF-808. Here, we will employ a borate buffer as a case study. ΔG Buf,Ox of borate buffer is more likely to be close to zero, even though experimentally, it was exergonic due to the proton transfer between borate and the node (vide supra). ΔG Buf,Red is more endergonic. Therefore, when 1H^+^/1e^–^ hops from one Ce cation to another by applying E CPE,c, the subsequent liberation of node-bound borate to the electrolyte should be thermodynamically favorable, and should occur instantaneously. This reaction is shown as the blue arrow in Scheme. In the reverse oxidative reaction, however, the borate binding is more thermoneutral. Thus, this reaction is not a ‘simple’ PCET reaction involving a pristine node. Instead, the measured D app,Ox/k app,Ox must be sensitive to both the H^+^/e^–^ hopping and the buffer binding. The two red arrows in Scheme illustrate that during oxidation, at least transiently, the buffer-free, oxidized node forms as an ‘intermediate’ that further undergoes dynamic equilibrium with the buffers in the MOF pore.
Given that ΔG Buf,Ox of MOPS buffer was also measured to be nearly thermoneutral experimentally and computationally, the above explanation should hold for the anisotropy observed in MOPS buffer. However, for the Tris buffer, ΔG Buf,Ox was measured to be exergonic. The difference between experimental and computational ΔG Buf,Ox was roughly 2 kcal mol^–1^. Computationally, we derived ΔG Buf,Red to be ∼2 kcal mol^–1^, making ΔΔG Buf to be ∼4 kcal mol^–1^. We have described below in detail that the difference in experimental and computational values is likely due to the lack of explicit solvent molecules in the in silico model (vide infra). However, under otherwise identical conditions, ΔΔG Buf should be more accurate. Together, it is tempting to claim that the ‘true’ ΔG Buf,Red is isoergic (i.e., ΔG Buf,Red ≈ 0). This would pose the reduction step to be a combination of 1H^+^/1e^–^ addition followed by slow buffer release. The buffer binding after removal of 1H^+^/1e^–^ is likely spontaneous.
In essence, the redox reactions of Ce-MOF-808 are not purely an electrochemical reaction, but are what would otherwise be called the EC reaction (E = electrochemical, C = chemical). Following an electrochemical PCET reaction, the reduced or oxidized node undergoes a chemical, buffer binding/release. This should, to some extent, cause the ratio of the anodic and cathodic peak currents to deviate from the ideal value of unity. Indeed, we and others have observed this previously for Ce-MOF-808. ?,?
This square scheme also illustrates the apparent trend between D app/k app and the electrolyte pH. In a pH 8-adjusted borate buffer, for example, the pore must be filled largely with H_3_BO_3_, particularly due to the proton transfer from the node to the small amount of [H_2_BO_3_]^−^ (see above for details). Because the most thermodynamically favorable binding motif of H_3_BO_3_ to the node is through the displacement of terminal −OH_2_, due to Le Chatelier’s Principle, the H_3_BO_3_ binding must be facilitated. Because ΔG Buf,Ox is close to thermoneutral, but ΔG Buf,Red is endergonic, k app,Red should be larger than k app,Ox in this electrolyte. At pH 10, the pores are filled instead with [H_2_BO_3_]^−^ and its binding to the node via displacement of terminal −OH is endergonic (see Results section). Thus, in this case, the two k app values are more similar than different. For Tris buffers, protonation occurs at the N-atom, which is not the coordination site to the node, and therefore, k app,Red is higher than k app,Ox for all pHs.
In sum, the apparent microscopic irreversibility can be explained through the difference in buffer-node interaction at different oxidation states. Both the substrate and the product during the reduction or oxidation are chemically distinct species.
Consequences
of Electrolyte-Dependent, Anisotropic PCET Kinetics on Linear Free Energy Relationships and Volcano Plots
The Bell–Evans–Polanyi (BEP) relationship that connects the change in reaction thermodynamics (ΔΔG rxn) to the change in transition state free energy (ΔΔG ^‡^) has been the basis of kinetic vs thermodynamic relationships of homogeneous and heterogeneous systems (eq). ?,?,?,? The transfer coefficient, α, that connects the thermodynamic and kinetic parameters, is often assumed to be and, in many cases, electrolyte independent.
The classical BEP equation can be elaborated to explicitly include k app and equilibrium constants of reduction vs oxidation reactions (eq). We note that in this equation, the two k app and K eq values of redox reactions that would otherwise be considered an identical reaction except for the direction of the reaction. In other words, for a microscopically reversible reaction, α should be undefined because the logarithmic components on the two sides of the equation will be zero. We acknowledge that the k app values refer to the hopping kinetics, while strictly, instrinsic rate constants should be employed for the BEP relationship. We have described the difficulty in determining accurate intrinsic rate constants above.
For a microscopically irreversible system, α becomes a defined value even between the reductive vs oxidative reaction of a nominally same redox couple. We have previously demonstrated that the Ce^3+^O–H BDFE is largely buffer-independent and is quantitatively similar to those computed (without explicit buffer molecules).? We have also unified the difference between E CPE and peak potentials to be 240 mV. Thus, we can assume that buffers have a minimal role in altering PCET thermodynamicsi.e., in Scheme, ΔG PCET ≈ ΔG PCET,Buf. Therefore, ΔΔG rxn is essentially dominated by the difference between ΔG Buf,Ox vs ΔG Buf,Red. This difference was ca. 2–4 kcal mol^–1^ (vide supra). The ratios of k app,Ox vs k app,Red in all buffers were from 1:3 to 1:10. Using these values and combining eqs and ?, the derived α ranges between 0.1 and 0.2. In essence, this α is better denoted as Δα between the reduction vs oxidation reactions. Thus, depending on the direction of the reaction, the measured α may deviate by ±Δαi.e., assuming an otherwise ideal α of , the actual α of a microscopically irreversible system can range from 0.3 to 0.7.
We emphasize that this defined α for nominally identical redox couples indicates that, depending on the direction of the reaction, the kinetic vs thermodynamic relationship is distinct. This may be why, for example, many metallic/metal oxide-based systems exhibit α that deviates from in PCET/HAT reactions, ?−? ? though many other reasons are possible (see below).
The reason for this anomalous behavior is rather simpleoxidation and reduction reactions are chemically distinct reactions. The BEP relationship assumes a single-step reaction that is of identical chemical nature and is microscopically reversible. ?,?,?,? Clearly, this is not true for PCET reactions of Ce-MOF-808.
Despite this rather ‘simple’ reason, the implicit assumption that the interfacial reactions in heterogeneous catalysis are microscopically reversible is prevalent. The classical example of this assumption is the volcano plots for HER. Often, monometallic and binary/ternary catalysts like metal sulfides and phosphides are plotted on the same volcano plot, with exchange current density (j 0) used as the metric of their HER activities.? This implies that under an identical driving force, metal sulfides/phosphides can be a competent catalyst for the reverse H_2_ oxidation reaction (HOR). However, experimentally, metal sulfides/phosphides that are HER-active are almost always HOR-inactive. This apparent catalytic irreversibility is often due to distinct surface-bound H-atoms that are involved in the two reactions. H_2_ dissociation on metal phosphides is heterolytic, yielding strong metal–H bonds, limiting the HOR rate by its bond dissociation. In HER, however, H_2_ likely evolves by involving weakly bound surface-H species either through Heyrovsky or Tafel-like steps. ?,? This contrasts with Pt and other monometallic catalysts, where, regardless of the interfacial PCET or H_2_ dissociation, at least nominally, the two reactions yield the same intermediate.? In essence, Ce-MOF-808 behaves similarly to metal sulfides/phosphides. The reactive sites for oxidative vs reductive reaction of the same redox couple are chemically distinct.
We would like to emphasize that ‘microscopic irreversibility’ is not unique to heterogeneous (electro)catalysts. In fact, many enzymatic active sites, metallocofactors, and active site cascades exhibit bidirectional, but irreversible, electrocatalytic behavior. ?−? ? ? ? In many of these cases, proton/electron transfer (PT/ET) pathways are altered at the reduced vs oxidized state. In other words, H^+^’s and e^–^’s hop to different sites in the reduction vs oxidation reaction. Thus, conceptually, this is analogous to the different pathways described in Scheme above for Ce-MOF-808. We cannot rule out that, on top of the above buffer-node interactions, protons and electrons involved in the redox reaction are transferred to and from different moieties in the reduction vs oxidation reaction. However, if the difference in PT/ET pathways in the redox reactions dominates the kinetic anisotropies, we expect PCET kinetics of Ce-MOF-808 at identical pH but distinct buffers to be similar. However, as shown in FigureC,D, this is not true. Thus, we prefer to claim thermodynamically anisotropic buffer-node interactions to be the primary reason for the observed kinetic anisotropy in PCET kinetics.
The observed pH-dependent PCET kinetics of Ce-MOF-808 are reminiscent of those reported using graphite-conjugated carboxylic acids by Surendranath and co-workers. In this work, they have demonstrated that carboxylic acids conjugated to a graphitic electrode can exhibit k app between >10^4^ and 10 s^–1^, depending on the electrolyte pH;? it is noteworthy that though Ce-MOF-808 is formally an electrical insulator,? the estimated k app values are within the same range as the graphite-conjugated acids. This further suggests that Ce_6_ clusters in close proximity to the FTO surface are responsible for the observed electrochemical behavior.
Returning to the graphite-conjugated carboxylic acid, the k app vs pH trend can be fitted using the Butler–Volmer equation. Though it is tempting to apply this concept to Ce-MOF-808, we emphasize that the Butler–Volmer equation also assumes the principle of microscopic reversibility. Thus, the observed k app vs pH trend should not be explained using the same approach.
We acknowledge that the deviation of α from the ideal value of can be ascribed to many other reasons. In the context of PCET reaction, this deviation is often ascribed to the asynchronous PCET reaction. The proton and electron do not transfer synchronously along the reaction coordinate. There remains controversy on how this phenomenon can be explained quantum-mechanically, and we direct our readers to the following references for more details. ?,?
Specific to heterogeneous systems, the deviation of α is also often ascribed to site heterogeneity and diffusive complications. ?,? We cannot rule out these effects on Ce-MOF-808. Indeed, we have previously demonstrated that Ce_6_ nodes present a distribution in thermodynamics of the PCET reaction (see the last section of the Discussion for more details). Given that the proton source would have to diffuse to Ce_6_ sites near FTO, diffusive complications cannot be ruled out, though the fast current decay in all chronoamperometric curves otherwise suggests minimal diffusive complications.
Despite the complications mentioned above, it is still tempting to claim that at least part of the reason behind the nonideal BEP relationships reported in a wide range of systems may be due to the microscopic irreversibility, like that observed for Ce-MOF-808.
Implications of Electrolyte-Dependent PCET Hopping Kinetics
on (Electro)catalysis
Our findings demonstrate that much like metal oxides, the PCET hopping kinetics within the pores of Ce-MOF-808 are also electrolyte-dependent. This challenges the implicit but common assumption within the MOF-based catalysis field, where a pristine node from crystallographic data is assumed to represent all catalytic motifs. ?,? Instead, at least for Ce-MOF-808 in borate buffer, the borate anions not only can deprotonate the Bro̷nsted acids on the node, but roughly half of the H_3_BO_3_ within the MOF pores likely undergoes coordination with the node, displacing terminal −OH_2_ (vide supra). This reaction is much more endergonic when the node is reduced with 1H^+^/1e^–^. While we demonstrated that these buffer bindings have a relatively small effect on PCET thermodynamics, their effect on PCET hopping kinetics is profound. The implicit assumption of omitting electrolytes is directly related to the difficulty in understanding their exact molecular arrangement at solid–liquid interfaces. We discuss challenges and limitations related to this difficulty below.
Given the drastic change in rate constants, we advocate that electrolyte compositions should be leveraged as another tool to potentially enhance the (electro)catalytic performance of MOFs and other heterogeneous materials. MOFs with redox-active motifs have emerged as candidate materials for electrocatalysts in reactions of H_2_, O_2_, and CO_2_, as well as electrodes for energy-storage devices. ?−? ? ? ? ? ? Often, chemists rely on ‘engineering’ the MOF structure to enhance its electrochemical properties, much like how traditional heterogeneous materials are structurally modified. ?−? ? Given this preconceived notion, we propose the rather significant effect of the electrolyte systems in PCET as additional modulators of heterogeneous (electro)catalysis.
While recently, the effect of electrolytes within the MOF pores on catalysis has gained attention (cf. ?,?,? ), this work is, to the best of our understanding, the first report quantifying the exact effect of electrolytes in PCET hopping kinetics of MOFs.
Limitations Associated
with the Presented Studies
We conclude this Discussion section by outlining the limitations of the presented studies. Limitations specific to ITC measurements and electrochemically derived D app values specific to MOF-based systems can be found in the following references. ?,?,?,?
As noted above, the k app and the D app values presented in this study probe the hopping reaction of protons and electrons within the lattice structure. This is fundamentally distinct from the intrinsic rate constants of a PCET reaction. In other words, the measured k app is related to the initial Ce^3+^O–H bond cleavage, followed by similar bond formation at another location; this can occur on the same or different Ce_6_ nodes. If the intrinsic rate constants of Ce^3+^O–H bond formation/cleavage were to be measured, Ce-MOF-808 would have to be titrated with chemical reductants or oxidants and probe the reaction progress. We have described previously, however, that these titrations were unsuccessful as Ce-MOF-808 decomposed after exposure to these reagents.?
We also have previously demonstrated that the Ce^3+^O–H BDFE of Ce-MOF-808 has a non-negligible distribution.? This may be due to two distinct reasons: proton topologies with intrinsically different BDFEs, or node-linker-node lateral interactions due to the expansion/contraction of Ce cations during the redox reaction (vide supra). From the full-width-half-maximum (fwhm) of the CVs, we concluded that the H-atom adsorption/desorption thermodynamics on Ce-MOF-808 follow the Frumkin isotherm. Thus, the Ce^4+^O/Ce^3+^OH redox potentials are better described using the modified Nernst equation with a linear correction factor, the Frumkin interaction parameter (C; eq). ?,? In this equation, we have used θ to denote fractional surface coverages of H-atoms on electroactive sites, i.e., Ce^3+^OH. Thus, 1 – θ refers to Ce^4+^O. For Ce-MOF-808, C was estimated to be roughly 6 kcal mol^–1^ (or 0.25 eV).?
Kinetic vs thermodynamic relationships using an H-atom donor/acceptor that follows the Frumkin isotherm are challenging. When, for example, E CPE,c is applied to Ce-MOF-808, at the early points, most if not all Ce_6_ nodes are fully oxidized, and thus the effect of Frumkin interaction parameter should be low. However, the Frumkin effect will become more prevalent at larger θ. This may be the reason why, for example, we observed deviation from the linear fits at early time points (see FigureB as an example), though it is hard to decipher when this effect is most prominent. This further complicates the BEP-type analysis, ?,? which, as stated above, is already convoluted due to the buffer-node interaction (vide supra). Together, these complications proved that retaining E CPE large enough to drive all possible reactions and monitoring apparent kinetics is the most adequate method.
We also acknowledge that the computational simulations employed a single, formate-terminated Ce_6_ cluster with buffer molecules under vacuum (with an implicit solvent model included), or at most one H_2_O molecule. In our previous work, the computed and experimentally derived Ce^3+^O–H BDFE were quantitatively similar;? much like molecular species, the addition of 1H^+^/1e^–^ does not cause a significant change to the arrangement of electrolytes surrounding the Ce_6_ cluster within the MOF. Thus, even though the computed model omitted, for example, H_2_O molecules within the MOF pores, the two values quantitatively agreed with each other. For buffer molecules, however, the rearrangement of solvent molecules before and after buffer-node interaction must be more significant.
Explicit computational simulations of multiple H_2_O molecules during electrochemical reactions remain a significant challenge within this field. In fact, this is one of many reasons why the PCET thermodynamics on conventional heterogeneous electrodes is often performed en vacuo,? like that reported here and in our previous reports. ?,?,? This is even more challenging when a microporous environment must be considered. H_2_O molecules confined within a nanosized space form a hydrogen-bonded network that is distinct from the bulk solution. This further induces differences in proton activity, dielectric constants, and many other factors that can influence the PCET reactivity. ?,?,? In fact, to some extent, we have experimentally and computationally demonstrated that [H_2_BO_3_]^−^, which remains deprotonated in bulk solution, likely becomes protonated inside the pores of Ce-MOF-808 (vide supra).
While we acknowledge many challenges that remain to be addressed, this work quantitatively demonstrated that the anisotropic inner-sphere PCET kinetics are intrinsically correlated to the electrolyte composition.
Conclusions
Kinetics of PCET reaction and its hopping within the porous lattice of Ce-MOF-808 were examined through the electrochemically derived D app values. These values are directly correlated to the k app of proton/electron hopping either within one node or between multiple nodes. Our results demonstrated that these values were intimately correlated to the direction of the reaction, as well as electrolyte compositions and pH. ITC and computational simulations that probed the thermodynamics of buffer-node interactions indicated that both the redox states of the node and the buffer identity define the reaction free energy, which leads to the “apparent microscopic irreversibility” in the PCET reaction of Ce-MOF-808.
The PCET kinetics of Ce-MOF-808 were observed to change by orders of magnitude by changing the electrolyte identity and/or the proton activity. This raises questions about the common assumptions within the MOF-based (electro)catalysis field that computational simulations performed in vacuum or with implicit solvent can accurately represent ‘true’ kinetics of the MOF-catalyzed reaction. This is primarily related to the difficulty in treating H_2_O molecules within the MOF pores explicitly, and we have also faced this difficulty in simulating the thermodynamics of buffer-binding in this work. Still, this work sheds light on electrolytes being an important component in designing MOF-based electrochemical/electrocatalytic systems. Currently, our research focus is to explore this buffer-dependent kinetic anisotropy of Ce-MOF-808 in electrocatalytic conversion of small molecules, and to explore other MOFs with Ce and various other metal-oxo clusters.
The electrolyte-dependent PCET kinetics of Ce-MOF-808 implies that kinetic parameters, such as reaction rates in volcano plots, can exhibit significant distribution. We and others have previously demonstrated that thermodynamic parameters like BDFEs on metallic surfaces, metal oxides, metal phosphides, and even MOFs can exhibit a wide distribution. ?,?,?,?,?,? This contradicts the common assumption that BDFEs are single-valued in nature. We elaborate on these findings that kinetic parameters may also not be a single value in nature. We advocate that this distribution in PCET kinetics should be treated as an advantage to tune the activity of electrodes in energy storage and conversion to optimize the reaction kinetics.
These findings also raise questions about whether the observed distribution in PCET kinetics is intrinsic to Ce-MOF-808. Our current research focuses on examining similar PCET kinetics over a wide range of redox-active MOFs, which overall should construct a comprehensive, kinetic vs thermodynamic relationships relevant to energy storage and conversion. This should lay the foundation to revise the preconceived notions of volcano plots, considering that kinetics are single-valued and are electrolyte-independent.
Supplementary Material
The reference list from the paper itself. Each links out to its DOI / PubMed record.
- 1Mayer J. M.Proton-Coupled Electron Transfer: A Reaction Chemist’s View Annu. Rev. Phys. Chem.20045536339010.1146/annurev.physchem.55.091602.09444615117257 · doi ↗ · pubmed ↗
- 2Mayer J. M.Bonds over Electrons: Proton Coupled Electron Transfer at Solid–Solution Interfaces J. Am. Chem. Soc.2023145137050706410.1021/jacs.2c 1021236943755 PMC 10080693 · doi ↗ · pubmed ↗
- 3Nocera D. G.Proton-Coupled Electron Transfer: The Engine of Energy Conversion and Storage J. Am. Chem. Soc.202214431069108110.1021/jacs.1c 1044435023740 · doi ↗ · pubmed ↗
- 4Lewis N. S.Nocera D. G.Powering the planet: Chemical challenges in solar energy utilization Proc. Natl. Acad. Sci. U. S. A.200610343157291573510.1073/pnas.060339510317043226 PMC 1635072 · doi ↗ · pubmed ↗
- 5Bard A. J.Inner-Sphere Heterogeneous Electrode Reactions. Electrocatalysis and Photocatalysis: The Challenge J. Am. Chem. Soc.2010132227559756710.1021/ja 101578 m 20469860 · doi ↗ · pubmed ↗
- 6Bard, A. J. ; Faulkner, L. R. , Electrochemical Methods: Fundamentals and Applications; John Wiley & Sons Inc.: New York, NY, 2001.
- 7Agarwal R. G.Coste S. C.Groff B. D.Heuer A. M.Noh H.Parada G. A.Wise C. F.Nichols E. M.Warren J. J.Mayer J. M.Free Energies of Proton-Coupled Electron Transfer Reagents and Their Applications Chem. Rev.2022122114910.1021/acs.chemrev.1c 0052134928136 PMC 9175307 · doi ↗ · pubmed ↗
- 8Seh Z. W.Kibsgaard J.Dickens C. F.Chorkendorff I.Nørskov J. K.Jaramillo T. F.Combining theory and experiment in electrocatalysis: Insights into materials design Science 20173556321 eaad 499810.1126/science.aad 499828082532 · doi ↗ · pubmed ↗