IGF2BP2 Drives Thyroid Cancer Dedifferentiation Through m6A-Dependent STAT1 mRNA Destabilization
Rui Chen, Yi-xun Li, Wei-lin Lu, Ke-fei Wu, Yu-xin Wang, Zi-wen Wang, Yi-han Li, Hai-yan Yang, Xu Zhang, Liang Shi, Dong Zhou, Ying Wang, Qiang Ding

TL;DR
This study identifies IGF2BP2 as a key driver of thyroid cancer dedifferentiation by destabilizing STAT1 mRNA through m6A modification, offering a potential new therapeutic target.
Contribution
The study reveals a novel mechanism involving IGF2BP2 and m6A-dependent STAT1 mRNA destabilization in thyroid cancer dedifferentiation.
Findings
IGF2BP2 is upregulated in anaplastic thyroid carcinoma and correlates with poor prognosis.
IGF2BP2 promotes cancer stemness and suppresses thyroid differentiation genes.
IGF2BP2 binds m6A-modified STAT1 mRNA, accelerating its decay and driving dedifferentiation.
Abstract
Thyroid cancer is the most common endocrine malignancy globally. While papillary thyroid carcinoma (PTC) typically exhibits favorable prognosis, a subset undergoes dedifferentiation into anaplastic thyroid carcinoma (ATC), an aggressive, treatment-refractory subtype with near-universal lethality. However, the molecular driver of this process remains elusive. In this study, we find that IGF2BP2 is upregulated in ATC and correlates with adverse prognosis. Pseudotime trajectory analysis tracks progressively escalating IGF2BP2 expression throughout dedifferentiation. Functionally, IGF2BP2 promotes proliferation, suppresses thyroid differentiation genes (TSHR, SLC26A4, SLC5A5, TPO, PAX8, FOXE1, and NKX2.1), and enhances cancer stemness. Mechanistically, integrated multi-omics analysis (RNA-seq, RIP-seq, and MeRIP-seq) reveals that IGF2BP2 binds m6A-modified STAT1 mRNA, accelerating its…
Genes, proteins, chemicals, diseases, species, mutations and cell lines named across the full text — each resolved to its canonical identifier and authoritative record.
Click any figure to enlarge with its caption.
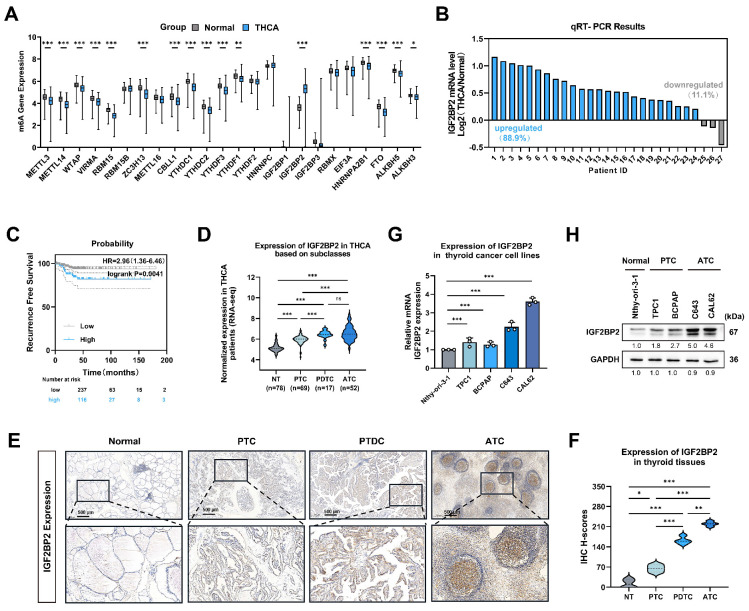 Figure 1
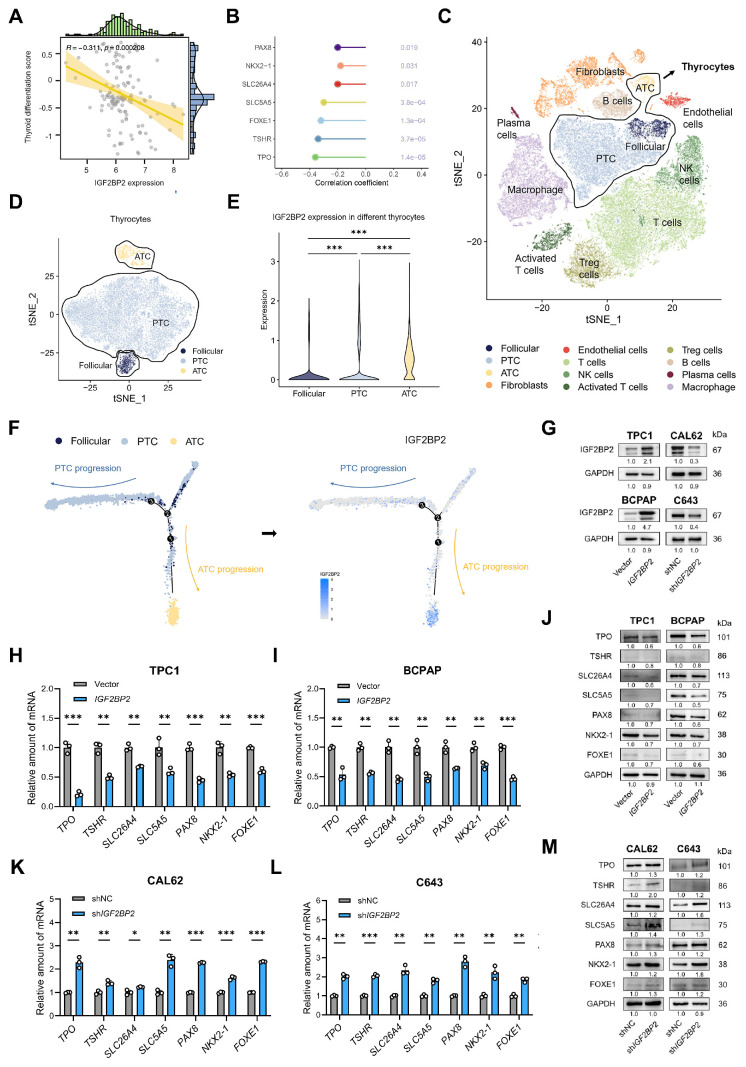 Figure 2
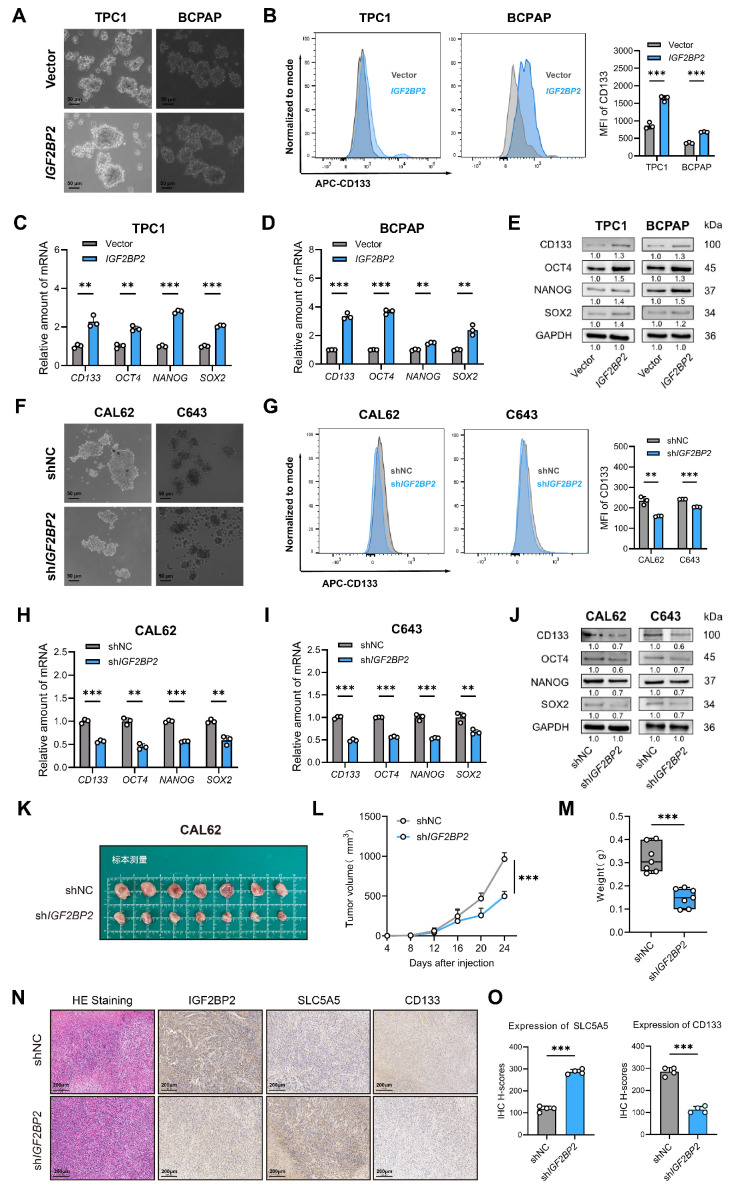 Figure 3
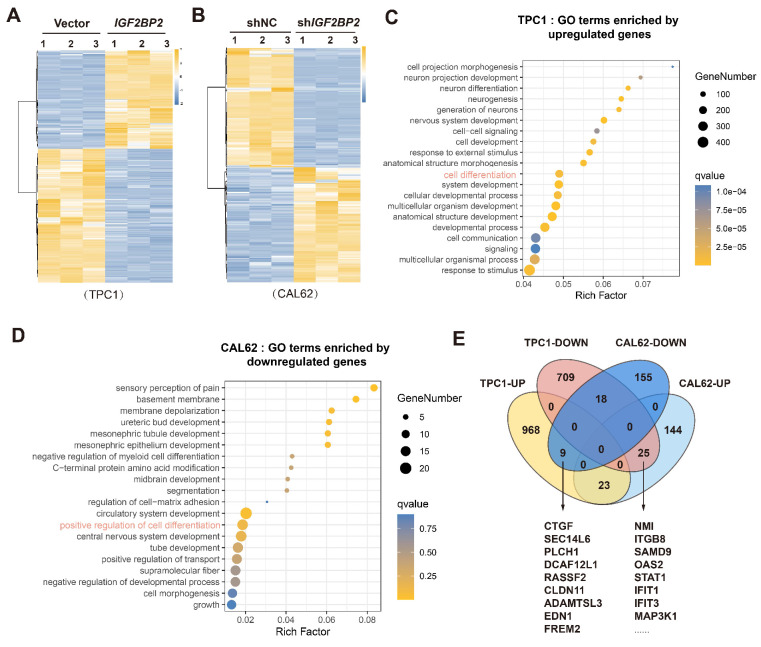 Figure 4
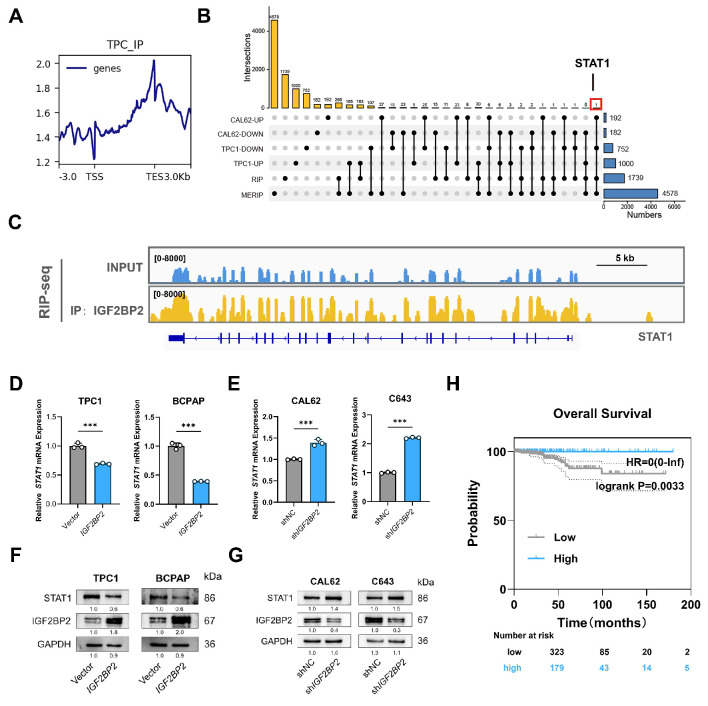 Figure 5
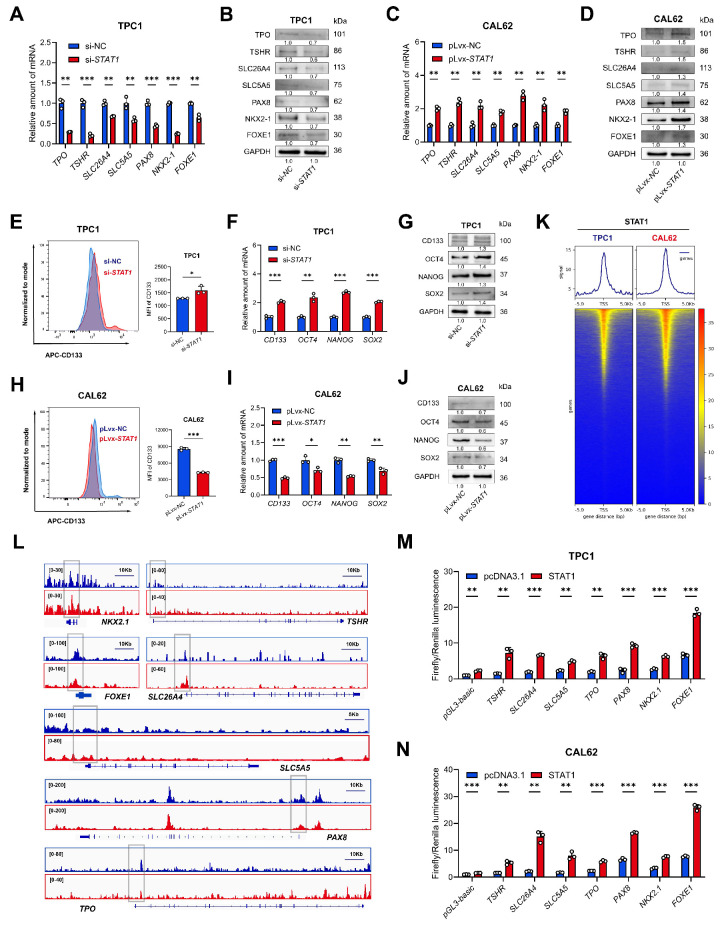 Figure 6
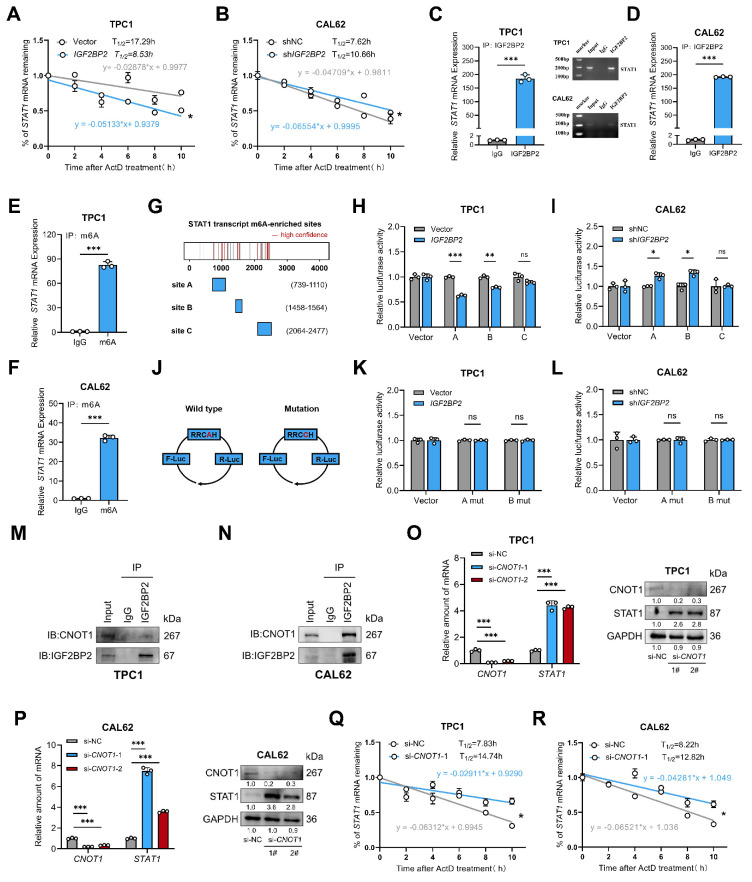 Figure 7
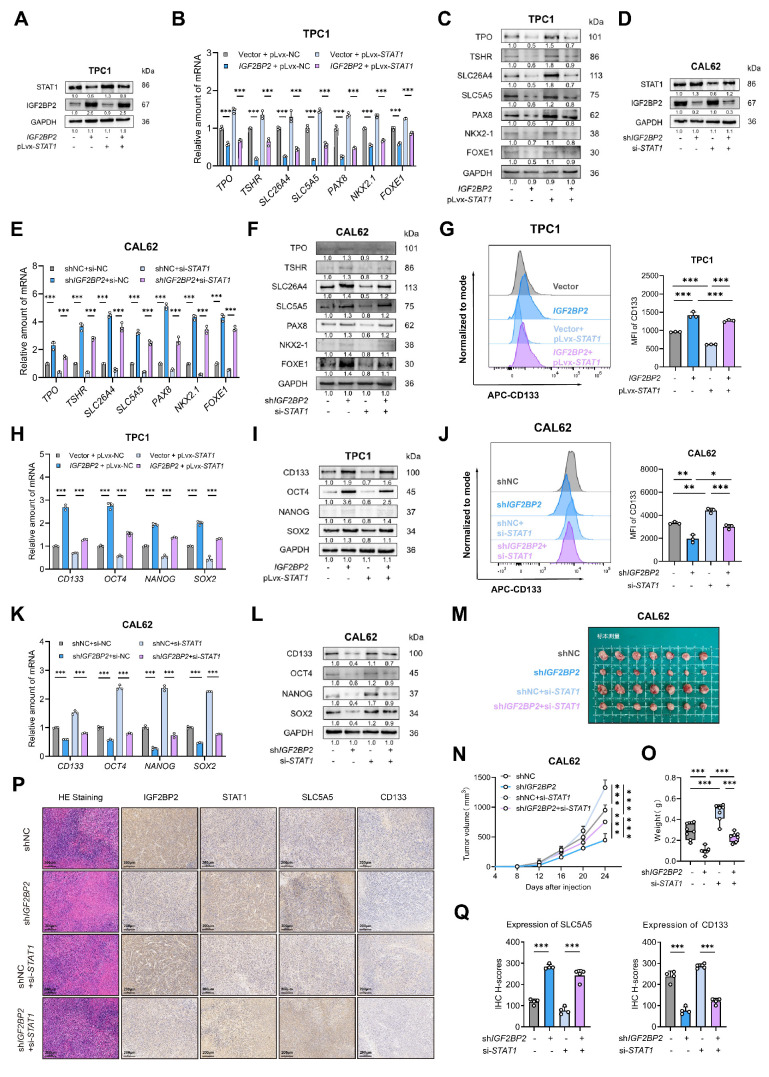 Figure 8
Peer Reviews
No public reviews on file for this paper yet. If you reviewed it on a platform where reviews are public (OpenReview, ICLR, NeurIPS, ICML), you can paste yours below so the community can read it here.
Videos
No videos yet. Explain this paper in a talk, walkthrough, or lecture? Add one.
Taxonomy
TopicsRNA modifications and cancer · Thyroid Cancer Diagnosis and Treatment · Ferroptosis and cancer prognosis
Introduction
Thyroid cancer (THCA), the most prevalent endocrine malignancy globally1, is dominated by papillary thyroid carcinoma (PTC) and typically carries a favorable prognosis2. However, accumulating evidence supports a dedifferentiation continuum model, wherein a subset of PTCs progressively evolves into poorly differentiated thyroid carcinoma (PDTC) and ultimately, the highly aggressive anaplastic thyroid carcinoma (ATC)3-5. This dedifferentiation process, a critical manifestation of tumor plasticity, involves the gradual loss of a differentiated state6,7, quantifiable by the downregulation of thyroid differentiation score (TDS)8 and differentiation markers like TSHR9,10, SLC26A411,* SLC5A5*, TPO, PAX8, FOXE1, and NKX2.112,13. ATC is a rare yet highly lethal subtype characterized by loss of SLC5A5 (NIS) and TSHR expression, rendering it refractory to conventional therapies such as radioactive iodine (RAI) and TSH suppression4,14,15. Therefore, innovative strategies targeting the reversal of dedifferentiation state, or restoration of differentiation in anaplastic cells may circumvent therapeutic barriers, resensitize ATC to cytotoxic agents and ultimately improve survival outcomes.
Unraveling the mechanistic basis of dedifferentiation is paramount for effectively targeting tumor plasticity. Key transcriptional factors (TFs) like CREB3L14, CTCF16, CRSP817, and SETMAR12 have been identified in thyroid cancer as drivers of dedifferentiation events. Beyond transcriptional control, post-transcriptional regulation, exemplified by the dynamic and reversible N6-methyladenosine (m6A) modification, constitutes a crucial layer governing tumor dedifferentiation and stemness18-20. This process is orchestrated by 'writers' (e.g., METTL3/METTL14 complex), 'erasers' (e.g., FTO, ALKBH5), and 'readers' (e.g., YTHDF, HNRNPA1, and IGF2BP proteins). While aberrant m6A signaling has been linked to dedifferentiation and stemness in various cancers21-24, the involvement of this pathway and its key regulators in thyroid cancer dedifferentiation is not well defined and warrant further investigation.
Insulin-like growth factor 2 mRNA-binding protein 2 (IGF2BP2), a conserved oncofetal RNA-binding protein (RBP) and m6A 'reader' 25, recognizes m6A-modified sites on target transcripts to enhance mRNA stability, translation, and subcellular localization. Functioning as an oncogenic driver, IGF2BP2 overexpression is prevalent across multiple cancer types, where it fuels pivotal cancer hallmarks26-30. Recent work from our group further revealed its upregulation and essential role in cell cycle regulation within triple-negative breast cancer (TNBC)31.
Here, we identified IGF2BP2 as a key m6A driver of thyroid cancer dedifferentiation and stemness. Clinical cohort analysis revealed pronounced IGF2BP2 upregulation correlating with dedifferentiation trajectories and adverse patient outcomes. Functionally, IGF2BP2 overexpression in PTC models accelerated dedifferentiation, while its knockdown in ATC systems restored differentiation markers and attenuated stemness-associated phenotypes. Mechanistically, IGF2BP2 exerts its pro-dedifferentiation effects via m6A-dependent destabilization of STAT1 mRNA, suppressing STAT1-mediated transactivation of thyroid differentiation-related genes. This IGF2BP2-STAT1 axis established a direct link between epitranscriptomic regulation and tumor plasticity, nominating a novel therapeutic target for redifferentiation strategies.
Materials and Methods
Human specimens and bioinformatics analysis
For human specimens, 27 pairs of papillary thyroid carcinoma (PTC) and matched adjacent normal tissue were collected at the First Affiliated Hospital of Nanjing Medical University. PTC accounts for ~84 % of all thyroid malignancies, while poorly differentiated (PDTC) and anaplastic (ATC) carcinomas together represent < 6 % and are rarely available as surgically resected paired samples because of their aggressive clinical course. Consequently, all 27 cases in this consecutive series were histopathologically confirmed PTC. The tissues were embedded in paraffin for immunohistochemistry (IHC) staining. Protein expression was semiquantitatively assessed using the H-score (histochemistry score) method. Briefly, the staining intensity was categorized as 0 (negative), 1+ (weak), 2+ (moderate), or 3+ (strong). The percentage of positively stained cells at each intensity level was estimated and multiplied by the corresponding intensity value. The final H-score was calculated using the formula:
H-score = (0×% negative cells) + (1×% weak cells) + (2×% moderate cells) + (3×% strong cells), resulting in a continuous score ranging from 0 to 300. This study was conducted by the ethical standards of Nanjing Medical University, with approval from the Institutional Ethics Committee of the First Affiliated Hospital of Nanjing Medical University (2020-SR-578). Written informed consent was obtained from all participating patients prior to sample collection.
Bulk RNA sequencing datasets were obtained from the The Cancer Genome Atlas (TCGA) and Gene Expression Omnibus (GEO) database. The raw data (GSE29265, GSE65144, GSE76039, and GSE33630) were integrated and preprocessed using R packages, including normalization and batch effect correction. This yielded a final cohort of 216 samples: 52 anaplastic thyroid carcinomas, 69 papillary thyroid carcinomas, 17 poorly differentiated thyroid carcinomas, and 78 normal thyroid tissues. The processed expression matrix was subsequently employed for three analytical objectives: 1 validation of IGF2BP2 expression patterns across histological subtypes, 2 assessment of thyroid differentiation scores, and 3 correlation analysis between IGF2BP2 and established thyroid differentiation-associated genes. The survival information of THCA patients was obtained from the KM plotter (http://www.kmplot.com) and re-analyzed by GraphPad Prism.
Single-cell RNA sequencing data from 7 papillary thyroid carcinomas (PTC, GSE184362) and 5 anaplastic thyroid carcinomas (ATC, GSE148673) were retrieved from the GEO database. Raw counts matrix underwent quality control and preprocessing in Seurat (v5.1.0) using R (v4.4.1). A two-step stringent quality control procedure was implemented: 1 fixed-parameter filtering retaining cells with nFeature-RNA > 500, nCount-RNA > 1000, percent.mt < 20, and percent.ribo < 60; 2 sample-specific dynamic filtering based on median ± 3 median absolute deviations (MAD) for each quality metric per sample. Potential doublets were then identified and removed using DoubletFinder (v2.0.4). Furthermore, we specifically identified and excluded heat-shock responsive cells and stripped-nuclei based on their distinct gene expression signatures. Batch effects across datasets and samples were corrected using harmony (v1.2.0), followed by linear dimensionality reduction with PCA and non-linear reduction and visualization with tSNE. Cell cluster annotation was guided by marker identification from previous studies4 and canonical marker genes for specific subpopulations. To comprehensively identify marker genes for each cell subcluster, we integrated results from both the COSG algorithm (v0.9.0) and Seurat's FindAllMarkers function. Pseudotime trajectories were subsequently reconstructed using Monocle (v2.32.0) to infer developmental processes.
Cell lines and cell culture
The human thyroid follicular epithelial cell line Nthy-ori3-1, PTC cell lines (TPC1, and BCPAP) and ATC cell lines (CAL62, and C643) were procured from the American Type Culture Collection (ATCC, Manassas, VA, USA). The tumor cell lines were cultured in Dulbecco's modified Eagle's medium (Wisent, China) while Nthy-ori3-1 cell was maintained in Roswell Park Memorial Institute 1640 (Wisent, China), collectively supplemented with 10% fetal bovine serum (Wisent, China) and 1% penicillin-streptomycin (Biosharp, China) and incubated in a humid environment with 5% CO_2_ at 37°C.
Lentivirus transfection, small interfering RNA, and plasmids
Produced by GenePharma (Shanghai, China), lentiviral vectors carrying short hairpin RNA targeting IGF2BP2 (shIGF2BP2) and a non-targeting control (shNC) were transfected into TPC1 and CAL62 cells, while CAL62 and C643 were infected with overexpression constructs (IGF2BP2) and matched negative control (Vector). Lentiviruses were transduced for 24 h, and stable cell lines were selected using 3 μg/mL puromycin (MCE, USA, HY-B1743A).
For rescue experiments, small interfering RNAs (siRNAs) targeting STAT1 were synthesized by Tsingke Biotechnology Co., Ltd. (Nanjing, China) and the overexpression plasmids were designed and synthesized by Corues Biotchnology (Nanjing, China). For transfection, 3×10⁵ cells were pre-seeded in six-well plates overnight. Lipofectamine 3000 transfection reagent (Invitrogen, USA) was used following manufacturer protocols. The information of lentiviruses, siRNA and plasmids used in this study is listed in Table S1.
Quantitative RT-PCR (qRT-PCR)
Total RNA was extracted with Trizol reagent (TaKaRa, Japan), followed by cDNA synthesis using HiScript II Q RT SuperMix (Vazyme, China) with 1000 ng RNA. The PCR amplification program was performed on StepOnePlus Real-Time PCR system (Applied Biosystems, USA) using FastStart Universal SYBR Green Master (Roche, Switzerland) according to the manufacturer's instructions. Relative quantification was calculated via 2^-ΔΔCT^ or 2^-ΔCT^ method and normalized based on β-actin. The sequences of specific PCR primers were listed in Table S2.
Western blot
Cells were lysed in RIPA buffer (Beyotime, China, P0013C) containing 1% PMSF, 1% phosphatase inhibitor, and 0.1% protease inhibitor. Cell lysates were resolved by 10% SDS-PAGE gels and transferred to PVDF membranes (Millipore, USA). After blocked with QuickBlock™ Blocking Buffer (Beyotime, China, P0252) for 15min, membranes were incubated with primary antibodies overnight at 4°C and secondary antibodies (1:5000, Cell Signaling Technology, USA, 7074P2) at room temperature for 2 h. The primary antibodies used were as follows: IGF2BP2 (1:1000, Proteintech, China, 11601-1-AP), FOXE1 (1:1000, UpingBio, China, YP-Ab-01724), PAX8 (1:1000, UpingBio, China, YP-Ab-15794), NKX2.1 (1:1000, UpingBio, China, YP-Ab-15626), TSHR (1:1000, UpingBio, China, YP-Ab-07557), TPO, SLC5A5 (1:1000, UpingBio, China, YP-Ab-17263), SLC26A4 (1:1000, UpingBio, China, YP-Ab-07718), CD133 (1:1000, UpingBio, China, YP-Ab-13976), NANOG (1:1000, UpingBio, China, YP-Ab-15732), SOX2 (1:1000, UpingBio, China, YP-Ab-01022), OCT4 (1:1000, UpingBio, China, YP-Ab-15741), STAT1 (1:1000, Proteintech, China, 66545-1-IG), and GAPDH (1:2000, Proteintech, China, 60004-1-IG). GAPDH was used to normalize protein loading. The antibodies were diluted according to the manufacturer's instructions.
Cell counting kit-8 (CCK-8) assay
CCK-8 (Vazyme, China) assays were performed according to the manufacturer's instructions. 500-1000 cells were seeded in a 96-well plate. 10% CCK-8 reagent was added at designated timepoints every day, and then the cells were incubated at 37°C for 2 h away from light. Absorbance at 450 nm was measured using a microplate reader (5082 Grodig, Tecan, Austria).
5-Ethynyl-2′-Deoxyuridine (EdU) assay
Cell proliferation was assessed using EdU Cell Proliferation Kit (Beyotime, China, C0075). Cells (3 × 10^4^/well) in 24-well plates were incubated with 10 μM EdU per well for 2h. Then, these cells were fixed with 4% paraformaldehyde and stained with 1× click reaction buffer and 1× Hoechst 33342 solution. Finally, the cells were detected under the fluorescence microscope (Nikon, Japan) and measured by counting cell numbers in at least 3 random fields.
Sphere formation assay
PTC and ATC cells were resuspended in serum-free RPMI 1640 medium supplemented with B27 (Life Technologies Corporation, USA, 2389253), EGF (SinoBiological, China, 10505-HNAE-100, 20 ng/mL) and bFGF (SinoBiological, China, 10014-HNAE-10, 20 ng/mL). The cells were then seeded in low-adhesion plates (Corning, China, 36421016) and cultured as hanging drops. After 7 days, spheres were collected and their size was measured.
Flow cytometry analysis
After processed for indicated time, tumor cells were digested into single cell suspensions and then stained with APC anti-human CD133 antibody (Biolegend, USA, 397905) for 30 min at room temperature in dark. The stained cells were washed twice with PBS and resuspended at a volume of 100 µL. Samples were analyzed in the BD-FACSCalibur and Cytoflex LX system. FlowJo^TM^ software (version 10.6.2) was used for data analysis.
Animal models
BALB/c nude mice (4-6 weeks) were purchased from GemPharmatech Co., Ltd. (Nanjing, China) and randomly assigned to the four groups. 1×10^7^ CAL62 cells were injected subcutaneously into each group of mice. Tumor volume (mm³) was recorded every 4 days and calculated as (length × width²)/2. After 4 weeks, the tumor tissues of sacrificed mice were collected for subsequent analysis. The animal experiments performed in this study were approved by the Ethics Committee of Nanjing Medical University (IACUC-2206017, IACUC-2509040). All procedures were carried out in compliance with the Guide for the Care and Use of Laboratory Animals.
For immunohistochemistry (IHC) staining, collected tumor tissues were first fixed in 10% neutral buffered formalin, then embedded in paraffin and sectioned. IHC staining was performed to detect the expression of the differentiation marker SLC5A5 and the stemness marker CD133. The protein expression levels of these markers were semi-quantitatively evaluated using the IHC score.
mRNA high-throughput sequencing
Total RNA from stable* IGF2BP2* overexpression TPC1 cells and knockdown CAL62 cells and respective control cells was isolated by TRIzol reagent (Takara, Japan). Quantified by NanoDrop 2000 (Thermo Fisher, USA), 3 μg of RNAs were selected and performed to construct the library with the RNA Sample Pre Kit. Raw data were aligned to hg38 using STAR v2.7.10a. The library construction and next generation sequencing (NGS) were conducted by Sangon Biotech (Shanghai, China).
RNA immunoprecipitation (RIP) and RIP sequencing
The RIP assay was conducted using the Magna RIP Kit (Millipore, USA) according to the manufacturer's instructions. Briefly, cells were lysed with RIP Buffer supplemented with RNase and protease inhibitors and immunoprecipitated with 5 μg of anti-IGF2BP2 antibody (Proteintech, China, 11601-1-AP) or rabbit IgG (Beyotime, China, A7016) on a 4 °C rocker overnight. Antibody-antigen complexes were then conjugated to Protein A/G Magnetic Beads (Thermo Fisher, USA, 10006D) at 37 °C for 2 h. Following ten washes with RIP buffer, the immunoprecipitated RNA-protein complexes were eluted and isolated with TRIzol reagent (Takara, Japan). Equal mRNA input (500 ng) was used for reverse transcription, qPCR Cq difference (ΔCq = 3.1) reflects template abundance difference only. To visualize PCR products, 10 µL (TPC1) or 5 µL (CAL62) of reaction was loaded on 1.5 % agarose. Bar graphs show within-line IP/IgG ratios. For RIP-sequencing, the co-precipitated mRNA fragment was concentrated for RNA-seq library construction and conducted on the Illumina Hiseq 4000 platform by Personalbio (Shanghai, China).
CUT&Tag
The CUT&Tag assay was conducted using the NovoNGS® CUT&Tag 4.0 High-Sensitivity Kit for Illumina (Novoprotein, China, N259-YH01) according to the manufacturer's protocols. A total of 1×10^5^ cells were prepared for each sample. Cells were fixed with 1% formaldehyde, permeabilized with 0.2% Digitonin, and incubated with ConA magnetic beads (Novoprotein) for chromatin coupling. Anti-STAT1 primary antibodies (Cell Signaling Technology, USA,14994T) were diluted in antibody buffer (1% BSA, protease inhibitors) and incubated overnight at 4 °C, followed by species-matched secondary antibodies (ChiTag Goat anit-Rabbit IgG antibody, N269) conjugated to Protein A/G (1:500, Thermo Fisher, USA). The ChiTag® pAG-Transposome complex (Novoprotein) was introduced for targeted DNA fragmentation and Illumina adapter ligation in Tagmentation Buffer (0.7 M MgCl₂, 37 °C, 1 h). Reactions were terminated with Stop Buffer, treated with Proteinase K, and purified using AMPure XP beads. Libraries were amplified via PCR (KAPA HiFi HotStart ReadyMix, 12-18 cycles), size-selected with NovoNGS DNA Clean Beads, and quantified using Qubit 4.0 (Thermo Fisher, USA) and an Agilent 2100 Bioanalyzer. DNA integrity was verified by 1.5% agarose gel electrophoresis. Final libraries were sequenced on an Illumina NovaSeq 6000 platform (150-bp paired-end reads) by Personalbio (Shanghai, China).
Methylated RNA immunoprecipitation (MeRIP) followed by qPCR
Total RNA was isolated using Trizol reagent (TaKaRa, Japan) and fragmented into about 100 nt length verified by 1.5% agarose gel electrophoresis. Then the RNA fragments were immunoprecipitated with m6A antibody (Anti-N6-methyladenosine, Abcam, UK, ab208577) or isotype-matched murine IgG control (Beyotime, China, A7028) in IP buffer (50 mM Tris-HCl pH 7.4, 150 mM NaCl, 1% NP-40) at 4 °C for 2 h. Antibody-RNA complexes were captured by Protein A/G Magnetic Beads (Thermo Fisher, USA, 10006D) through 1 h incubation at 25 °C, followed by five washes with high-salt buffer (50 mM Tris-HCl pH 7.4, 1 M NaCl, 1% NP-40). Immunoprecipitated RNA was eluted using Proteinase K digestion (Thermo Fisher, China, 25530049) and purified via phenol-chloroform extraction. Enrichment of m6A-modified transcripts was quantified by RT-qPCR with methylation-specific primers. The sequence was deposited in Table S2.
mRNA stability assay
IGF2BP2 overexpression (TPC1) and knockdown (CAL62) cells were seeded into six-well plates overnight and then incubated with 5 μg/mL actinomycin D (ActD) for 0, 2, 4, 6, 8, and 10 h. Then the relative mRNA levels of* STAT1* were determined by qRT-PCR.
Luciferase assay
To determine whether IGF2BP2 binds specific m6A sites within the STAT1 transcript, a dual-luciferase reporter assay was performed. Three RNA fragments (STAT1-A, STAT1-B, and STAT1-C), each containing a high-confidence m6A peak predicted by SRAMP (www.cuilab.cn), were synthesized and cloned downstream of the luciferase stop codon in the pGL3-Basic vector by Corues Biotchnology (Nanjing, China). Mutant constructs (STAT1-A-mut and STAT1-B-mut) with A-to-C substitutions within the RRACH motif were generated to disrupt m6A modification. For transfection, CAL62 and TPC1 cells were seeded in six-well plates at 5×10⁵ cells/well and grown to 50% confluence before transfection with the respective reporter plasmids.
To assess STAT1 transcriptional activity, a panel of dual-luciferase reporter plasmids (pGL3-basic, TSHR-luc, SLC26A4-luc, SLC5A5-luc, TPO-luc, PAX8-luc, FOXE1-luc, and NKX2.1-luc) were constructed by Tsingke Biotechnology (Beijing, China). Wild-type TPC1 and CAL62 cells were co-transfected with these reporter plasmids along with a STAT1 expression vector and a Renilla luciferase control. After 48 hours, whole-cell lysates were collected.
Luciferase activity was measured using the Dual-Glo Luciferase Assay System (Promega) 48 hours post-transfection. Firefly luciferase signals were normalized to Renilla activity and expressed relative to negative controls, following the protocol of the Dual Luciferase Reporter Gene Assay Kit (Beyotime, RG027). Primer sequences used for vector construction are provided in Table S3.
Co-Immunoprecipitation (COIP) assay
COIP was carried out following the manufacturer's protocol (MedChemExpress, USA) with minor modifications. Briefly, human thyroid cancer cells (TPC1 and CAL62) were rinsed twice with ice-cold PBS and lysed in 1 mL of Cell lysis buffer for Western and IP (Beyotime, China, P0013) supplemented with 1% PMSF, 1% phosphatase inhibitor, and 0.1% protease inhibitor. After pre-washing, Protein A/G magnetic beads (Thermo Fisher, USA, 10006D) were used for both preclearance with rabbit IgG (Beyotime, China, A7016) and cell lysate, and for antibody coupling with the specified antibodies, both incubations were performed overnight at 4 °C with gentle mixing. On the following day, the precleared lysate was incubated with the antibody-conjugated beads for 4 h at 4 °C under constant rotation. The immunoprecipitates were collected and washed three times with IP lysis buffer. Proteins were eluted and subjected to Western blot analysis.
Statistical analysis
Statistical analyses were conducted with GraphPad Prism 10.0, with biological replicates (n = 3) represented as mean ± SD. Pearson's correlation coefficient was calculated to assess linear associations between IGF2BP2 and thyroid differentiation gene expression levels. Intergroup differences were analyzed using unpaired Student's t-test (parametric data) or Mann-Whitney U test (nonparametric data). For multi-group comparisons, one-way ANOVA with Tukey's post hoc test was applied. P < 0.05 was considered statistically significant.
Results
IGF2BP2 expression was upregulated in THCA, especially in ATC, indicating a poor prognosis
To investigate the role of 'm6A regulators' in thyroid cancer progression, we analyzed bulk RNA-seq data from 512 thyroid carcinoma (THCA) and 59 normal thyroid tissue samples sourced from TCGA datasets. Among the 'm6A regulators' examined, IGF2BP2 mRNA exhibited the most significant dysregulation compared to normal tissues (Fig. 1A). Consistent with these findings, qRT-PCR analysis of THCA patient samples confirmed significantly elevated IGF2BP2 expression in tumor tissues compared to matched adjacent normal tissues (Fig. 1B).
Using the KM plotter online tool for survival analysis, we found that high IGF2BP2 expression was significantly associated with shorter recurrence-free survival (RFS) (P = 0.0041) (Fig. 1C). Similarly, IGF2BP2 expression was significantly upregulated in undifferentiated and poorly differentiated thyroid carcinomas within the GEO database (Fig. 1D), histological subtypes known for poor survival and treatment resistance. This progressive elevation of IGF2BP2 expression was further validated by immunohistochemistry (IHC) staining, which revealed significantly increased IGF2BP2 levels in PTC, PDTC and ATC compared to normal thyroid tissues (Fig. 1E-F). We next assessed IGF2BP2 relative expression by qRT-PCR in a panel of cell lines: the normal thyroid follicular epithelial cell line (Nthy-ori 3-1), PTC cell lines (TPC1, and BCPAP), and ATC cell lines (C643, and CAL62) (Fig. 1G). Concordant with mRNA levels, Western blotting confirmed correspondingly elevated IGF2BP2 protein levels across these distinct cell lines (Fig. 1H). Thus, these findings establish IGF2BP2 as markedly upregulated in thyroid carcinoma, with highest expression in aggressive subtypes, and significantly associated with poor clinical outcomes.
IGF2BP2 promoted the proliferation, and differentiation courses of THCA
Given the progressively increasing expression levels of IGF2BP2 across normal thyroid, PTC, PDTC, and ATC cell lines and tissues (Fig. 1D-G), we hypothesized that IGF2BP2 may contribute to the dedifferentiation phenotype in thyroid carcinoma. To test this hypothesis, we employed the thyroid differentiation score (TDS)8, a metric integrating the expression of 16 thyroid metabolism and function-associated genes, to assess the differentiation status of tumors from 138 THCA patients within the GEO database. Consistent with our hypothesis, analysis revealed a significant negative correlation between IGF2BP2 expression and TDS (Fig. 2A), indicating that higher IGF2BP2 levels are associated with poorer differentiation. Further interrogation of the GEO database demonstrated significant negative correlations between IGF2BP2 expression and key thyroid differentiation markers, including TPO, TSHR, SLC26A4, SLC5A5, PAX8, FOXE1, and NKX2.1 (Fig. 2B). To delineate the dynamic association of IGF2BP2 with dedifferentiation trajectories, we leveraged single-cell RNA sequencing (scRNA-seq) data (Fig. 2C-D, Fig. S1A). Based on established models of follicular epithelial cell differentiation which bifurcate into PTC-derived PTC cells (pPTC) and ATC-derived PTC cells (aPTC)4, pseudotime trajectory analysis revealed significant enrichment of IGF2BP2 expression specifically along the aPTC differentiation path (Fig. 2E-F).
To directly investigate the functional role of* IGF2BP2* in THCA dedifferentiation, we overexpressed IGF2BP2 in two PTC cell lines (TPC1, and BCPAP) exhibiting relatively low endogenous* IGF2BP2* levels. Conversely, we knocked down IGF2BP2 expression in ATC cell lines (CAL62, and C643) characterized by high IGF2BP2 expression (Fig. 2G, Fig. S1B-C). We first assessed cellular proliferation. CCK-8 assays and EdU staining collectively demonstrated that* IGF2BP2* overexpression promoted PTC cell proliferation Fig. S1D-G), while IGF2BP2 knockdown significantly impaired ATC cell growth (Fig. S1H-K).
Given that cancer progression involves gradual dedifferentiation and acquisition of stem cell-like properties(32, we next evaluated the impact of IGF2BP2 manipulation on differentiation marker expression. qRT-PCR analysis revealed that* IGF2BP2* overexpression in TPC1 and BCPAP cells significantly downregulated the transcriptional levels of TSHR, SLC26A4, SLC5A5, TPO, PAX8, FOXE1, and* NKX2.1* (Fig. 2H-I). Concordantly, Western blotting demonstrated reduced protein levels of these seven differentiation markers (Fig. 2J). Conversely, IGF2BP2 knockdown in CAL62 and C643 cells significantly upregulated the mRNA levels of these differentiation-related molecules (Fig. 2K-L) and increased their protein levels (Fig. 2M). Collectively, these findings uncover that IGF2BP2 expression inversely correlates with thyroid differentiation status in clinical cohorts and directly drives dedifferentiation in vitro, repressing key thyroid-specific markers at both mRNA and protein levels while promoting cellular proliferation.
IGF2BP2 sustained the stemness in thyroid carcinoma
During oncogenesis, differentiated cells undergo phenotypic regression, acquiring primitive progenitor and stem-like features that drive tumor aggressiveness33. Given the observed association between dedifferentiation and enhanced stemness, we hypothesized that IGF2BP2 concurrently promotes cellular dedifferentiation and augments tumor stemness in thyroid carcinoma. Subsequent experimental validation confirmed this association. Given that CD133 is a recognized marker of thyroid cancer stem cells (CSCs)16, we evaluated stemness properties in engineered cell models. Overexpression of* IGF2BP2* notably enhanced the sphere-forming capacity of PTC cell lines, accompanied by a significant increase in both the CD133⁺ cell population and the mean fluorescence intensity (MFI) of CD133 (Fig. 3A-B). In contrast, knockdown of IGF2BP2 markedly impaired spheroid formation and reduced CD133 expression, as evidenced by decreased CD133 MFI in ATC-derived subclones (Fig. 3F-G). Consistent with these findings, qRT-PCR analysis demonstrated that IGF2BP2 overexpression significantly upregulated the mRNA levels of key stemness markers, including CD133, NANOG, OCT4, and SOX2 (Fig. 3C-D). Immunoblot analysis further confirmed the increase in their protein levels (Fig. 3E). Reciprocally, silencing* IGF2BP2* expression led to a significant downregulation of the mRNA levels of these markers (Fig. 3H-I) and reduced their protein levels (Fig. 3J), indicating diminished stemness. To evaluate the functional role of IGF2BP2 in thyroid cancer progression in vivo, we established xenograft models using* IGF2BP2*-knockdown CAL62 cells and control cells. IGF2BP2 inhibition significantly impaired the growth of transplanted tumors in immunodeficient mice (Fig. 3K-M). Immunohistochemical analysis of xenograft tumors revealed that IGF2BP2 knockdown promoted redifferentiation, as evidenced by a concomitant significant increase in the differentiation marker SLC5A5 (NIS) with a marked reduction in the cancer stem cell marker CD133, compared to shNC controls (Fig. 3N-O). Generally, our data highlighted a crucial role for IGF2BP2 in driving both the dedifferentiation program and the maintenance of stemness properties in thyroid carcinoma at both transcriptional and translational levels.
Identification of IGF2BP2 targets mediating thyroid cancer dedifferentiation
To elucidate the mechanism by which IGF2BP2 promotes thyroid cancer dedifferentiation, we performed RNA sequencing (RNA-seq) on TPC1 cells overexpressing IGF2BP2 (TPC1-OE) and CAL62 cells with IGF2BP2 knockdown (CAL62-KD). IGF2BP2 overexpression in TPC1 cells significantly altered the transcriptome, with 1000 genes upregulated and 752 genes downregulated (Fig. 4A). Conversely, IGF2BP2 knockdown in CAL62 cells resulted in significant upregulation of 192 genes and downregulation of 182 genes (Fig. 4B). Gene ontology (GO) analysis of these differentially expressed genes (DEGs) revealed significant enrichment in pathways related to cell differentiation (Fig. 4C-D).
To identify potential downstream effectors of IGF2BP2-driven dedifferentiation, we performed an intersection analysis of the DEGs across these two contrasting thyroid cancer models, TPC1-OE and CAL62-KD. This analysis identified 9 consistently upregulated targets (elevated in TPC1-OE and reduced in CAL62-KD) and 23 consistently downregulated targets (reduced in TPC1-OE and elevated in CAL62-KD) (Fig. 4E). These high-confidence IGF2BP2-regulated genes represented prime candidates mechanistically linking IGF2BP2 to the promotion of dedifferentiation and stemness maintenance in thyroid cancer.
IGF2BP2 suppressed STAT1 expression via m6A modification to promote dedifferentiation
IGF2BP2, an m6A reader known to stabilize mRNAs and enhance translation via its K Homology (KH) domains26. To identify direct IGF2BP2 targets in thyroid cancer, we performed RIP-seq in TPC1 cells, revealing 3377 binding peaks across 1739 genes, predominantly localized near transcription termination sites (TES). Intersection of RIP-seq targets with m6A-modified transcripts (from MERIP-seq data: GSE199205) identified 265 m6A-modified IGF2BP2-bound transcripts. Among these, STAT1 emerged as the sole IGF2BP2 m6A target linked to dedifferentiation (Fig. 5B), with IGF2BP2 binding enrichment visualized in its coding sequence (CDS) region (Fig. 5C). Functional assessment demonstrated that IGF2BP2 overexpression in PTC cells suppressed both STAT1 mRNA and protein levels, while IGF2BP2 knockdown in ATC cells significantly upregulated both STAT1 mRNA level and STAT1 protein level (Fig. 5D-G). Clinically, high STAT1 mRNA expression correlated with significantly longer overall survival in thyroid cancer patients (P=0.0033, Fig. 5H). These data establish STAT1 as a direct m6A-modified target of IGF2BP2 in thyroid cancer cells.
STAT1 transcriptionally activated thyroid differentiation genes
STAT1, recognized as a tumor suppressor and regulator of metabolic processes34, functions as a canonical transcription factor. We hypothesized that STAT1 directly governs differentiation-associated genetic programs, particularly those controlling thyroid-specific metabolism and function. Initial* STAT1* knockdown in TPC1 cells (reducing STAT1 mRNA and protein levels) and overexpression in CAL62 cells (increasing STAT1 mRNA and protein levels) confirmed that STAT1 levels did not affect IGF2BP2 mRNA or protein expression Fig. S2A-C). Subsequent functional assays demonstrated STAT1's tumor-suppressive role: STAT1 knockdown promoted, while overexpression inhibited thyroid cancer cell proliferation (Fig. S2D-I).
Crucially, STAT1 silencing in TPC1 cells significantly downregulated both mRNA and protein levels of key thyroid differentiation genes involved in metabolism and function (Fig. 6A-B). Conversely, STAT1 overexpression in CAL62 cells robustly upregulated both mRNA and protein levels of these genes (Fig. 6C-D). To evaluate the role of STAT1 in stemness regulation, functional assays revealed that STAT1 knockdown increased CD133 membrane expression. Conversely, STAT1 overexpression sharply reduced CD133 levels, as confirmed by flow cytometry (Fig. 6E, H). Concordantly, mRNA levels of CSC markers were inversely correlated with STAT1 mRNA expression, while protein levels of CSC markers were inversely correlated with STAT1 protein expression (Fig. 6F-G, I-J). Collectively, these results established STAT1 as a potent negative regulator of thyroid cancer dedifferentiation and stemness.
To investigate the underlying transcriptional mechanism, we performed CUT&Tag assays (a genome-wide immunotethering technique) using a ChIP-grade STAT1 antibody in TPC1 and CAL62 cells. Genome-wide distribution analysis using deepTools revealed that 31.75% (TPC1) and 33.57% (CAL62) of STAT1 binding peaks were localized within promoter regions (±3 kb from TSS) (Fig. 6K, Fig. S2J-K). Visualization of STAT1 binding signals using the Integrative Genomics Viewer (IGV) detected significant STAT1 enrichment around transcription start sites (TSS) of thyroid differentiation genes in both models (Fig. 6L). Notably, the substantial overlap of STAT1 binding peaks between PTC and ATC cells (Fig. S2L) further supported functional conservation. To determine whether STAT1 directly transactivates the promoters of thyroid differentiation related genes, dual-luciferase reporter assays were carried out using promoter sequence of pGL3-basic, TSHR, SLC26A4, SLC5A5, TPO, PAX8, FOXE1, and NKX2.1. Transient overexpression of STAT1 in TPC1 and CAL62 cells resulted in significant upregulation of luciferase activity, demonstrating the functional enhancement of these promoters by STAT1 (Fig. 6M-N). In summary, these findings demonstrate that STAT1 was directly bound to promoter-proximal regions of differentiation-related genes, positioning it as a master transcriptional regulator of thyroid cell identity.
IGF2BP2 destabilized STAT1 mRNA in an m6A-dependent manner
Having established IGF2BP2 as a negative regulator of STAT1 expression, we next investigated the underlying mechanism. As an m6A reader known to modulate mRNA stability and translation(26, IGF2BP2 may directly interact with STAT1 mRNA. To test this mechanism, control and IGF2BP2 overexpression or knockdown thyroid cancer cells were treated with 5 μg/mL RNA synthesis inhibitors actinomycin (ActD). As expected, the mRNA stability assays revealed that STAT1 mRNA half-life was shortened upon IGF2BP2 overexpression and prolonged following* IGF2BP2* knockdown in CAL62 cells (Fig. 7A-B). Direct binding of IGF2BP2 to STAT1 mRNA in both PTC and ATC cell lines was confirmed by RIP assay, demonstrating the consistency of the IGF2BP2-STAT1 axis across thyroid cancer subtypes (Fig. 7C-D). Furthermore, MeRIP assays verified that the binding of IGF2BP2 to STAT1 mRNA was m6A-dependent (Fig. 7E-F).
To functionally link specific m6A sites to IGF2BP2-mediated regulation, we constructed luciferase reporter plasmids harboring high-confidence m6A motifs (sites A, B, C) within the STAT1 sequence, predicted by SRAMP (www.cuilab.cn), with pGL3 as a negative control (Fig. 7G). Dual-luciferase reporter assays showed that IGF2BP2 overexpression significantly decreased the activity of reporters containing sites A and B (Fig. 7H), whereas IGF2BP2 knockdown in CAL62 cells increased their activity (Fig. 7I). Reporter activity for site C remained unchanged. We further introduced A-to-C mutations within the RRACH motifs of sites A and B to disrupt m6A modification (Fig. 7J). Notably, these mutations abolished the regulatory effects of IGF2BP2. The luciferase activities of the mutant reporters were no longer responsive to IGF2BP2 overexpression in TPC1 cells (Fig. 7K) or to knockdown in CAL62 cells (Fig. 7L). To assess the structural context of the identified m6A sites, we predicted the secondary structure of both the full-length STAT1 mRNA and the corresponding isolated fragments. While some local structural variations were noted between the contexts Fig. S3, our functional luciferase assays demonstrate that the primary sequence of sites A and B is sufficient to confer IGF2BP2-dependent regulation in cells.
Overall, these results demonstrate that IGF2BP2 recognizes m6A modifications (specifically at sites A and B) on STAT1 mRNA, leading to its destabilization and consequently, suppression of STAT1 protein expression.
The CCR4-NOT deadenylase complex, a key mediator of cytoplasmic mRNA decay, promotes RNA degradation by shortening the poly(A) tail to initiate 3′-5′ exonucleolytic decay. Given prior evidence that IGF2BP2 recruits this complex via its scaffold subunit CNOT1 to destabilize target mRNAs like Fzd8 and PR 35,36, we hypothesized that IGF2BP2 employs the same mechanism for STAT1 mRNA. To test this, we first confirmed the specific interaction between IGF2BP2 and CNOT1 by co-immunoprecipitation in TPC1 and CAL62 cells (Fig. 7M-N). Supporting the functional relevance of this interaction, CNOT1 knockdown significantly increased both the mRNA and protein abundance of STAT1 (Fig. 7O-P). Furthermore, CNOT1 knockdown markedly extended the half-life of STAT1 mRNA (Fig. 7Q-R). Collectively, these results demonstrate that IGF2BP2 recruits the CCR4-NOT complex through CNOT1 to facilitate the deadenylation and decay of STAT1 transcripts.
STAT1 replenishment attenuated IGF2BP2-driven loss of differentiation in thyroid cancer models
To determine if STAT1 is the key downstream effector mediating IGF2BP2's pro-dedifferentiation effects, we performed rescue experiments. We overexpressed* STAT1* in IGF2BP2-overexpressing TPC1 cells and knocked down STAT1 in IGF2BP2-depleted CAL62 cells. Transfection efficiency was confirmed at mRNA and protein levels Fig. S4A-B, Fig. 8A,D). IGF2BP2 overexpression promoted the proliferation, suppressed thyroid differentiation markers (at mRNA and protein levels), and enhanced stemness properties (CD133⁺ population and CSC marker expression) in TPC1 cells, concomitant STAT1 overexpression significantly reversed these malignant phenotypes (Fig. 8B-C, G-I, Fig. S4E-G). Likewise, the interfered STAT1 expression effectively counteracted the impact of IGF2BP2 inhibition in CAL62 cells, restoring proliferation (Fig. S4H-J) and validating that STAT1 mediates the function of IGF2BP2 in promoting thyroid cancer dedifferentiation (Fig. 8E-F) and CSCs features (Fig. 8J-L). Additionally, further rescue experiments* in vivo* were conducted. In xenograft models, the impaired tumor growth induced by* IGF2BP2* inhibition could be reinstated by si-STAT1 (Fig. 8M-O). IHC staining of xenograft tumors further verified the rescue effect (Fig. 8P-Q). Taken together, our results showed that STAT1 was a dominant contributor responsible for the pro-dedifferentiation and tumor-promoting effects driven by IGF2BP2 in thyroid cancer.
Discussion
The progression of advanced thyroid cancer is frequently driven by the acquisition of stem-like properties and dedifferentiation, yet the molecular drivers governing this phenotypic plasticity remain elusive. In this study, we identify IGF2BP2 as a master m6A-dependent regulator orchestrating this aggressive phenotypic transition. Integrative analysis of RNA-seq, IGF2BP2 RIP-seq, and m^6^A methylome profiling showed that IGF2BP2 post-transcriptionally silencing STAT1 by binding to m6A-modified sites, thereby accelerating its decay. Notably, we identify STAT1 as a direct transcriptional activator of thyroid differentiation genes (TSHR, SLC26A4, SLC5A5, TPO, PAX8,* FOXE1*, and NKX2.1) through promoter binding, a novel regulatory axis that has not been previously characterized. This IGF2BP2-STAT1 axis critically enforces the loss of stem-like traits and promotes terminal differentiation in thyroid cancer cells.
In the present study, we emphasize the role of IGF2BP2 in facilitating thyroid cancer dedifferentiation and stemness sustaining. The oncogenic role of IGF2BP2 extends beyond THCA, with its overexpression and functional dominance reported in diverse malignancies. In acute myelocytic leukemia (AML), IGF2BP2 maintains the function of human and murine leukemia stem cells (LSCs) via stabilizing PRMT6 mRNA in m^6^A-mediated manner(37. Similarly, IGF2BP2 promotes lung cancer radio-resistance by forming a positive feedback loop with SLC7A5, enhancing its stability and translation through m^6^A modification27. IGF2BP2's pro-tumorigenic role is highly preserved in head and neck squamous cell carcinoma (HNSCC). Yu et al. demonstrated that IGF2BP2 recognizes m^6^A modifications within the coding sequence (CDS) of Slug mRNA, stabilizing its transcript to drive epithelial-mesenchymal transition (EMT) and metastasis28. Extending these findings, Cai et al. reported that IGF2BP2 drives HNSCC tumorigenesis and metastasis through super-enhancer (SE) activation (H3K27Ac/BRD4/MED1) and KLF7-mediated transcriptional co-regulation29.
The pro-tumorigenic function of IGF2BP2 in thyroid cancer has been well documented in multiple studies. Sa et al. reported that IGF2BP2 stabilizes* ERBB2* mRNA in an m6A-dependent manner, thereby conferring radioiodine resistance in PTC 38. Wang et al. demonstrated that it promotes lymph-node metastasis by protecting DPP4 transcripts 39, while Dong et al. showed that IGF2BP2 sustains tumor growth via the lncRNA HAGLR axis 40. These findings indicate that IGF2BP2 drives both proliferation and metastasis in thyroid cancer. Collectively, these studies establish IGF2BP2 as a key oncogenic driver in thyroid cancer, however, they have examined PTC and ATC as separate entities without considering the continuous differentiation spectrum that characterizes thyroid tumors. Mounting evidence has demonstrated that tumors comprise heterogeneous cell populations with diverse differentiation states including a small portion of CSCs alongside a larger number of deferentially differentiated cancer cells32,33. Luo et al. depicted the heterogeneity of THCA from a single-cell perspective, providing direct evidence that ATC cells originate from a small subset of PTC cells4. Expanding on these studies, we proposed that dynamically escalated IGF2BP2 expressions during dedifferentiation might signify its critical regulatory role in this process. Correlation analysis with TDS and pseudotemporal trajectory mapping further supported the assumption. Diverging from conventional approaches that prioritize downstream effectors through database mining or transcriptomic profiling of static differentiation states12,13,16,17, we unpinned 23 genes as conserved downstream targets across differentiation hierarchies by intersecting DEGs from IGF2BP2-overexpressing PTC and IGF2BP2-knockdown ATC models. Multi-omics integration using RNA-seq, RIP-seq, and m6A methylome profiling has identified STAT1 as the direct m6A-dependent target of IGF2BP2.
The dual role of STAT1 in cancer has long been debated, with context-dependent pro- or anti-tumorigenic effects reported across malignancies41-45. While STAT1 is widely recognized as a mediator of interferon (IFN)-driven immune responses and tumor surveillance46, its cell-intrinsic functions in epithelial differentiation programs remain poorly characterized. In this study, prognostic analysis and functional phenotypic experiments across thyroid carcinoma differentiation subtypes revealed a tumor-suppressive role of STAT1. Mechanistically, we demonstrate that STAT1 directly binds to promoters of thyroid differentiation markers (TSHR, SLC26A4, SLC5A5, TPO, PAX8, FOXE1, and NKX2.1) and activates their transcription, thereby restricting stemness and disease progression. This cell-autonomous differentiation-promoting role sharply contrasts with STAT1's reported oncogenic activity in TNBC 47 and nasopharyngeal carcinoma48, where it facilitates chromatin accessibility and transcriptional activation of PDL1 and IDO1. Such functional duality may stem from STAT1's differential post-translational modifications (e.g., phosphorylation vs. acetylation) or chromatin accessibility patterns in distinct tissue contexts.
Limitations of the study
While our study provides critical insights into the IGF2BP2-STAT1 axis in thyroid cancer dedifferentiation and stemness, several limitations warrant acknowledgment. First, although single-cell transcriptomic analysis suggested IGF2BP2's role in driving dynamic dedifferentiation trajectories, experimental validation of its spatiotemporal contributions to this process remains incomplete. The lack of longitudinal models, such as thyroid cancer organoid systems or time-resolved in vivo experiments, limits our ability to mechanistically dissect how IGF2BP2 orchestrates dedifferentiation during tumor evolution phases. Second, while cancer stem-like properties are widely recognized to confer resistance to conventional therapies through mechanisms such as enhanced drug efflux or dormancy, our study did not explore the functional relationship between IGF2BP2-driven stemness and therapeutic outcomes in preclinical models. Third, the genetic backgrounds of the cell models used in this study should be considered. While our functional experiments demonstrated that the pro-dedifferentiation effects of the IGF2BP2-STAT1 axis are consistent across both BRAF wild-type and BRAF V600E mutant PTC models, all ATC models utilized were BRAF wild-type.
Future investigations should incorporate time-resolved studies in genetically engineered animal models or patient-derived systems to 1 dynamically delineate the spatiotemporal role of the IGF2BP2-STAT1 axis in dedifferentiation trajectories , 2 determine whether therapeutic inhibition of this pathway restores differentiation signatures and reverses radioiodine-refractory or drug-tolerant phenotypes and 3 employ BRAF-mutant ATC models, such as patient-derived organoids or rare cell lines, to conclusively determine if this mechanism operates independently of the BRAF oncogenic driver in the most advanced disease state.
Conclusion
In conclusion, our study elucidates a novel thyroid-specific regulatory axis involving IGF2BP2 and STAT1 that drives dedifferentiation and enhances stemness in diverse subtypes of differentiated thyroid cancers. These findings position the IGF2BP2-STAT1 pathway as a central molecular mechanism underlying tumor progression and loss of differentiation, which are critical determinants of therapeutic resistance and poor prognosis in THCA. Therapeutic interventions targeting this axis may be promising to restore differentiation, suppress stem-like properties, and potentially reverse treatment refractoriness in advanced or radioiodine-resistant thyroid malignancies.
Supplementary Material
Supplementary figures and tables.
The reference list from the paper itself. Each links out to its DOI / PubMed record.
- 1Sung H Ferlay J Siegel RL Laversanne M Soerjomataram I Jemal A Global Cancer Statistics 2020: GLOBOCAN Estimates of Incidence and Mortality Worldwide for 36 Cancers in 185 Countries CA A Cancer J Clinicians 2021 May 7132094910.3322/caac.2166033538338 · doi ↗ · pubmed ↗
- 2Chen DW Lang BHH Mc Leod DSA Newbold K Haymart MR Thyroid cancer The Lancet 2023 May 4011038715314410.1016/S 0140-6736(23)00020-X 37023783 · doi ↗ · pubmed ↗
- 3Landa I Ibrahimpasic T Boucai L Sinha R Knauf JA Shah RH Genomic and transcriptomic hallmarks of poorly differentiated and anaplastic thyroid cancers Journal of Clinical Investigation 2016 Feb 1512631052662687817310.1172/JCI 85271 PMC 4767360 · doi ↗ · pubmed ↗
- 4Luo H Xia X Kim GD Liu Y Xue Z Zhang L Characterizing dedifferentiation of thyroid cancer by integrated analysis Sci Adv 2021 Jul 30731 eabf 36573432119710.1126/sciadv.abf 3657 PMC 8318367 · doi ↗ · pubmed ↗
- 5Molinaro E Romei C Biagini A Sabini E Agate L Mazzeo S Anaplastic thyroid carcinoma: from clinicopathology to genetics and advanced therapies Nat Rev Endocrinol 2017 Nov 1311644602870767910.1038/nrendo.2017.76 · doi ↗ · pubmed ↗
- 6Li J Stanger BZ How Tumor Cell Dedifferentiation Drives Immune Evasion and Resistance to Immunotherapy Cancer Research 2020 Oct 180194037413255455210.1158/0008-5472.CAN-20-1420 PMC 7541560 · doi ↗ · pubmed ↗
- 7Bernabé-Rubio M Ali S Bhosale PG Goss G Mobasseri SA Tapia-Rojo R Myc-dependent dedifferentiation of Gata 6+ epidermal cells resembles reversal of terminal differentiation Nat Cell Biol 2023 Oct 25101426383773559810.1038/s 41556-023-01234-5PMC 10567550 · doi ↗ · pubmed ↗
- 8Agrawal N Akbani R Aksoy BA Ally A Arachchi H Asa SL Integrated Genomic Characterization of Papillary Thyroid Carcinoma Cell 2014 Oct 1593676902541711410.1016/j.cell.2014.09.050PMC 4243044 · doi ↗ · pubmed ↗