Effect of Preserved Versus Preservative‐Free Artificial Tears on the Corneal Epithelial Thickness Mapping by MS‐39 in Dry Eye Patients
Ghada A. Nassar, Ahmed Rashad Ashor, Mohamed Hosny, Jorge Alio, Aliaa A. Farag

TL;DR
This study compares preservative and preservative-free artificial tears in dry eye patients, finding that preservative-free tears improve corneal thickness and symptoms more effectively.
Contribution
The study demonstrates that preservative-free artificial tears are superior to preserved ones in improving corneal epithelial thickness and dry eye symptoms.
Findings
Both types of artificial tears improved dry eye symptoms and corneal epithelial thickness.
Preservative-free tears showed greater improvement in OSDI scores and epithelial thickness in specific corneal areas.
Preservative-free artificial tears are a safer option for long-term use.
Abstract
To compare clinical and corneal epithelial changes between preservative and preservative‐free artificial tear therapy using the MS‐39 in patients with dry eye disease (DED). This prospective interventional comparative study included 88 eyes of 44 patients. Preserved artificial tears were given for the left eye (group A) and preservative‐free artificial tears for the right eye (group B). They were evaluated before and 3 months after treatment using MS‐39. The dry eye parameters and corneal epithelial thickness were recorded. There was an increase in the NIBUT and improvement in the severity by OSDI score (p-value < 0.001) in each group. There was no significant difference in the mean NIBUT between the two groups (p-value = 0.470). Improvement in the OSDI score (p-value = 0.026) and mean post‐treatment epithelial thickness in the central, paracentral superior, and peripheral inferior…
Genes, proteins, chemicals, diseases, species, mutations and cell lines named across the full text — each resolved to its canonical identifier and authoritative record.
Click any figure to enlarge with its caption.
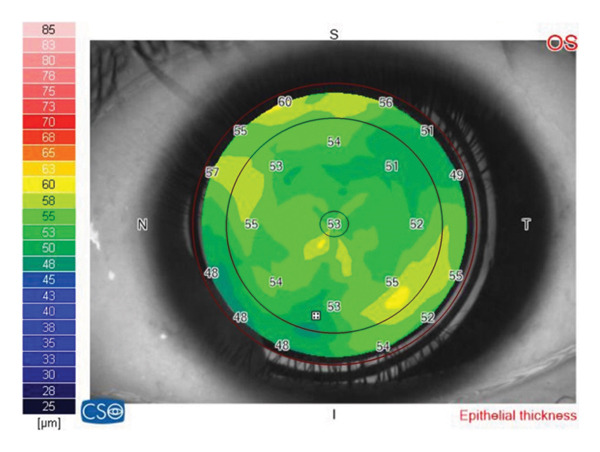 Figure 1
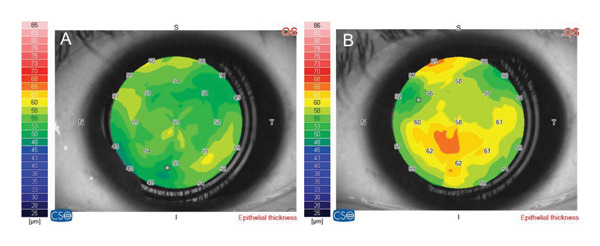 Figure 2
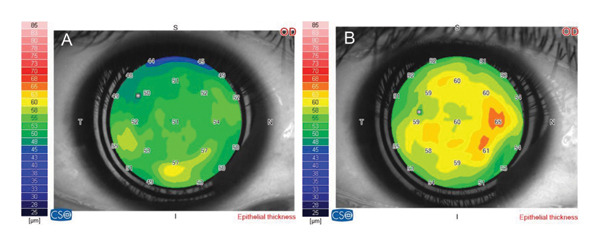 Figure 3
| Parameters | Group A | Group B | Difference (left minus right) |
|
|---|---|---|---|---|
| OSDI | 50.12 ± 17.73 | 50.07 ± 17.72 | 0.05 ± 0.31 | 0.323 |
| BUT/sec | 10.91 ± 2.89 | 11.67 ± 2.9 | −0.77 ± 2.7 | 0.107 |
| K1 | 43.35 ± 1.77 | 43.64 ± 1.45 | −0.29 ± 1.38 | 0.364 |
| K2 | 44.22 ± 1.85 | 44.43 ± 1.53 | −0.2 ± 1.32 | 0.666 |
| CCT | 532.35 ± 35.45 | 531.4 ± 29.28 | 0.95 ± 19.4 | 0.749 |
| Anterior elevation | 9.98 ± 4.13 | 9.95 ± 4.57 | 0.02 ± 3.53 | 0.897 |
| Posterior elevation | −19.91 ± 5.89 | −18.95 ± 6.58 | −0.95 ± 5.39 | 0.234 |
| Central | 52.58 ± 3.27 | 52.67 ± 3.62 | −0.09 ± 2.85 | 0.630 |
| Mean paracentral | 51.15 ± 3.21 | 50.56 ± 3.35 | 0.59 ± 2.43 | 0.120 |
| Paracentral superior | 48.91 ± 3.49 | 48.05 ± 4.04 | 0.86 ± 4.58 | 0.224 |
| Paracentral inferior | 52.53 ± 5.03 | 52.28 ± 4.22 | 0.26 ± 3.86 | 0.666 |
| Paracentral nasal | 51.65 ± 3.65 | 51.3 ± 3.97 | 0.35 ± 3.24 | 0.485 |
| Paracentral temporal | 51.51 ± 3.79 | 50.63 ± 4.34 | 0.88 ± 3.74 | 0.128 |
| Peripheral superior | 45.63 ± 4.95 | 43.6 ± 5.82 | 2.02 ± 5.04∗ | 0.005∗ |
| Peripheral inferior | 49.65 ± 5.43 | 48.53 ± 4.82 | 1.12 ± 5.43 | 0.340 |
| Peripheral nasal | 51.81 ± 4.33 | 49.91 ± 4.91 | 1.91 ± 4.67∗ | 0.011∗ |
| Peripheral temporal | 49.53 ± 4.01 | 48.49 ± 4.67 | 1.05 ± 5.09 | 0.185 |
| Parameters | Group A | Group B | Difference (left minus right) |
|
|---|---|---|---|---|
| OSDI | 31.58 ± 13.22 | 30.76 ± 12.63 | 0.82 ± 2.34∗ | 0.026∗ |
| BUT/sec | 12.88 ± 2.91 | 13 ± 2.91 | −0.12 ± 2.01 | 0.470 |
| K1 | 43.49 ± 1.65 | 43.68 ± 1.42 | −0.19 ± 1.23 | 0.88 |
| K2 | 44.43 ± 1.75 | 44.5 ± 1.5 | −0.07 ± 1.14 | 0.690 |
| CCT | 533.95 ± 35.97 | 534.65 ± 30.99 | −0.7 ± 20.18 | 0.822 |
| Anterior elevation | 9.7 ± 3.99 | 9.91 ± 4.13 | −0.21 ± 3.87 | 0.651 |
| Posterior elevation | −18.95 ± 5.32 | −18.7 ± 6.72 | −0.26 ± 5.56 | 0.913 |
| Central | 53.77 ± 3.77 | 54.79 ± 4.22 | −1.02 ± 3.05∗ | 0.033∗ |
| Mean paracentral | 52.32 ± 3.65 | 53.11 ± 3.29 | −0.78 ± 2.61 | 0.056 |
| Paracentral superior | 49.3 ± 3.54 | 50.58 ± 4.04 | −1.28 ± 3.83∗ | 0.034∗ |
| Paracentral inferior | 53.98 ± 5.04 | 54.53 ± 4.19 | −0.56 ± 3.76 | 0.336 |
| Paracentral nasal | 53.47 ± 4.43 | 54.26 ± 4.25 | −0.79 ± 3.78 | 0.178 |
| Paracentral temporal | 52.56 ± 4.33 | 53.07 ± 4.03 | −0.51 ± 4.65 | 0.475 |
| Peripheral superior | 47.28 ± 5.76 | 47.42 ± 6.15 | −0.14 ± 6.23 | 0.990 |
| Peripheral inferior | 50.37 ± 5.12 | 51.95 ± 5.15 | −1.58 ± 5.32∗ | 0.023∗ |
| Peripheral nasal | 53.58 ± 4.72 | 53.49 ± 5.52 | 0.09 ± 4.97 | 0.604 |
| Peripheral temporal | 51.09 ± 4.09 | 51.67 ± 4.68 | −0.58 ± 5.06 | 0.456 |
| Parameters | Pretreatment | Post‐treatment | Difference (pre‐ minus post‐treatment) |
|
|---|---|---|---|---|
| OSDI | 50.12 ± 17.73 | 31.58 ± 13.22 | 18.54 ± 14.71∗ | < 0.001∗ |
| BUT/sec | 10.91 ± 2.89 | 12.88 ± 2.91 | −1.98 ± 2.39∗ | < 0.001∗ |
| K1 | 43.35 ± 1.77 | 43.49 ± 1.65 | −0.14 ± 0.49 | 0.175 |
| K2 | 44.22 ± 1.85 | 44.43 ± 1.75 | −0.21 ± 0.54∗ | < 0.001∗ |
| CCT | 532.35 ± 35.45 | 533.95 ± 35.97 | −1.61 ± 3.8∗ | 0.008∗ |
| Anterior elevation | 9.98 ± 4.13 | 9.7 ± 3.99 | 0.28 ± 1.86 | 0.330 |
| Posterior elevation | −19.91 ± 5.89 | −18.95 ± 5.32 | −0.95 ± 2.87∗ | 0.035∗ |
| Central | 52.58 ± 3.28 | 53.77 ± 3.77 | −1.19 ± 1.64∗ | < 0.001∗ |
| Mean paracentral | 51.15 ± 3.21 | 52.33 ± 3.65 | −1.17 ± 1.84∗ | < 0.001∗ |
| Paracentral superior | 48.91 ± 3.49 | 49.3 ± 3.54 | −0.4 ± 2.94 | 0.382 |
| Paracentral inferior | 52.53 ± 5.03 | 53.98 ± 5.04 | −1.44 ± 2.79∗ | 0.002∗ |
| Paracentral nasal | 51.65 ± 3.65 | 53.47 ± 4.43 | −1.81 ± 2.25∗ | < 0.001∗ |
| Paracentral temporal | 51.51 ± 3.79 | 52.56 ± 4.33 | −1.05 ± 2.78∗ | 0.018∗ |
| Peripheral superior | 45.63 ± 4.95 | 47.28 ± 5.76 | −1.65 ± 3.86∗ | 0.006∗ |
| Peripheral inferior | 49.65 ± 5.43 | 50.37 ± 5.12 | −0.72 ± 3.02 | 0.096 |
| Peripheral nasal | 51.81 ± 4.33 | 53.58 ± 4.72 | −1.77 ± 3.41∗ | 0.001∗ |
| Peripheral temporal | 49.53 ± 4.01 | 51.09 ± 4.09 | −1.56 ± 2.5∗ | < 0.001∗ |
| Parameters | Pretreatment | Post‐treatment | Difference (pre‐ minus post‐treatment) |
|
|---|---|---|---|---|
| OSDI | 50.07 ± 17.72 | 30.76 ± 12.63 | 19.32 ± 14.76∗ | < 0.001∗ |
| BUT/sec | 11.67 ± 2.9 | 13 ± 2.91 | −1.33 ± 2.18∗ | < 0.001∗ |
| K1 | 43.64 ± 1.45 | 43.68 ± 1.42 | −0.04 ± 0.32 | 0.270 |
| K2 | 44.43 ± 1.53 | 44.5 ± 1.5 | −0.07 ± 0.31 | 0.224 |
| CCT | 531.4 ± 29.28 | 534.65 ± 31 | −3.26 ± 6.87∗ | 0.003∗ |
| Anterior elevation | 9.95 ± 4.57 | 9.91 ± 4.13 | 0.05 ± 2.09 | 0.896 |
| Posterior elevation | −18.95 ± 6.58 | −18.7 ± 6.72 | −0.26 ± 2.88 | 0.429 |
| Central | 52.67 ± 3.62 | 54.79 ± 4.22 | −2.12 ± 2.11∗ | < 0.001∗ |
| Mean paracentral | 50.56 ± 3.35 | 53.11 ± 3.29 | −2.55 ± 2.23∗ | < 0.001∗ |
| Paracentral superior | 48.05 ± 4.04 | 50.58 ± 4.04 | −2.54 ± 3.57∗ | < 0.001∗ |
| Paracentral inferior | 52.28 ± 4.22 | 54.53 ± 4.19 | −2.26 ± 2.36∗ | < 0.001∗ |
| Paracentral nasal | 51.3 ± 3.97 | 54.26 ± 4.25 | −2.95 ± 3.00∗ | < 0.001∗ |
| Paracentral temporal | 50.63 ± 4.34 | 53.07 ± 4.03 | −2.44 ± 3.03∗ | < 0.001∗ |
| Peripheral superior | 43.6 ± 5.82 | 47.42 ± 6.15 | −3.81 ± 3.16∗ | < 0.001∗ |
| Peripheral inferior | 48.53 ± 4.82 | 51.95 ± 5.15 | −3.42 ± 4.51∗ | < 0.001∗ |
| Peripheral nasal | 49.91 ± 4.91 | 53.49 ± 5.52 | −3.58 ± 3.64∗ | < 0.001∗ |
| Peripheral temporal | 48.49 ± 4.67 | 51.67 ± 4.68 | −3.19 ± 3.63∗ | < 0.001∗ |
| Group A | Group B | ||
|---|---|---|---|
| Central |
| 0.218 | 0.327 |
|
| 0.159 | 0.032∗ | |
| Paracentral superior |
| 0.082 | 0.314 |
|
| 0.599 | 0.040∗ | |
| Paracentral inferior |
| −0.092 | 0.080 |
|
| 0.556 | 0.608 | |
| Paracentral nasal |
| 0.173 | 0.186 |
|
| 0.269 | 0.233 | |
| Paracentral temporal |
| 0.134 | 0.099 |
|
| 0.390 | 0.526 | |
| Peripheral superior |
| 0.177 | 0.170 |
|
| 0.255 | 0.276 | |
| Peripheral inferior |
| −0.025 | 0.019 |
|
| 0.876 | 0.902 | |
| Peripheral nasal |
| 0.337∗ | 0.058 |
|
| 0.027 | 0.711 | |
| Peripheral temporal |
| −0.026 | −0.076 |
|
| 0.867 | 0.626 |
Peer Reviews
No public reviews on file for this paper yet. If you reviewed it on a platform where reviews are public (OpenReview, ICLR, NeurIPS, ICML), you can paste yours below so the community can read it here.
Videos
No videos yet. Explain this paper in a talk, walkthrough, or lecture? Add one.
Taxonomy
TopicsOcular Surface and Contact Lens · Corneal Surgery and Treatments · Ocular Infections and Treatments
1. Introduction
Dry eye disease (DED) is a multifactorial pathology that leads to ocular surface inflammation, tear film instability, and tear hyperosmolarity. Inflammation causes injury to the conjunctival and corneal epithelial cells. Damage to corneal epithelium and nerves may cause symptoms of DED, such as ocular discomfort, dryness, and visual disturbance [1–4].
The diagnosis of DED is based on multiple tests, including the subjective symptoms, visual acuity, tear break‐up time (TBUT), tear osmolarity, tear volume, tear film composition, kerato‐conjunctival vital staining, and ocular biomarkers [5, 6].
Anterior segment optical coherence tomography (AS‐OCT) is a noninvasive imaging method with high‐resolution analysis. AS‐OCT has been preferred in several studies for evaluating corneal epithelium because of its great reliability and repeatability [7, 8].
Owing to the importance of epithelial thickness in the modern evolution of the cornea, different studies have evaluated the epithelial thickness mapping as a valuable marker in the diagnosis, management, and follow‐up of the regenerative process of the corneal epithelial profile in different diseases [9–11].
MS‐39, a unique high‐definition spectral domain AS‐OCT, is a standalone device that uses SD‐OCT and Placido‐disk corneal topography to obtain measurements of the anterior segment of the eye that provides the corneal thickness and epithelial thickness map [12]. Knowledge of the epithelial morphology is useful to assess abnormalities of the ocular surface diseases (OSD) [13, 14].
Artificial tears are used as the first choice in the treatment of DED. They act by promoting corneal epithelial healing, increasing central and peripheral epithelial thickness, and increasing re‐epithelialization of corneal epithelium [15, 16]. However, preservatives may exacerbate ocular inflammation. The most common preservatives are benzalkonium chloride (BAK), chlorobutanol, sodium perborate, thiomersal, and disodium edetate. These preservatives may cause toxic epithelial effect and hypersensitivity reactions, which range from mild irritation to severe corneal scarring [17]. Preservative‐free lubricants could prevent these effects. So, they are indicated for severe dry eye, when higher doses of lubricants are necessary [18].
By reviewing the literature, the effect of preservatives on the corneal epithelial thickness (CET) using MS‐39 in DED has not been fully studied. In our study, we aimed to compare the effect of preserved versus preservative‐free artificial tear therapy on the CET mapping by MS‐39 in patients with DED and correlate the different parameters with visual acuity, symptoms, and signs of DED including noninvasive break‐up time (NIBUT) and Ocular Surface Disease Index (OSDI).
2. Materials and Methods
This prospective interventional comparative case series study was performed at the International Femto‐Lasik Center in collaboration with the Ophthalmology Department, Cairo University Hospital, between May 2022 and April 2023. It was approved by the Research Ethics Committee of the Faculty of Medicine, Cairo University, and was conducted in compliance with the principles of the Helsinki Declaration.
All patients signed a written informed consent to participate in the study and for publication of data.
2.1. Inclusion Criteria Included
Newly diagnosed as DED.
Patients not receiving any medications for at least 3 months.
Age ranged from 18 to 70 years.
Patients with the NIBUT less than 12 s, and meibomian gland dysfunction (MGD) of different degrees.
2.2. Exclusion Criteria Included
Patients with corneal dystrophy, corneal degenerations, or any corneal opacity.
Corneal diseases, such as herpetic keratitis, or OSD, such as ocular cicatricial pemphigoid.
Contact lens wearers.
Keratoconus patients.
Chronic use of preservative‐containing eye drops.
Eyelid disorders.
Previous surgeries especially refractive, ptosis, or eyelid surgery.
Any media opacity, which could prevent high‐quality imaging.
History of diabetes, uveitis, or glaucoma.
Eighty‐eight eyes of 44 patients with DED of various levels of severity. All patients were newly diagnosed as DED. Both eyes of the same patient were compared, and the eyes were divided into two groups.
- •Group A: 44 eyes (left eye) receiving preservative artificial tears (hydroxypropyl methylcellulose 3 mg preserved with sodium perborate tetrahydrate—Tears Guard, Orchidia Pharma, Cairo, Egypt) in multidose bottles 5 times daily.
- •Group B: 44 eyes (right eye) receiving preservative‐free artificial tears (hypromellose 1.6 mg/0.5 mL—Optilubric, EVA Pharma, Cairo, Egypt) in single‐dose units 5 times daily.
2.2.1. Pretreatment Evaluation
All included patients underwent full ophthalmological examination, including best‐corrected visual acuity (BCVA) in decimal, anterior segment examination, intraocular pressure (IOP) by Goldmann applanation tonometry, NIBUT, and eyelid examination for MGD.
The OSDI score was calculated by the following formula:
OSDI = [(sum of scores for all questions answered) x 100]/[(total number of questions answered) x 4]. The higher the score, the greater the disability.
Based on their OSDI scores, patients can be categorized as having a normal ocular surface (0–12 points) or as having mild (13–22 points), moderate (23–32 points), or severe (33–100 points) OSD [19].
All patients were instructed on how to use topical eye drops especially preservative‐free drops to avoid contamination and to avoid mixing the eye drops between both eyes.
2.2.2. Measurement of CET Mapping by MS‐39 Imaging
The CET was evaluated using MS‐39 (Costruzione Strumenti Oftalmici, CSO, Florence, Italy). The acquisition of the images and interpretation of all data of the tests were performed by the primary investigator (G.A.) to avoid interindividual variability. The machine showed excellent repeatability (95%) in measuring the epithelial thickness in keratoconic patients in previous studies [12]. The CET map was recorded and divided into three zones: Zone (1) central 2 mm; Zone (2) midperipheral 2–5 mm; and Zone (3) peripheral 5–6 mm. The midperipheral and peripheral zones included the superior, inferior, nasal, and temporal thicknesses (Figure 1). The pattern of distribution of the epithelial thickness map was documented. Central corneal thickness (CCT) was evaluated. The insufficient quality images detected were repeated.
The corneal epithelial thickness map divided into 3 zones: Zone (1) central 2 mm; Zone (2) midperipheral 2–5 mm; and Zone (3) peripheral 5–6 mm. The midperipheral and peripheral zones included the superior, inferior, nasal, and temporal thicknesses.
All patients were examined after 3 months for evaluation of BCVA, refraction, IOP, NIBUT, MGD, and OSDI score. Epithelial mapping and CCT were recorded. The two main groups were compared with analysis of all clinical and investigative data.
Correlations between the different CET parameters, BCVA, NIBUT, and OSDI score were evaluated.
2.3. Statistical Analysis
Data were coded and entered using the Statistical Package for the Social Sciences (SPSS) Version 28 (IBM Corp., Armonk, NY, USA). Data were summarized using mean and standard deviation in quantitative data and using frequency (count) and relative frequency (percentage) for categorical data. The continuous variables were checked for normality, and the variables following a normal distribution were analyzed using paired‐sample t‐test and Pearson’s correlation coefficient. Non‐normally distributed variables were analyzed with the equivalent nonparametric test (Wilcoxon signed‐rank test and Spearman’s correlation coefficient). Categorical variables were compared using McNemar’s test. p‐values less than 0.05 were considered statistically significant.
2.4. Sample Size Calculation
A statistical power analysis was performed to compare mean difference for the continuous variables between the two groups using t‐test. The effect size in this study was considered to be small to moderate (effect size = 0.35), with an alpha = 0.05 and power = 90%, and the sample size needed with this effect size calculated by G∗ Power 3.1 is 88 eyes (44 eyes for each group) [20].
3. Results
3.1. Epidemiology and Clinical Data
The mean age was 45.3 ± 11.7 years (range: 18–70). The study included 36 females (81.8%) and 8 males (18.2%). The pretreatment BCVA was 0.72 ± 0.1 in group A versus 0.77 ± 0.1 in group B (p-value = 0.174). The post‐treatment BCVA in group A was 0.78 ± 0.17 and 0.81 ± 0.14 for group B (p-value = 0.022). The mean IOP was 15.12 ± 1.83 mmHg in group A versus 15.21 ± 1.92 mmHg in group B (p-value = 0.742). The mean duration of DED was 2.1 ± 2.3 years (range: 0.2–8).
3.2. The Pretreatment Data of the Preservative Versus Preservative‐Free Group
No statistically significant difference was found in the mean NIBUT and OSDI scores between groups A and B (p-value = 0.107 and 0.323, respectively). The severity by OSDI score in both groups included 11 (25%) mild, 23 (52.3%) moderate, and 10 (22.7%) severe. Group A included 11.4% of patients without MGD and 88.6% with MGD, while in group B, 9.1% of patients did not have MGD and 90.9% had MGD (p-value = 0.999).
However, there was statistically significant difference in the mean epithelial thickness in the peripheral superior and peripheral nasal areas between groups A and B (p-value = 0.005 and 0.011, respectively). (Table 1).
3.3. The Post‐treatment Data of the Preservative Versus Preservative‐Free Group
There was no statistical significant difference in the mean NIBUT between the two groups (p-value = 0.470). Statistically significant improvement in the OSDI score between the two groups was observed (p-value = 0.026). The severity by OSDI score in both groups included 33 (75%) mild and 11 (25%) moderate.
The mean post‐treatment epithelial thickness in the central, paracentral superior, and peripheral inferior epithelial areas was significantly improved in the preservative‐free group than the preservative one (p-value = 0.033, 0.034, and 0.023, respectively) (Table 2).
3.4. Comparison of Pretreatment and Post‐treatment Data in the Preservative Group
By further analysis of data in group A, there was statistically significant increase in the NIBUT with decrease in the OSDI score and improvement in the severity by OSDI score (p-value < 0.001 each).
In the corneal epithelial map parameters, there was significant increase in the central epithelial area (p-value < 0.001), the paracentral inferior, nasal, and temporal areas (p-value = 0.002, < 0.001, 0.018), respectively, and the peripheral superior, nasal, and temporal areas (p-value = 0.006, 0.001, < 0.001), respectively (Table 3) (Figure 2 A & B).
(A) Corneal epithelial thickness map before treatment of case no. 11 in group A (preservative group). (B) Corneal epithelial thickness map 3 months after treatment of the same patient in group A.
3.5. Comparison of Pretreatment and Post‐treatment Data in the Preservative‐Free Group
In group B, there was statistically significant increase in the NIBUT, decrease in the OSDI score, and improvement of the severity of the OSDI score (p-value < 0.001 each). However, the difference in the MGD was statistically nonsignificant (p-value = 0.500).
In the corneal epithelial parameters, there was significant increase in all parameters of the epithelial map: the central epithelial area; the paracentral superior, inferior, nasal, and temporal areas; and the peripheral superior, inferior, nasal, and temporal areas (p-value < 0.001 each) (Table 4) (Figure 3 A & B).
(A) Corneal epithelial thickness map before treatment of case no. 20 in group B (preservative‐free group). (B) Corneal epithelial thickness map 3 months after treatment of the same patient in group B.
A statistically significant positive correlation was found between the percentage improvement of OSDI score and post‐treatment increase in epithelial thickness in the peripheral nasal area in group A (r = 0.337, p = 0.027). This was also observed in the central and paracentral superior areas in group B (r = 0.327, p = 0.032, r = 0.314, p = 0.040), respectively (Table 5).
4. Discussion
The use of artificial tears for the treatment of dry eye is widespread especially where aqueous‐deficient DED exists [21].
Drops delivered in a multidose format have preservatives for maintaining their sterility. The most commonly used preservative is BAK. While it is known to be an effective antimicrobial agent, many studies have shown its adverse effect on the ocular surface particularly when used for a long time. This has contributed to a movement toward preservative‐free topical preparations in both glaucomatous and DED populations [21].
The corneal epithelium is one of the main structures that undergo degenerative alterations in ocular diseases. Therefore, CET measurement has been suggested as an objective indicator for monitoring ocular surface health [21].
The effect of preservatives on epithelial cells has been the interest of many studies [20, 21]. The tear film proteome, for factors relating to epithelial leakage and inflammation, showed significant improvement after switching to preservative‐free tafluprost from BAK‐preserved latanoprost drops [21].
Experimental studies on corneal epithelial cells showed that the preservative‐free anti‐allergy drug ketotifen did not impair cell structure and viability, compared to the damage resulting from use of BAK‐preserved medications [21–23]. Following 7‐day treatment with preservative‐free travoprost, positive effects on tear production and corneal tissues were compared to the BAK‐treated group [21]. Similar conclusions were reached using scanning electron microscopy to examine rabbit eyes [21].
The toxic effect of BAK lies in loss of epithelial microvillar brush, widening of the extracellular space, and disorganization of the epithelium. This results in a decrease in the conjunctival and corneal epithelium cell density and metaplasia through apoptosis and/or cellular necrosis, depending on the concentration [24].
Controversies exist with the effect of dry eye on the corneal morphology [25], and some animal and human studies found that the CET became thicker in DED, indicating that epithelial proliferation has a significant impact on the inflammatory process [22]. Others reported that the CET tends to be thinner in dry eyes and attributed it to the destruction of stem cells at the limbus [26].
Nam & kim were the first to investigate the effect of preservative including BAK on the CET using OCT and concluded that there was a linear relationship between the increased number of medications, treatment duration, and preservatives contributed to reduced epithelial thickness [27].
To our knowledge, this is the first study using MS‐39 to evaluate the epithelial thickness in dry eye patients and the effect of preservative and preservative‐free lubricants on the corneal epithelium [28]. Although in our study we did not compare the epithelial thickness with the normal population, the significant increase in thickness post‐treatment in both groups denotes the presence of pre‐existing thinning in the corneal epithelium which may be attributed to the decrease in the inflammatory process and promotion of proliferation of the epithelial cells especially at the limbus, with the added benefit of less induced inflammatory reaction of the added preservative.
Cost, ease of use, and compliance remain relevant considerations for preservative‐free single‐use formats. For mild‐to‐moderate DED, alternative artificial tear and lubricants exist with preservatives other than BAK [21].
A number of in vitro studies have been conducted comparing the effect of BAK, sodium perborate, other alternative preservatives, and preservative‐free formulations on human conjunctival epithelial cells. Across these studies, the general conclusion is that sodium perborate has a significantly less toxic effect on ocular corneal and conjunctival cells compared to BAK but that preservative‐free preparations have the least effect on cell viability [29, 30].
In our study, we aimed to compare the effect of lighter preservatives as sodium perborate to preservative‐free preparations. The idea of a “disappearing” preservative is to deliver both antimicrobial activities in the solution and then cause minimal impact to the ocular surface [31].
Previous switch studies have shown that even with non‐BAK preservatives, switching to preservative‐free resulted in quick improvement of OSDI and punctate keratitis [32–34]. However, the tests used as OSDI and TBUT lack standardization and repeatability with great discrepancy between the symptoms and signs in dry eye patients [35].
To provide better reproducibility, we used the NIBUT with cutoff point of 12 s which was proven to be the value with greatest sensitivity and specificity, distinguishing patients with dry eye symptoms and normal subjects. NIBUT has shown better diagnostic performance than standard TBUT in detecting patients with dry eye symptoms [36]. In our study, both preservative and preservative‐free artificial tears had significant improvement of the NIBUT.
In addition to the improvement in the OSDI and NIBUT in our study, superiority of the preservative‐free medication was detected using the OCT with significant changes regarding central, paracentral superior, and paracentral inferior areas.
Cui et al. demonstrated greater variability in epithelial thickness in the superior quadrant in patients with dry eye, which would explain, in our study, the pretreatment significant difference in the superior corneas of both groups, which can also be due to the variability of pannus between both eyes [25].
Vision was also statistically improved in the preservative‐free group. Studies have found that the visual disturbances in DED are related to the unstable tear film and have been considered as a parameter for evaluation of the stability of the tear film and the severity of DED [37].
The main strength of our study is the combination of both the subjective and objective measures of DED, as well as the association of clinical parameters of DED and epithelial thickness mapping, which all proved to be safer in the preservative‐free group.
Limitations include short follow‐up period, which might have not demonstrated clearly the toxic effect of the preservative. Another limitation is using only NITBUT as an objective tool, and other tests, such as Schirmer’s test, fluorescein staining, and quantitative measurement of tear film osmolarity, should be added in further studies. Because of the low socioeconomic lifestyle, some of the questions of the OSDI did not apply as using the TV, driving, and air conditioning might have been misleading regarding the severity of their condition.
The presence of treatment discrepancies and the peripheral nasal and peripheral superior quadrants between both groups are a potential limitation; however, this is attributed to the endemic trachoma with unequal pannus between both eyes in some patients, and discrepancies are only seen. In the very peripheral cornea, however, the central and paracentral quadrants that are more relevant to the study are comparable between both groups.
Another limitation is the lack of normal control groups. Further, case–control studies are needed to compare the effect of artificial tears on non‐DED patients versus those with pre‐existing DED.
In conclusion, although both preservative‐free and preserved artificial tears show an increase in epithelial thickness using MS‐39 and improvement in OSDI. Preservative‐free artificial tears show superiority, both subjectively and objectively, compared to preserved artificial tears using even lighter preservatives, being a safer option for long‐term application.
Ethics Statement
The Institutional Review Board and Ethics Committee of the Faculty of Medicine, Cairo University, approved this study. Ethics Committee Code N‐12‐2022.
Disclosure
All authors read and approved the final manuscript.
Conflicts of Interest
The authors declare no conflicts of interest.
Author Contributions
Conceptualization: Ghada A. Nassar, Aliaa A. Farag, Ahmed Rashad Ashor, and Mohamed Hosny; methodology and formal analysis: Ghada A. Nassar, Aliaa A. Farag, and Ahmed Rashad Ashor; writing–original draft preparation: Ghada A. Nassar, Aliaa A. Farag, and Ahmed Rashad Ashor; writing–review and editing: Mohamed Hosny and Jorge Alio; supervision: Mohamed Hosny and Jorge Alio.
Funding
The authors received no financial support.
The reference list from the paper itself. Each links out to its DOI / PubMed record.
- 1Craig J. P. , Nichols K. K. , Akpek E. K. et al., TFOS DEWS II Definition and Classification Report, Ocular Surface. (2017) 15, no. 3, 276–283, 10.1016/j.jtos.2017.05.008, 2-s 2.0-85025470412.28736335 · doi ↗ · pubmed ↗
- 2Sledge S. M. , Khimji H. , Borchman D. et al., Evaporation and Hydrocarbon Chain Conformation of Surface Lipid Films, Ocular Surface. (2016) 14, no. 4, 447–459, 10.1016/j.jtos.2016.06.002, 2-s 2.0-84992390303.27395776 PMC 5065757 · doi ↗ · pubmed ↗
- 3Asiedu K. , Role of Ocular Surface Neurobiology in Neuronal-mediated Inflammation in Dry Eye Disease, Neuropeptides. (2022) 95, 10.1016/j.npep.102266.35728484 · doi ↗ · pubmed ↗
- 4Belmonte C. , Nichols J. J. , Cox S. M. et al., TFOS DEWS II Pain and Sensation Report, Ocular Surface. (2017) 15, no. 3, 404–437, 10.1016/j.jtos.2017.05.002, 2-s 2.0-85025444293.28736339 PMC 5706540 · doi ↗ · pubmed ↗
- 5Inomata T. , Shiang T. , Iwagama M. et al., Changes in Distribution of Dry Eye Disease by the New 2016 Diagnostic Criteria from the Asia Dry Eye Society, Scientific Reports. (2018) 8, no. 1, 10.1038/s 41598-018-19775-3, 2-s 2.0-85041237241.PMC 578983729382858 · doi ↗ · pubmed ↗
- 6Yokoi N. , Georgiev G. A. , Kato H. et al., Classification of Fluorescein Breakup Patterns: A Novel Method of Differential Diagnosis for Dry Eye, American Journal of Ophthalmology. (2017) 180, 72–85, 10.1016/j.ajo.2017.05.022, 2-s 2.0-85020861658.28579061 · doi ↗ · pubmed ↗
- 7Gaudenzi D. , Mori T. , Crugliano S. et al., AS-OCT and Ocular Hygrometer as Innovative Tools in Dry Eye Disease Diagnosis, Applied Sciences. (2022) 12, no. 3, 10.3390/app 12031647. · doi ↗
- 8Akiyama R. , Usui T. , and Yamagami S. , Diagnosis of Dry Eye by Tear Meniscus Measurements Using Anterior Segment Swept Source Optical Coherence Tomography, Cornea. (2015) 34, no. 11, 115–120, 10.1097/ico.0000000000000583, 2-s 2.0-84944046264.26448168 · doi ↗ · pubmed ↗