The Relative Effects of Monotherapies for Psoriatic Nails: A Network Meta‐Analysis Study
Aditya K. Gupta, Mary A. Bamimore, Tong Wang, Mesbah Talukder

TL;DR
This study compares the effectiveness of different single treatments for nail psoriasis using advanced statistical methods to help guide treatment choices.
Contribution
The study provides a Bayesian network meta-analysis comparing monotherapies for nail psoriasis, including some that have never been directly compared.
Findings
Tofacitinib 10 mg twice daily was most effective for reducing nail psoriasis severity based on NAPSI scores.
Ixekizumab 160 mg at week 0 followed by 80 mg every 4 weeks was most effective for achieving clear or almost clear nails.
The study produced comparative evidence for 22 active treatments, including biologics and non-biologics.
Abstract
Various treatments exist for nail psoriasis (NP). We determined the relative efficacy of various monotherapies through Bayesian network meta‐analyses (NMAs). We systematically reviewed the literature to identify eligible studies which—within the patient, intervention, comparator, outcome (PICO) context—determined the impact of biologic monotherapies on NP in terms of two outcome measures, namely, (1) the 16 to 24‐week mean change in the Nail Psoriasis Severity Index (NAPSI) (i.e., outcome 1), and (2) the proportion who attained a Physician Global Assessment of fingernails (PGA‐f) of “0” or “1” (i.e., “clear” or “almost clear”) between 16 and 24 weeks (i.e., outcome 2). Our NMAs estimated the surface under the cumulative ranking curve (SUCRA) values and pairwise relative effects. We also determined relative effects of comparators that had never been compared for this condition,…
Genes, proteins, chemicals, diseases, species, mutations and cell lines named across the full text — each resolved to its canonical identifier and authoritative record.
Click any figure to enlarge with its caption.
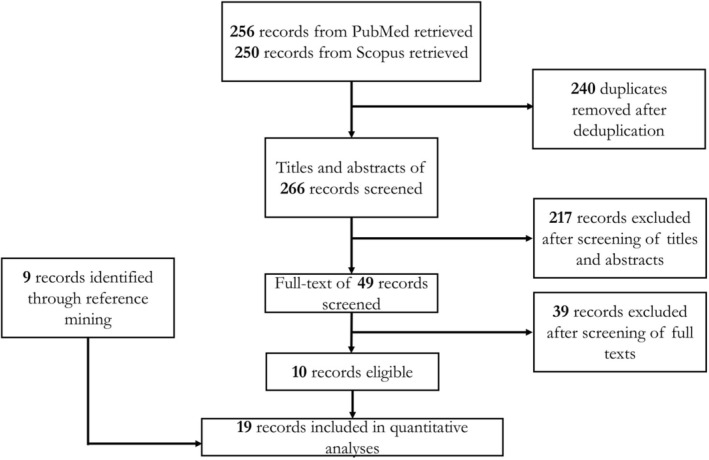 FIGURE 1
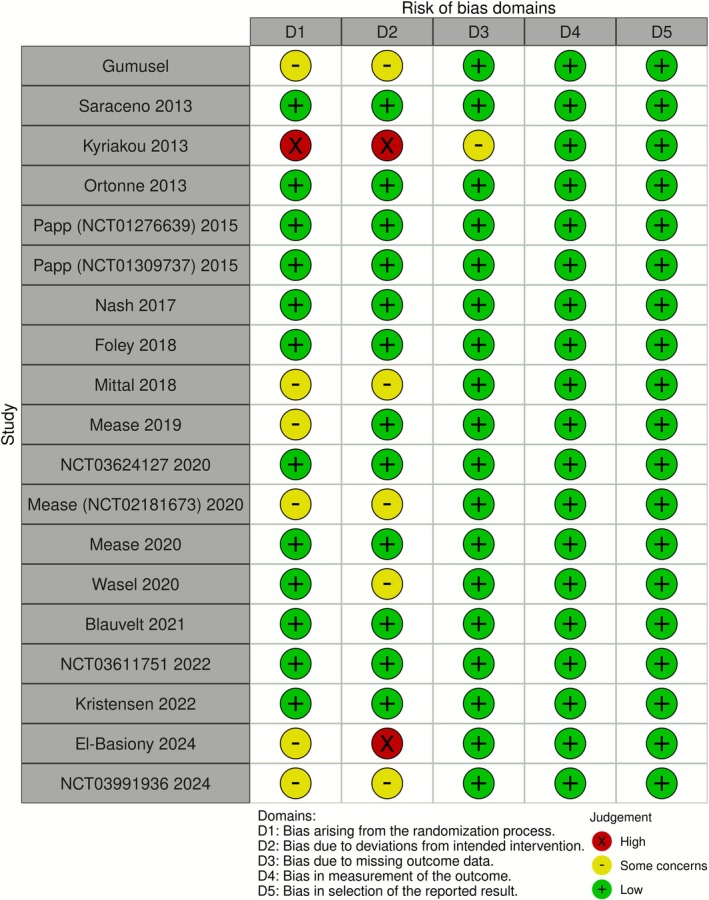 FIGURE 2
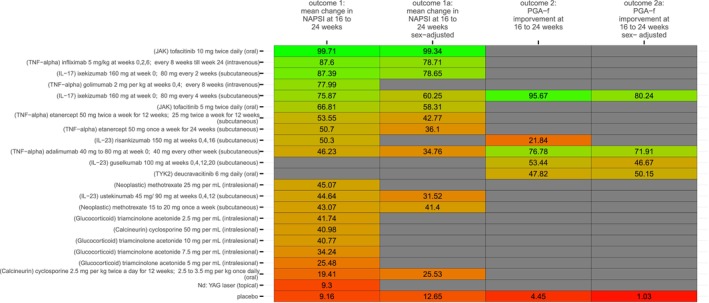 FIGURE 3
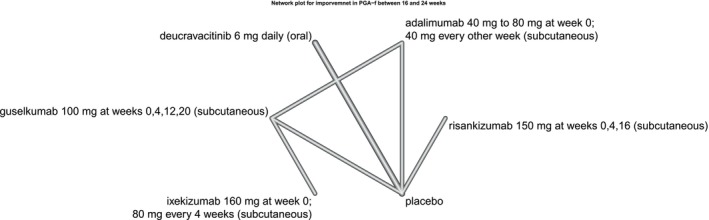 FIGURE 4
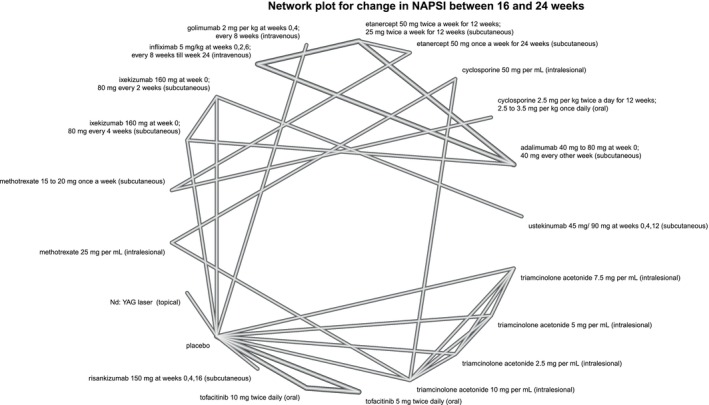 FIGURE 5
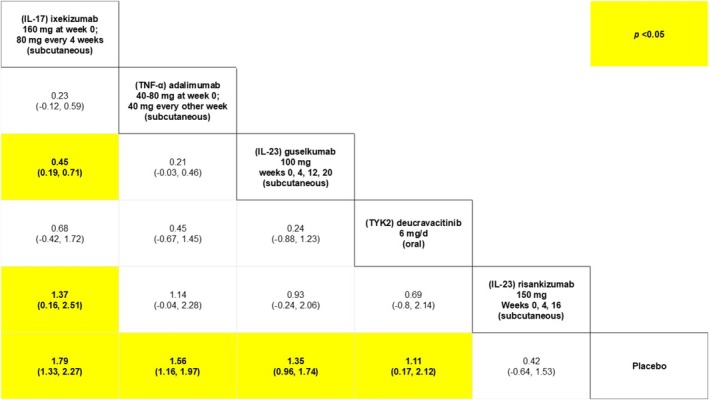 FIGURE 6
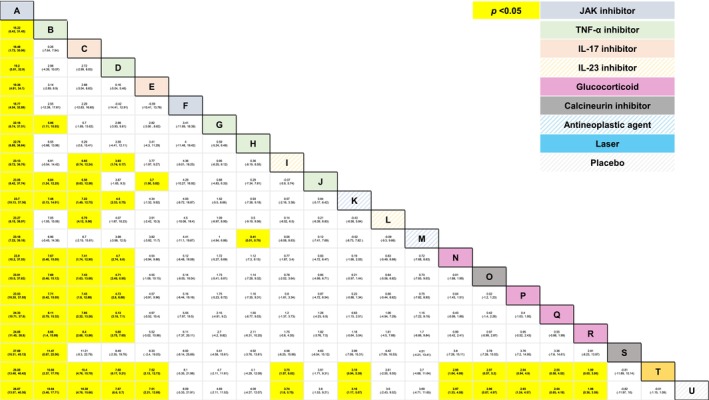 FIGURE 7
| Author | Year | Arm | Route | Dose and frequency | N | Age (±SD) | Sex (percent male) |
|---|---|---|---|---|---|---|---|
| El‐Basiony | 2024 | Nd: YAG laser | Topical | 43 | NR | NR | |
| Placebo | 43 | ||||||
| 2024 | Triamcinolone acetonide | Intralesional | 2.5 mg per mL | 10 | NR | NR | |
| 5 mg per mL | 10 | NR | NR | ||||
| 7.5 mg per mL | 10 | NR | NR | ||||
| 10 mg per mL | 10 | NR | NR | ||||
| Placebo | 10 | NR | NR | ||||
| Kristensen | 2022 | Risankizumab | Subcutaneous | 150 mg at weeks 0, 4, 16 | 72 | NR | NR |
| Placebo | 34 | ||||||
| 2022 | Deucravacitinib | Oral | 6 mg daily | 69 | 46.9 (13.37) | 65.80% | |
| Placebo | 38 | 47.3 (13.57) | 71% | ||||
| Blauvelt | 2021 | Ixekizumab | Subcutaneous | 160 mg at week 0; 80 mg every 4 weeks | 520 | 49 (13.9) | 65% |
| Guselkumab | Subcutaneous | 100 mg at weeks 0, 4, 12, 20 | 507 | 49 (14.88) | 61.9% | ||
| Mease | 2020 | Ixekizumab | Subcutaneous | 160 mg at week 0; 80 mg every 4 weeks | 283 | 47.5 (12) | 57.2% |
| Adalimumab | Subcutaneous | 40 mg at week 0; 40 mg every other week till week 24 | 283 | 48.3 (12.3) | 53% | ||
| 2020 | Deucravacitinib | Oral | 6 mg daily | 43 | 45.9 (13.71) | 69.30% | |
| Placebo | 34 | 47.9 (13.98) | 68.10% | ||||
| Mease ( | 2020 | Golimumab | Intravenous | 2 mg per kg at weeks 0, 4; every 8 weeks | NR | NR | |
| Placebo | NR | NR | |||||
| Wasel | 2020 | Ixekizumab | Subcutaneous | 160 mg at week 0; 80 mg every 2 weeks | 166 | 43 (12) | 36.1% |
| Ustekinumab | Subcutaneous | 45 mg/90 mg at weeks 0, 4, 12 | 166 | 45.4 (12.7) | 48.2% | ||
| Mease | 2019 | Etanercept | Subcutaneous | 50 mg once a week for 24 weeks | 284 | 48.5 (13.5) | 53.2% |
| Methotrexate | Subcutaneous | 15 to 20 mg once a week | 284 | 48.7 (13.1) | 43.7% | ||
| Mittal | 2018 | Triamcinolone acetonide | Intralesional | 10 mg per mL | 17 | NR | NR |
| Methotrexate | Intralesional | 25 mg per mL | 17 | NR | NR | ||
| Cyclosporine | Intralesional | 50 mg per mL | 17 | NR | NR | ||
| Foley | 2018 | Guselkumab | Subcutaneous | 100 mg at weeks 0, 4, 12, 20 | 825 | 43.8 (12.43) | 71.4% |
| Adalimumab | Subcutaneous | 80 mg at week 0; 40 mg every other week till week 24 | 582 | 43 (12.29) | 72% | ||
| Nash | 2017 | Ixekizumab | Subcutaneous | 160 mg at week 0; 80 mg every 4 weeks | 122 | 52.6 (13.6) | 51.6% |
| Ixekizumab | Subcutaneous | 160 mg at week 0; 80 mg every 2 weeks | 123 | 51.7 (11.9) | 40.7% | ||
| Placebo | 118 | 51.5 (10.4) | 47.5% | ||||
| 2015 | Tofacitinib | Oral | 5 mg twice daily | 363 | 45.6 (13.4) | 71.9% | |
| Tofacitinib | Oral | 10 mg twice daily | 360 | 45.2 (12.8) | 72.5% | ||
| Placebo | 177 | 45 (12.6) | 68.37% | ||||
| 2015 | Tofacitinib | Oral | 5 mg twice daily | 382 | 45.9 (12.9) | 70.16% | |
| Tofacitinib | Oral | 10 mg twice daily | 381 | 44.3 (13.0) | 67.5% | ||
| Placebo | 196 | 44.8 (12.6) | 62.76% | ||||
| Kyriakou | 2013 | Infliximab | Intravenous | 5 mg/kg at weeks 0, 2, 6; every 8 weeks till week 24 | 12 | 44.92 (15.37) | 41.7% |
| Adalimumab | Subcutaneous | 80 mg at week 0; 40 mg every other week till week 24 | 14 | 46.29 (15.68) | 35.7% | ||
| Etanercept | Subcutaneous | 50 mg twice a week for 12 weeks; 25 mg twice a week for 12 weeks | 13 | 49.15 (12.88) | 53.8% | ||
| Ortonne | 2013 | Etanercept | Subcutaneous | 50 mg twice a week for 12 weeks; 25 mg twice a week for 12 weeks | 36 | 46.2 (13.5) | 72.2% |
| Etanercept | Subcutaneous | 50 mg once a week for 24 weeks | 33 | 45.4 (9.2) | 72.7% | ||
| Saraceno | 2013 | Adalimumab | Subcutaneous | 80 mg at week 0; 40 mg every other week till week 24 | 20 | 48 (12) | 75% |
| Etanercept | Subcutaneous | 50 mg twice a week for 12 weeks; 25 mg twice a week for 12 weeks | 20 | 45 (10) | 70% | ||
| Infliximab | Intravenous | 5 mg/kg at weeks 0,2,6; every 8 weeks till week 24 | 20 | 50 (15) | 70% | ||
| Gumusel | 2011 | Methotrexate | Subcutaneous | 15 to 20 mg once a week | 17 | 42.5 (12.5) | 58.82% |
| Cyclosporine | Oral | 2.5 mg per kg twice a day for 12 weeks; 2.5 to 3.5 mg per kg once daily | 17 | 38.4 (10.2) | 47.06% |
Peer Reviews
No public reviews on file for this paper yet. If you reviewed it on a platform where reviews are public (OpenReview, ICLR, NeurIPS, ICML), you can paste yours below so the community can read it here.
Videos
No videos yet. Explain this paper in a talk, walkthrough, or lecture? Add one.
Taxonomy
TopicsPsoriasis: Treatment and Pathogenesis · Nail Diseases and Treatments · Spondyloarthritis Studies and Treatments
Introduction
1
Psoriasis is a chronic, multisystem autoimmune disorder that can involve the skin, nails, or joints [1, 2]. While the prevalence of psoriasis can vary across countries, the global prevalence is about 2% [3] and, globally, approximately 60 million individuals have psoriasis [1]. The global lifetime incidence of developing nail psoriasis (NP) among persons with plaque psoriasis is 80% to 90% [4, 5]; furthermore, NP is more prevalent in males than in females [6, 7]. Beyond physical disability [6, 7], a diagnosis of psoriasis has been highly associated with stigmatization [8], and anxiety [9].
Over the last decade, several immunomodulatory agents, such as biologics, have been used to treat NP, and their relative efficacy has been published in a couple of network meta‐analyses (NMAs) [10, 11, 12, 13]. The current study used the existing evidence base to determine the relative efficacy of monotherapy with biologics on NP using NMAs.
Materials and Methods
2
The entire conduct of our work was in accordance with the Preferred Reporting Items for Systematic Reviews and Meta‐Analyses (PRISMA) guidelines for NMAs [14]. The protocol for the current study was registered in the Open Science Framework (OSF) [15] platform (https://doi.org/10.17605/OSF.IO/34KWR).
As per the patient, intervention, comparator, outcome (PICO) framework [16] for eligible studies: our population of interest was persons with NP, and the outcomes of interest were the following: (1) mean change in Nail Psoriasis Severity Index (NAPSI) between 16 and 24 weeks from baseline and (2) proportion of patients who attained a Physician Global Assessment of “0” or “1” (i.e., “clear” or “almost clear”) in fingernails (PGA‐f) between 16 and 24 weeks from baseline. The intervention of interest was monotherapy with an immunomodulatory agent (i.e., biologics)—as well as commonly used ones (e.g., methotrexate, cyclosporine, etc.)—for NP; comparators could be placebo/vehicle or other active comparators. Furthermore, eligible studies had to be published in English.
Systematic searches were conducted in PubMed and Scopus. The Systematic Review Accelerator (SRA) [17] was used to deduplicate the searches; Rayyan [18] software was used for the two stages of screening, that is, screening of (1) titles and abstracts and (2) full texts. The searches and screenings were done independently by two authors (M.T. and M.A.B.); disagreements were resolved through discussion with a third author (A.K.G.). Following the review of full texts, data extraction commenced, and the extracted data were organized in spreadsheets.
For each of the two outcomes of interest, we conducted a Bayesian NMA with uniform priors to estimate pairwise relative effects and surface under the cumulative ranking curve (SUCRA) values. For the 16 to 24 week change in mean NAPSI, point estimate for pairwise relative effects was the mean difference (MD); the odds ratio (OR) was used for the other outcome of interest, that is, proportion of patients who attained a PGA‐f of 0 or 1 between 16 and 24 weeks. The 95% credible interval (CI) was estimated for point estimates.
We used network plots to depict the geometry of the networks; the conduct of node‐splitting analyses for consistency was dependent on the networks' geometry. For sensitivity analyses, we conducted a network meta‐regression that adjusted for variation in sex distribution ecologically (i.e., at the study level).
Results
3
The data used across all our analyses were obtained from a total of 19 studies [19, 20, 21, 22, 23, 24, 25, 26, 27, 28, 29, 30, 31, 32, 33, 34, 35, 36, 37] (Figure 1) whose study‐level characteristics have been summarized in Table 1. A total of 22 active comparators were identified, namely, (1) guselkumab 100 mg at weeks 0, 4, 12, 20, (2) adalimumab 40 to 80 mg at week 0; 40 mg every other week, (3) deucravacitinib 6 mg daily, (4) ixekizumab 160 mg at week 0; 80 mg every 4 weeks, (5) risankizumab 150 mg at weeks 0, 4, 16, (6) etanercept 50 mg twice a week for 12 weeks; 25 mg twice a week for 12 weeks, (7) infliximab 5 mg/kg at weeks 0, 2, 6; every 8 weeks till week 24, (8) etanercept 50 mg once a week for 24 weeks, (9) ixekizumab 160 mg at week 0; 80 mg every 2 weeks, (10) ustekinumab 45 to 90 mg at weeks 0, 4, 12, (11) Nd: YAG laser, (12) tofacitinib 5 mg twice daily, and (13) tofacitinib 10 mg twice daily, (14) golimumab 2 mg per kg at weeks 0, 4; every 8 weeks, (15) triamcinolone acetonide 2.5 mg per mL, (16) triamcinolone acetonide 5 mg per mL, (17) triamcinolone acetonide 7.5 mg per mL, (18) triamcinolone acetonide 10 mg per mL, (19) methotrexate 25 mg per mL, (20) cyclosporine 50 mg per mL, (21) methotrexate 15 to 20 mg once a week, and (22) cyclosporine 2.5 mg per kg twice a day for 12 weeks; 2.5 to 3.5 mg per kg once daily. The placebo and vehicle arms were amalgamated into one node.
Summary of search process. This flow chart briefly depicts the systematic process entailed in our search for eligible studies.
Qualitative summary of each study's risk of bias is summarized in the traffic plot in Figure 2. The comparators' SUCRA values across each network (i.e., across each outcome) under the base and sex‐adjusted (i.e., sensitivity) analyses are presented in the kilim plot [38] in Figure 3. The network plots for the two outcomes are in Figures 4 and 5; the relative effects are presented in the league tables in Figures 6 and 7. Node splitting analysis of consistency was not possible for either network due to the absence of a closed loop [39].
Eligible studies' evidence quality. This “traffic plot” depicts a qualitative evaluation for each study's risk of bias (RoB).
A kilim plot of comparators' surface under the cumulative ranking curve (SUCRA) values. This kilim plot illustrates the relative efficacy of each comparator. The numeric values displayed within each cell correspond to the SUCRA values of the comparators. The horizontal axis represents the outcomes, while the vertical axis corresponds to the individual comparators. The purpose of this kilim plot is to offer an intuitive visual comparison of the relative efficacy of various comparators by way of a color gradient. In this representation, greener cells indicate higher efficacy, whereas redder cells denote lower efficacy. mg, milligrams; NAPSI, Nail Psoriasis Severity Index; PGA‐f, Physician Global; Assessment for fingernails. TNF‐α corresponds to inhibitors of tumor necrosis factor‐alpha: Ustekinumab is also an inhibitor of interleukin 12 (IL‐12); IL‐17 corresponds to interleukin 17 and IL‐23 corresponds to interleukin 23; Calcineurin corresponds to calcineurin inhibitors; JAK corresponds to Janus kinase inhibitors.
Network plot for PGA‐f. This plot is for the network representing the proportion of patients who achieved a Physician Global Assessment for fingernails (PGA fingernail) of clear or almost clear between 16 and 24 weeks from baseline.
Network plot for NAPSI. This plot is for the network representing the mean change in Nail Psoriasis Severity Index (NAPSI) between 16 and 24 weeks from baseline.
League table for PGA‐f between 16 and 24 weeks from baseline. This table presents comparators' relative efficacy for every possible pairwise comparison. Each cell presents a point estimate (i.e., mean difference of the log odds) and 95% credible interval in parentheses. Yellow‐colored cells represent a statistically significant difference (p < 0.05). TNF‐α corresponds to inhibitors of tumor necrosis factor‐alpha; Ustekinumab is also an inhibitor of interleukin 12 (IL‐12); IL‐17 corresponds to the inhibitor of interleukin 17 and IL‐23 corresponds to the inhibitor of interleukin 23.
League table for mean change in NAPSI between 16 and 24 weeks from baseline. This table presents comparators' relative efficacy for every possible pairwise comparison. Each cell presents a point estimate (i.e., mean difference) and 95% credible interval in parentheses. Yellow‐colored cells represent a statistically significant difference (p < 0.05). A: (JAK) tofacitinib 10 mg twice daily (oral), B: (TNF‐α) infliximab 5 mg/kg at weeks 0, 2, 6; every 8 weeks until week 24 (intravenous), C: (IL‐17) ixekizumab 160 mg at week 0; 80 mg every 2 weeks (subcutaneous), D: (TNF‐α) golimumab 2 mg/kg at weeks 0, 4; every 8 weeks (intravenous), E: (IL‐17) ixekizumab 160 mg at week 0; 80 mg every 4 weeks (subcutaneous), F: (JAK) tofacitinib 5 mg twice daily (oral), G: (TNF‐α) etanercept 50 mg twice a week for 12 weeks; 25 mg twice a week for 12 weeks (subcutaneous), H: (TNF‐α) etanercept 50 mg once a week for 24 weeks (subcutaneous), I: (IL‐23) risankizumab 150 mg at weeks 0, 4, 16 (subcutaneous), J: (TNF‐α) adalimumab 40–80 mg at week 0; 40 mg every other week (subcutaneous), K: (Anti‐neoplastic) methotrexate 25 mg/mL (intralesional), L: (IL‐23) Ustekinumab 45 mg/90 mg at weeks 0, 4, 12 (subcutaneous), M: (Anti‐neoplastic) methotrexate 15–20 mg once a week (subcutaneous), N: (Glucocorticoid) triamcinolone acetonide 2.5 mg/mL (intralesional), O: (Calcineurin) cyclosporine 50 mg/mL (intralesional), P: (Glucocorticoid) triamcinolone acetonide 10 mg/mL (intralesional), Q: (Glucocorticoid) triamcinolone acetonide 7.5 mg/mL (intralesional), R: (Glucocorticoid) triamcinolone acetonide 5 mg/mL (intralesional), S: (Calcineurin) cyclosporine 2.5 mg/kg twice a day for 12 weeks; 2.5–3.5 mg/kg once daily (oral), T: Nd:YAG laser (topical), U: Placebo. TNF‐α corresponds to inhibitors of tumor necrosis factor‐alpha; Ustekinumab is also an inhibitor of interleukin 12 (IL‐12); IL‐17 corresponds to inhibitor of interleukin 17 and IL‐23 corresponds to inhibitor of interleukin 23; Calcineurin corresponds to calcineurin inhibitors; JAK corresponds to Janus Kinase inhibitor; TYK2 corresponds to the inhibitor of Tyrosine Kinase 2.
Discussion
4
We determined the relative effects of monotherapy with various agents, including methotrexate, cyclosporine, inhibitors of interleukin 17 (IL‐17), and interleukin 23 (IL‐23), on NP using the current evidence base. Our current NMA study and those by Husein‐El Ahmed et al. [10], Szebényi et al. [12], Huang et al. [13], and Egeberg et al. [11] collectively highlight the salience of having clinical trials primarily designed for the study of NP. The existing comparative data on NP treatments from the current study largely come from trials that were primarily designed for plaque psoriasis, and empirical data regarding NP treatments usually come from post hoc analyses. Hence, selection bias due to post hoc selection [40] cannot be ruled out from our NMA study.
We used well‐recognized outcome measures for the analyses, namely, NAPSI and PGA‐f; these have been used in numerous NMA studies, including the previous NMA studies by Husein‐El Ahmed et al. [10], Szebényi et al. [12], Huang et al. [13], and Egeberg et al. [11].
Our results resonate with those of previous NMA studies. For instance, our analyses ranked “tofacitinib 10 mg twice daily” the most efficacious option in terms of 16 to 24 week mean change in NAPSI. When other outcomes are considered, for example, the proportion of individuals attaining PGA‐f of 0 or 1 at 16 to 24 weeks, “ixekizumab 160 mg at week 0, then 80 mg every 4 weeks” was ranked most efficacious. The rank order of our NMA for ixekizumab and tofacitinib tally with works by Huang et al. [13] (who found tofacitinib to be most efficacious) and Egeberg et al. [11] (who found ixekizumab to be the most efficacious). Like the NMAs by Egeberg et al. [11] and Szebényi et al. [12], we found that ustekinumab was ranked lower than, say, tofacitinib and ixekizumab.
For each of the networks, nodes were defined at the dosage level. Furthermore, we identified regimens that had never been compared in previous NMAs for nail psoriasis including: (1) deucravacitinib 6 mg daily, (2) risankizumab 150 mg at weeks 0, 4, 16, and (3) Nd: YAG laser. The time point we chose for our NMAs (16 to 24 weeks) was different from those selected in some of the other NMAs because most of the studies with the different biologics report their efficacy at this time point, making it useful for comparison purposes; notwithstanding that, the relative longer‐term efficacy of the different biologics may be different from the efficacy at weeks 16–24.
The rank order of treatments under sensitivity analyses was similar to those of the base analyses which thereby supports our base model being robust. For sensitivity analyses, we chose to adjust for variation in sex as the literature reports NP to affect men disproportionately more than women [6, 7].
Our results serve as some form of evidence to guide clinical decision‐making because this condition has lacked sufficient clinical evidence base for establishing clinical practice guidelines specific to NP—as echoed by Crowley et al. [4].
Author Contributions
Conception of the manuscript was done by A.K.G. and M.T. Data analysis was performed by M.A.B. The manuscript was drafted by A.K.G., T.W., M.T., and M.A.B.; substantively edited and revised by A.K.G., M.A.B., T.W., and M.T.
Funding
The authors have nothing to report.
Ethics Statement
The authors have nothing to report.
Consent
The authors have nothing to report.
Conflicts of Interest
The authors declare no conflicts of interest.
The reference list from the paper itself. Each links out to its DOI / PubMed record.
- 1A. Raharja , S. K. Mahil , and J. N. Barker , “Psoriasis: A Brief Overview,” Clinical Medicine 21, no. 3 (2021), 10.7861/CLINMED.2021-0257.PMC 814069434001566 · doi ↗ · pubmed ↗
- 2N. Dand , S. K. Mahil , F. Capon , C. H. Smith , M. A. Simpson , and J. N. Barker , “Psoriasis and Genetics,” Acta Dermato‐Venereologica 100 (2020), 10.2340/00015555-3384.PMC 912894431971603 · doi ↗ · pubmed ↗
- 3A. Rendon and K. Schäkel , “Psoriasis Pathogenesis and Treatment,” International Journal of Molecular Sciences 20, no. 6 (2019): 1475, 10.3390/ijms 20061475.30909615 PMC 6471628 · doi ↗ · pubmed ↗
- 4J. J. Crowley , J. M. Weinberg , J. J. Wu , A. D. Robertson , and A. S. Van Voorhees , “Treatment of Nail Psoriasis: Best Practice Recommendations From the Medical Board of the National Psoriasis Foundation,” JAMA Dermatology 151, no. 1 (2015), 10.1001/jamadermatol.2014.2983.25471223 · doi ↗ · pubmed ↗
- 5K. R. R. Schons , C. F. Knob , N. Murussi , A. A. C. Beber , W. Neumaier , and O. A. Monticielo , “Nail Psoriasis: A Review of the Literature,” Anais Brasileiros de Dermatologia 89, no. 2 (2014): 312–317, 10.1590/abd 1806-4841.20142633.24770509 PMC 4008063 · doi ↗ · pubmed ↗
- 6V. Almeida , S. Taveira , M. Teixeira , I. Almeida , J. Rocha , and A. Teixeira , “Emotion Regulation in Patients With Psoriasis: Correlates of Disability, Clinical Dimensions, and Psychopathology Symptoms,” International Journal of Behavioral Medicine 24, no. 4 (2017): 563–570, 10.1007/s 12529-016-9617-0.27924553 · doi ↗ · pubmed ↗
- 7V. Almeida , Â. Leite , D. Constante , et al., “The Mediator Role of Body Image‐Related Cognitive Fusion in the Relationship Between Disease Severity Perception, Acceptance and Psoriasis Disability,” Behavioral Science 10, no. 9 (2020): 142, 10.3390/BS 10090142.PMC 755139832961792 · doi ↗ · pubmed ↗
- 8S. B. Perrott , A. H. Murray , J. Lowe , and C. M. Mathieson , “The Psychosocial Impact of Psoriasis: Physical Severity, Quality of Life, and Stigmatization,” Physiology & Behavior 70, no. 5 (2000): 567–571, 10.1016/S 0031-9384(00)00290-0.11111012 · doi ↗ · pubmed ↗