Magnetic resonance quantification of regional blood flow and oxygen delivery to the brain, gut, kidneys, and lower extremities in adolescents with a Fontan circulation compared to biventricular controls
Jennifer Romanowicz, Sungho Park, Jenifer Bunn, Roni M. Jacobsen, Brian Fonseca, Jenny E. Zablah, Erin K. Englund, Alex J. Barker, Jesse A. Davidson

TL;DR
This study uses magnetic resonance imaging to compare blood flow and oxygen delivery to key organs in adolescents with a Fontan circulation versus healthy controls.
Contribution
The study provides new empirical evidence on regional blood flow and oxygen delivery patterns in Fontan physiology compared to biventricular controls.
Findings
Renal and iliac arterial flows were lower in Fontan subjects compared to controls.
Carotid, celiac, and superior mesenteric arterial flows were preserved in Fontan subjects.
Systemic blood flow correlated with iliac flow and maximal exercise performance in Fontan subjects.
Abstract
Accumulation of progressive extracardiac disease is nearly universal for patients with single ventricle heart disease palliated to a Fontan circulation; however, etiologies are poorly understood. Limited flow reserve in the Fontan circulation may underlie extracardiac disease found in Fontan physiology through reduced oxygen and nutrient delivery to the tissues. This study aimed to determine regional flow volumes and oxygen delivery to key organ systems in children and adolescents with a Fontan circulation. In 17 Fontan subjects and 14 biventricular controls, regional arterial flow volumes to the carotid, celiac, superior mesenteric, renal, and iliac arteries were quantified with magnetic resonance imaging. Arterial oxygen content was calculated using subject hemoglobin level and pulse oximetry, and regional oxygen delivery was calculated using regional flow volume and oxygen content…
Genes, proteins, chemicals, diseases, species, mutations and cell lines named across the full text — each resolved to its canonical identifier and authoritative record.
Click any figure to enlarge with its caption.
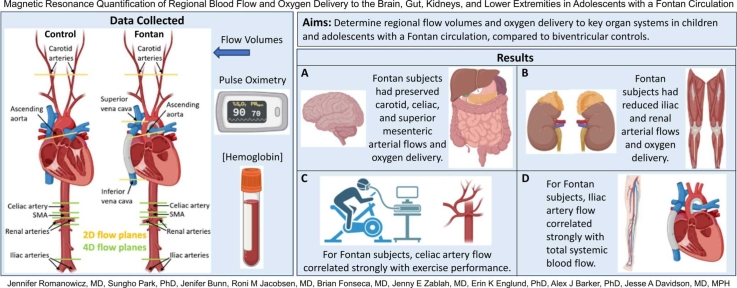 Figure 1
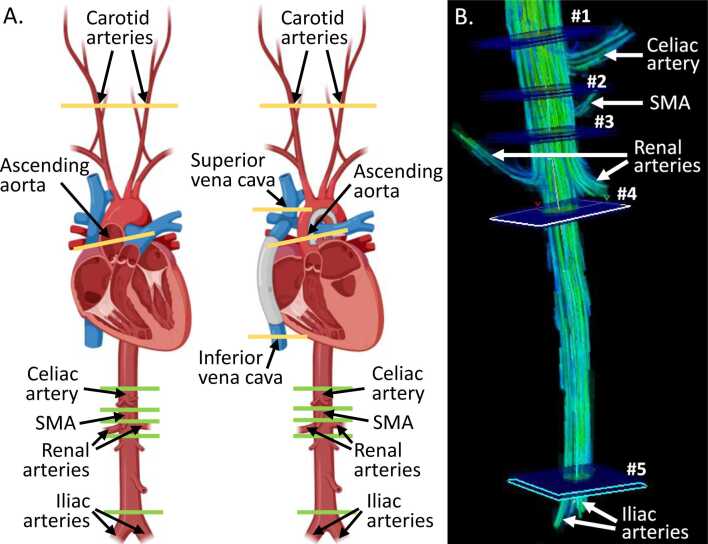 Figure 2
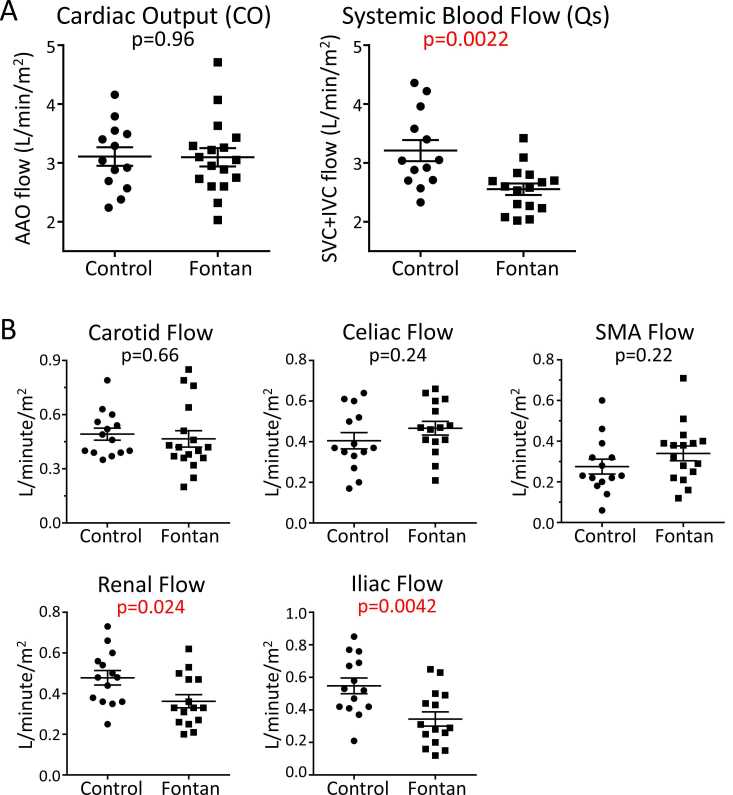 Figure 3
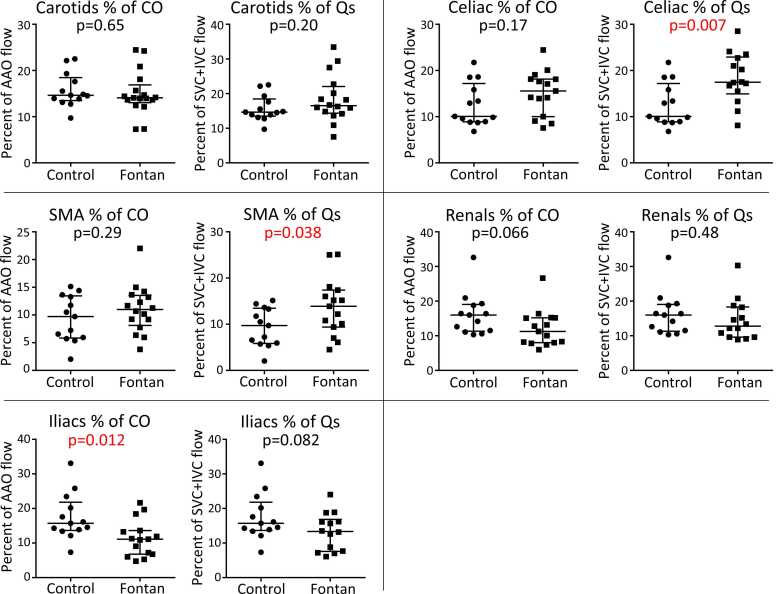 Figure 4
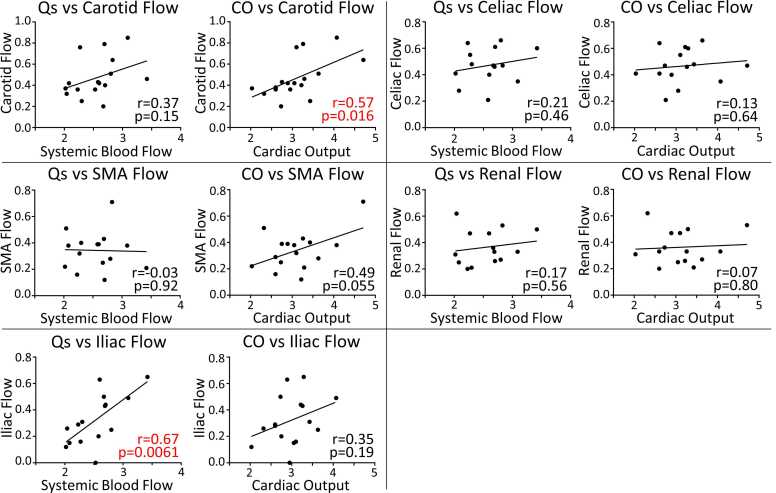 Figure 5
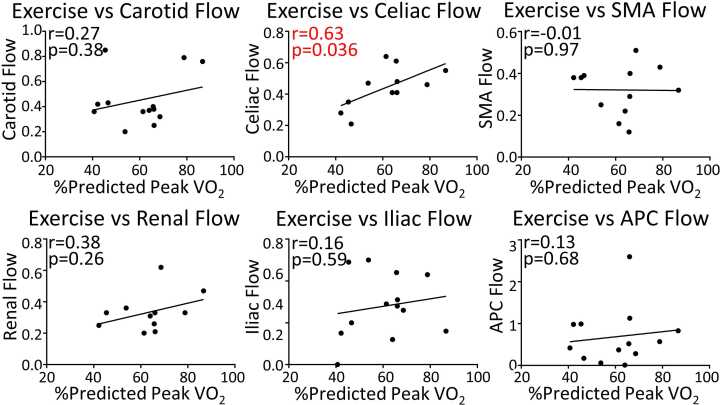 Figure 6
Peer Reviews
No public reviews on file for this paper yet. If you reviewed it on a platform where reviews are public (OpenReview, ICLR, NeurIPS, ICML), you can paste yours below so the community can read it here.
Videos
No videos yet. Explain this paper in a talk, walkthrough, or lecture? Add one.
Taxonomy
TopicsCongenital Heart Disease Studies · Mechanical Circulatory Support Devices · Cardiac Arrhythmias and Treatments
Introduction
1
Children with single ventricle heart disease undergo palliation to the Fontan circulation, which eliminates the sub-pulmonary ventricle, creating passive pulmonary blood flow and chronic systemic venous hypertension. Accumulation of extracardiac disease is nearly universal after the Fontan procedure, contributing to reduced quality and length of life [1]. The pathophysiology of Fontan-associated extracardiac disease is poorly understood.
The Fontan circulation is a low cardiac output (CO) state [1], [2]. Limited flow reserve has been demonstrated, especially with exercise or significant collateral vessels [3], [4], leading to insufficient oxygen/nutrient supply to the tissues. Inadequate tissue perfusion and venous congestion are hypothesized to underlie many Fontan-associated extracardiac pathologies [2]. However, the characterization of regional blood flow and oxygen delivery in the Fontan circulation is limited.
Our study aimed to utilize magnetic resonance imaging (MRI) to quantify regional flow volumes and oxygen delivery to the brain, gut, kidneys, and legs in adolescents with a Fontan circulation, and to compare these findings to biventricular controls.
Methods
2
This study was approved by the Colorado Multiple Institutional Review Board. Informed consent was obtained.
Study participants were identified from the cardiovascular magnetic resonance (CMR) imaging schedule. For the Fontan cohort, all single ventricle lesions were included. For the control group, inclusion criteria were normal cardiac anatomy, normal biventricular systolic function, and at most mild valvular disease. Exclusion criteria for both groups were anesthesia, anxiolysis, or supplemental oxygen during the CMR.
Clinical data
2.1
Clinical data were obtained from the electronic health record and included demographics, exercise testing results, and cardiac anatomy. Exercise data were taken from the test closest to the CMR. Before the CMR, participants were asked about the timing of their last food intake, and blood was drawn for hemoglobin measurement. Arterial oxygen saturation was measured via pulse oximetry during the CMR.
Global flow
2.2
Flow volumes were quantified on a 1.5T scanner (Philips Ingenia, Best, The Netherlands) after the injection of gadolinium-based contrast (Gadovist 1.0, Bayer, Mississauga, Ontario, Canada) (Fig. 1). Post-processing was completed in Circle CVI (Circle Cardiovascular Imaging, Calgary, Alberta, Canada). CO was measured by ascending aorta flow. Systemic blood flow (Qs) was calculated by adding inferior and superior venae cavae flows. Aortopulmonary collateral (APC) flow was calculated by subtracting Qs from CO [3]. Flows were obtained with two-dimensional (2D) phase-contrast (PC)-MRI and indexed to body surface area (BSA), which was calculated using the Haycock formula.Fig. 1. Location of flow measurements for control (left) and Fontan (right) subjects (A) and representative abdominal 4D flow image (B). 2D phase-contrast (PC) sequences were planned in planes shown in yellow to measure carotid arterial and ascending aorta flow in both groups and superior and inferior venae cavae in the Fontan group. Abdominal flow volumes were obtained from a single 4D PC sequence covering the descending aorta from the diaphragm to the aortic bifurcation. Planes where through-plane flow volume was measured on post-processing are shown in green (A) and labeled #1–5 (B). Descending aorta flow volumes above/below the branches of interest were subtracted to determine flow to the celiac, superior mesenteric (SMA), and renal arteries. Iliac arterial flow was measured directly just above the aortic bifurcation. Panel A was created in https://BioRender.com. Panel B demonstrates flow as velocity-coded streamlines (created with EnSight, CEI, Kansas City, Missouri). 2D two-dimensional, 4D four-dimensionalFig. 1
Regional flow
2.3
Carotid arterial flow was quantified by 2D PC-MRI. The remaining flows were extracted from a 4D flow PC-MRI sequence covering the descending aorta from the diaphragm to the aortic bifurcation (voxel size 2.5 mm^3^, echo time 2.8 ms, repetition time 4.8 ms, flip angle 14°, velocity sensitivity encoding 120 m/s, 18 reconstructed cardiac phases, nominal temporal resolution 48 ms). Celiac, superior mesenteric, and renal arterial flow volumes were calculated by subtracting aortic flow volumes above and below the branch(es) of interest. Iliac arterial flow volume was measured just above the aortic bifurcation. Eddy current correction and noise filtering were performed during post-processing.
Regional oxygen delivery
2.4
Oxygen delivery is the product of arterial flow volume and blood oxygen content. To calculate regional oxygen delivery, we utilized our regional arterial flow volumes. Blood oxygen content was calculated as follows: oxygen content (mL oxygen/L blood) = 1.34 mL oxygen/gm hemoglobin * hemoglobin concentration (gm/L) * oxygen saturation/100. Because subjects were in room air, dissolved oxygen was presumed negligible and omitted from the oxygen content calculation.
Statistical analysis
2.5
Normal distributions of the data were confirmed by Shapiro-Wilk normality tests. Differences in flow and oxygen delivery between groups were assessed by unpaired Student’s t-tests with a significance threshold of p ≤ 0.05. Relationships between flows or with exercise performance were assessed by Pearson correlations. Multiple comparisons adjustments were not performed as the intention of this initial pilot study is to be signal inclusive as a hypothesis-generating step for future investigations.
Results
3
Seventeen Fontan subjects and 14 controls were enrolled between August 2023 and October 2024. There was no difference in sex, age, weight, or BSA between groups; however, controls were taller (Table 1). The Fontan group had lower oxygen saturation and higher hemoglobin concentration such that there was no difference between groups in arterial oxygen content. Median time between exercise testing and CMR was 12.5 days (interquartile range 2.5–115.5 days, total range 0 days to 7 months).Table 1. Demographics and baseline characteristics.Table 1. Control (N = 14)Fontan (N = 17)p-valueMale sex6 (43%)9 (53%)0.58Age (years)16.2 (0.8)14.2 (0.9)0.10Weight (kg)65.6 (8.8)62.2 (5.4)0.74Height (cm)170.6 (3.7)157.5 (3.5)0.016Body surface area (m^2^)1.74 (0.13)1.64 (0.09)0.49Oxygen saturation (%)96.2 (0.3)89.4 (0.8)<0.0001Hemoglobin (gm/dL)14.7 (0.4)16.0 (0.3)0.016Oxygen content (mL O_2_/L)189.7 (4.5)192.0 (4.4)0.73Cardiac morphology Single right ventricle7 (41%) Single left ventricle10 (59%)Indication for CMR Bicuspid aortic valve7 (50%) Other aortopathy risk2 (14%) Family history cardiomyopathy3 (21%) Other2 (14%)Data are presented as N (%) or mean (standard error of the mean).CMR cardiovascular magnetic resonanceSignificant p-values are shown in bold font.
Global flow
3.1
Qs was lower in the Fontan group compared to controls (Fig. 2A). There was no difference in CO between groups. Neither CO nor Qs was associated with exercise performance as measured by percent-predicted peak oxygen consumption (VO_2_).Fig. 2. Global (A) and regional (B) flow volume comparisons between cases and controls. Data are displayed as mean with standard error of the mean. Unpaired t-tests were used to compare flows between groups and the p-value is displayed. All flows were indexed to body surface area. SMA superior mesenteric artery, AAO ascending aorta, SVC superior vena cava, IVC inferior vena cavaFig. 2
Regional flow
3.2
Renal and iliac flow volumes were lower in the Fontan group than in controls (Fig. 2B). There was no difference between groups for carotid, celiac, and superior mesenteric arterial flow. Celiac and superior mesenteric arterial flow accounted for a higher percentage of Qs for the Fontan group than controls (Fig. 3). Iliac arterial flow accounted for a lower percentage of CO for the Fontan group than controls. For both cases and controls, there was no relationship between iliac flow volume and height.Fig. 3. Regional flow volumes standardized to global flow. Data are displayed as mean with standard error of the mean. Unpaired t-tests were used to compare flows between groups and the p-value is displayed. Flows were standardized to either cardiac output (CO) which was calculated by ascending aorta (AAO) flow or systemic blood flow (Qs) which was calculated by adding superior (SVC) and inferior (IVC) venae cavae. SMA superior mesenteric arteryFig. 3
To assess for relationships between APC flow and regional flows in the Fontan group, regional flow volumes were standardized to CO and APC flow indexed to BSA, as previously described [3]. There were no significant associations between APC flow and any of the regional flows (Table 2).Table 2. Association of aortopulmonary collateral (APC) flow with regional flows.Table 2rp-valueCarotid flow (% of cardiac output)0.020.94Celiac flow (% of cardiac output)−0.300.28SMA flow (% of cardiac output)0.100.71Renal flow (% of cardiac output)−0.290.30Iliac flow (% of cardiac output)−0.290.29Pearson correlation r and p-values are presented for the relationship between aortopulmonary collateral flow and the listed variables. Regional flows are indexed to total cardiac output. APC flow is indexed to body surface areaSMA superior mesenteric artery
We evaluated for associations between global flow and regional flow (Fig. 4). In the Fontan group, carotid flow correlated strongly with CO, iliac flow correlated strongly with Qs, and there were no other significant correlations. For controls, none of the regional flows were associated with global flow.Fig. 4. Associations between regional and global flows in the Fontan group. All flows are indexed to body surface area and measured in liters per minute per meter squared. The r and p values from the Pearson correlation are shown on the graph. A linear regression line is shown for each association. CO cardiac output, Qs systemic blood flow, SMA superior mesenteric arteryFig. 4
Finally, in the Fontan group, we assessed for relationships between regional flows and exercise performance as measured by percent-predicted peak VO_2_ (Fig. 5). Celiac flow correlated with exercise performance. There were no other significant associations.Fig. 5. Associations between regional flows and exercise performance in the Fontan group. All flows are indexed to body surface area. The r and p values from the Pearson correlation are shown on the graph. A linear regression line is shown for each association. Exercise performance is represented by percent-predicted peak oxygen consumption (VO_2_). SMA superior mesenteric artery, APC aortopulmonary collateralFig. 5
Regional oxygen delivery
3.3
Regional oxygen delivery was lower to the renal and iliac arteries in the Fontan group compared to controls (Table 3). There was no difference between groups for the carotid, celiac, and superior mesenteric arteries.Table 3. Regional oxygen delivery.Table 3. FontanControlp-valueCarotid arteries88.9 (8.3)93.0 (6.0)0.70Celiac artery89.7 (7.3)76.0 (7.4)0.19Superior mesenteric artery65.2 (6.5)52.5 (7.2)0.20Renal arteries70.0 (6.7)91.5 (7.8)0.046Iliac arteries62.8 (8.7)104.7 (10.2)0.0041Data are presented as mean (standard error of the mean). All values are presented in milliliters of oxygen per minute per meter squared. Significant p-values are shown in bold font.
Discussion
4
Extracardiac disease is nearly ubiquitous in the Fontan population; however, its etiology is poorly understood. We sought to quantify regional flow volumes and oxygen delivery to elucidate the metabolic substrate seen by end-organ systems in the Fontan circulation as a possible nidus for pathophysiology. We found no difference in CO between groups; however, loss of flow to collaterals resulted in lower Qs in the Fontan group. Despite lower Qs, regional flow volumes to the carotid, celiac, and superior mesenteric arteries were preserved. Renal and iliac flow volumes were decreased for the Fontan group, which may be explained by increased renal and iliac impedance demonstrated by Hauser et al., in an adult Fontan population [5]. Because oxygen content was equivalent between groups, regional oxygen delivery mirrored regional flows.
Reduced CO is described as a hallmark of the Fontan circulation [1]. Presumably, the intention of this description lies in the Fontan circulation’s reduced ability to augment CO with activity. However, it is worth explicitly stating that in our adolescent Fontan cohort, CO matched that of biventricular controls while at rest, which is a departure from the traditional description of Fontan physiology, but consistent with other recent studies [6]. Previous studies of abdominal regional flow in the Fontan circulation have been mixed with some demonstrating reduced celiac and superior mesenteric flow for Fontan subjects [7], [8] and another demonstrating no difference from controls [5]. In contrast, our results demonstrate a trend toward increased flow in these arteries. Further research is necessary to determine the source of heterogeneity in splanchnic blood flow in the Fontan circulation.
Our results are consistent with a limited flow reserve in the Fontan circulation. Iliac flow correlated with overall Qs in the Fontan group, a relationship not observed in controls. Therefore, in Fontan participants, those with the lowest Qs had the least iliac flow. The iliac arteries primarily supply the lower extremity muscles, and thus our data suggest that skeletal muscle perfusion is reduced to maintain perfusion to crucial organ systems. Importantly, our subjects were imaged at rest. Next steps include measuring regional flow volumes with the addition of exercise to stress the perfusion reserve observed in our Fontan cohort.
The relationship between increased celiac flow and better exercise performance is not entirely clear. In normal exercise physiology, splanchnic flow decreases proportionally to exercise intensity to provide flow reserve to active limbs [9]. It is possible that those Fontan patients with greater celiac flow at rest are able to supplement flow reserve more robustly during exercise. This observation further underscores the need for regional flow analysis with exercise in the Fontan population.
Limitations
4.1
Limitations include the inability to control for different medications and complications within the Fontan group due to sample size. Heterogeneity observed within the Fontan group requires future exploration with a larger cohort to power within-group comparisons. Due to the sample size, this study may be vulnerable to both type 1 and type 2 errors and we encourage further studies to validate and expand upon our findings. Additionally, prandial status was collected, but controlling this variable was not part of our experimental design. Celiac and superior mesenteric artery flow volumes increase after a meal [10]; however, both peak in the first hour and none of our subjects had eaten in the 3 hours before the CMR. Thus, we expect this source of heterogeneity to be minimal. There was a statistically non-significant trend toward a younger Fontan cohort, and with unmeasured potential differences in pubertal status, it is possible there were differences in muscle bulk or other hemodynamic contributors that were not completely controlled for by standardizing flows to BSA. The average oxygen saturation for the Fontan group was 89% which is at the lower end of the typical range for Fontan patients (90–95%); this may represent a negligible difference, inclusion of a younger cohort more likely to have a patent fenestration, the effects of moderate altitude (∼5400 ft), or an increased incidence of systemic-to-pulmonary venovenous collaterals or pulmonary arteriovenous malformations; any of which may affect generalizability. Finally, potential abdominal vascular variant anatomy may have gone undetected. Although the celiac trunk gives rise to its three main branches (gastric, hepatic, and splenic arteries) 89–94% of the time, one or both inferior phrenic artery arises from the celiac trunk in up to 40% of cases [11]. Our imaging resolution was not sufficient to assess the inferior phrenic artery origins. Additionally, supernumerary renal arteries occur in up to 30% of individuals [12]. Renal blood flow was measured as the difference in descending aorta flow above and below renal arteries, so the majority of supernumerary renal arteries would have been included as they arise near to each other. Rare small polar renal arteries that arise distant from the other renal arteries likely went undetected and were excluded from calculations.
Conclusions
4.2
The Fontan circulation is a state of limited perfusion reserve. At rest, Fontan patients experience reduced flow and oxygen delivery to the kidneys and lower extremities but maintain normal flow and oxygen delivery to the gut and brain. Future research evaluating regional flow and oxygen delivery with the addition of exercise is necessary to understand the full impact of this limited flow reserve on individual organ systems that are so vulnerable to disease in the Fontan population.
Author contributions
Jenny E. Zablah: Writing – review & editing. Brian Fonseca: Writing – review & editing. Alex J. Barker: Writing – review & editing, Resources, Methodology, Formal analysis, Data curation, Conceptualization. Erin K. Englund: Writing – review & editing, Methodology. Jesse A. Davidson: Writing – review & editing, Writing – original draft, Visualization, Methodology, Funding acquisition, Formal analysis, Conceptualization. Sungho Park: Writing – review & editing, Data curation. Jennifer Romanowicz: Writing – review & editing, Writing – original draft, Visualization, Resources, Project administration, Methodology, Investigation, Funding acquisition, Formal analysis, Data curation, Conceptualization. Roni M. Jacobsen: Writing – review & editing. Jenifer Bunn: Writing – review & editing, Project administration, Data curation.
Ethics approval and consent
Permission to conduct the study was granted by the Colorado Multiple Institutional Review Board on April 9, 2023 (COMIRB 23-0451). Written informed consent was obtained from each subject (or subject's legal guardian with subject assent if younger than 18 years old) at enrollment for both cases and controls. The research was conducted in accordance with the principles embodied in the Declaration of Helsinki and in accordance with local statutory requirements.
Declaration of competing interests
The authors declare that they have no known competing financial interests or personal relationships that could have appeared to influence the work reported in this paper.
The reference list from the paper itself. Each links out to its DOI / PubMed record.
- 1Rychik J.Atz A.M.Celermajer D.S.Deal B.J.Gatzoulis M.A.Gewillig M.H.Evaluation and management of the child and adult with Fontan circulation: a scientific statement from the American Heart Association Circulation 1402019 e 234e 2843125663610.1161/CIR.0000000000000696 · doi ↗ · pubmed ↗
- 2Rychik J.The relentless effects of the Fontan paradox Semin Thorac Cardiovasc Surg Pediatr Card Surg Annu 19201637432706004110.1053/j.pcsu.2015.11.006 · doi ↗ · pubmed ↗
- 3Fogel M.A.Donnelly E.Crandell I.Hanlon A.Whitehead K.K.Harris M.Cerebral blood flow, brain injury, and aortic-pulmonary collateral flow after the Fontan operation Am J Cardiol 20820231641703784451910.1016/j.amjcard.2023.08.023 · doi ↗ · pubmed ↗
- 4Vandekerckhove K.Coomans I.Moerman A.Panzer J.De Groote K.De Wilde H.Differences in cerebral and muscle oxygenation patterns during exercise in children with univentricular heart after Fontan operation compared to healthy peers Int J Cardiol 290201986923113343110.1016/j.ijcard.2019.05.040 · doi ↗ · pubmed ↗
- 5Hauser J.A.Jones A.Pandya B.Taylor A.M.Muthurangu V.Comprehensive MRI assessment of the cardiovascular responses to food ingestion in Fontan physiology Am J Physiol - Hear Circ Physiol 3192020 H 808H 813
- 6Charla P.Karur G.R.Yamamura K.Yoo S.J.Granton J.T.Oechslin E.N.Augmentation of pulmonary blood flow and cardiac output by non-invasive external ventilation late after Fontan palliation Heart 10720211421493274879910.1136/heartjnl-2020-316613 PMC 7788264 · doi ↗ · pubmed ↗
- 7Lam C.Z.David D.Izquierdo L.A.Pezeshkpour P.Dipchand A.I.Jean-St-Michel E.MRI phase-contrast blood flow in fasting pediatric patients with Fontan circulation correlates with exercise capacity Radiol Cardiothorac Imaging 42022 e 210303
- 8Caro-Dominguez P.Chaturvedi R.Chavhan G.Ling S.C.Yim D.Porayette P.Magnetic resonance imaging assessment of blood flow distribution in fenestrated and completed Fontan circulation with special emphasis on abdominal blood flow Korean J Radiol 202019118611943127098210.3348/kjr.2018.0921 PMC 6609425 · doi ↗ · pubmed ↗