Adaptive evolution and phylogeny of cerithioid gastropods with six new mitogenomes
Cho Rong Shin, Eun Hwa Choi, Ui Wook Hwang

TL;DR
This study uses six new mitochondrial genomes to explore the evolutionary history and adaptation of cerithioid snails, revealing how climate changes shaped their diversification and habitat shifts.
Contribution
The paper introduces six new mitogenomes and identifies adaptive evolution in euryhaline gastropods, refining phylogenetic relationships and highlighting climate-driven diversification.
Findings
Phylogenetic analyses support Cerithioidea's monophyly and two major lineages but leave family-level relationships partially unresolved.
Divergence-time estimates link lineage origins to warm climate periods and subsequent diversification with environmental changes.
ND6 gene shows positive selection, especially in disordered regions, suggesting adaptive flexibility under environmental stress.
Abstract
Cerithioidea (Caenogastropoda: Gastropoda) represents a diverse superfamily of gastropods that inhabit marine, brackish, and freshwater environments worldwide. Despite this broad ecological distribution, their evolutionary history and phylogenetic relationships remain incompletely understood. Here, we report six newly sequenced mitochondrial genomes—two from Batillaria (Batillariidae) and four from Cerithidea, Cerithideopsis, and Pirenella (Potamididae)—to clarify cerithioidean phylogeny and investigate signals of adaptive evolution. Phylogenetic analyses consistently supported the monophyly of Cerithioidea and its subdivision into two major lineages. However, family-level relationships remained partially ambiguous. Batillariidae clustered with Pachychilidae, and Potamididae appeared as sister to Semisulcospiridae in most trees, underscoring the need for broader taxonomic sampling to…
Genes, proteins, chemicals, diseases, species, mutations and cell lines named across the full text — each resolved to its canonical identifier and authoritative record.
Click any figure to enlarge with its caption.
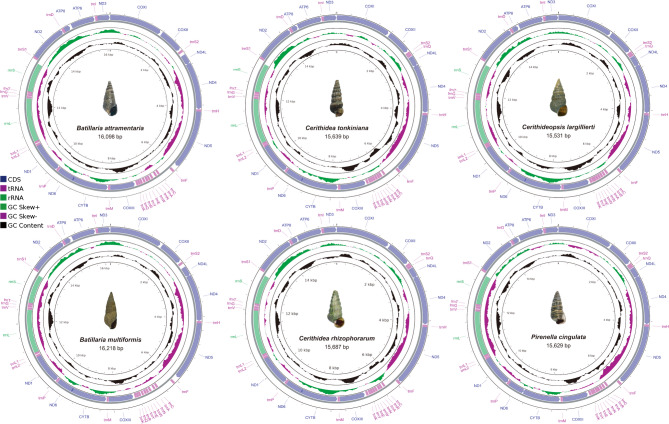 Figure 1
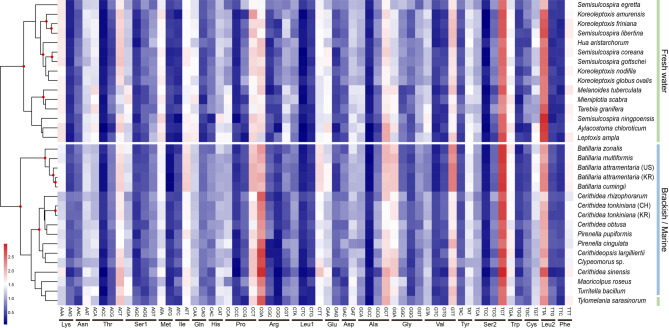 Figure 2
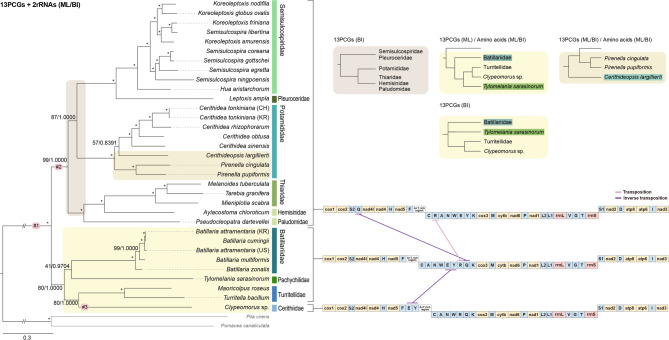 Figure 3
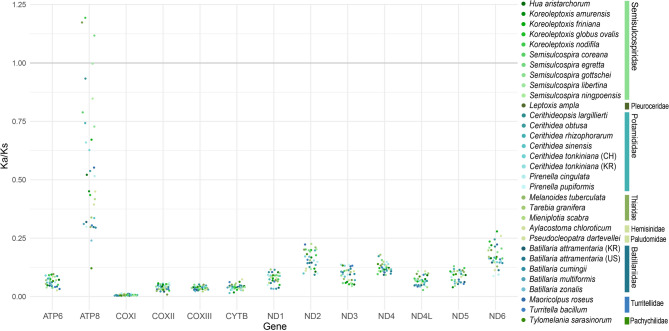 Figure 4
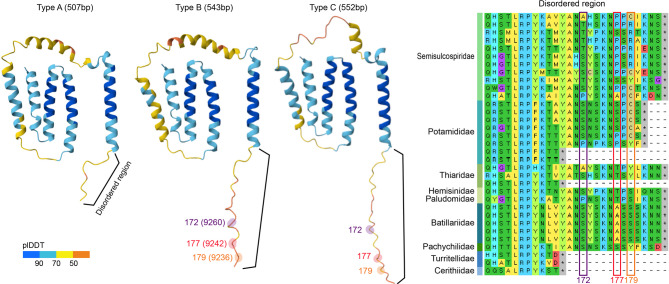 Figure 5
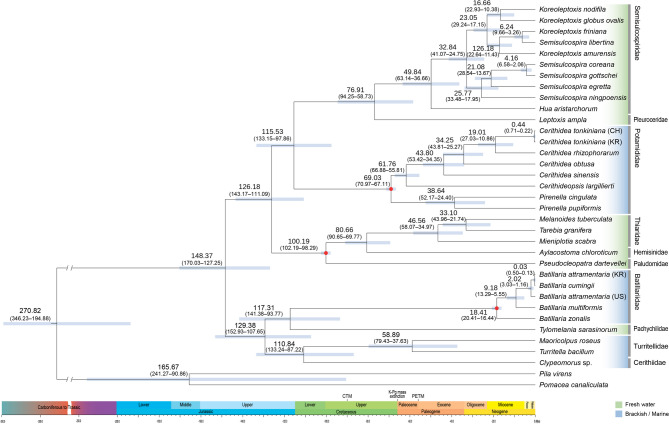 Figure 6
- —https://doi.org/10.13039/501100003725National Research Foundation of Korea
Peer Reviews
No public reviews on file for this paper yet. If you reviewed it on a platform where reviews are public (OpenReview, ICLR, NeurIPS, ICML), you can paste yours below so the community can read it here.
Videos
No videos yet. Explain this paper in a talk, walkthrough, or lecture? Add one.
Taxonomy
TopicsAquatic Invertebrate Ecology and Behavior · Marine Biology and Ecology Research · Protist diversity and phylogeny
Introduction
The superfamily Cerithioidea Fleming, 1822 (Caenogastropoda, Gastropoda, Mollusca) is among the most taxonomically and ecologically diverse caenogastropod lineages, being comprised by over 1,500 extant species across 22 families and 175 genera worldwide^1^. These snails inhabit a wide range of aquatic environments, including marine, brackish, and freshwater environments, throughout tropical and temperate regions^2^. Their remarkable ecological breadth and morphological diversity make them a key group for studying evolutionary transitions in gastropods. As one of the basal clades within Caenogastropoda, which includes most modern gastropod species^3^, Cerithioidea provides critical insights into the early diversification of this major molluscan subgroup.
Phylogenetic analyses integrating morphological and molecular datasets have revealed multiple independent transitions between marine and non-marine environments within Cerithioidea^2^. Despite this, familial relationships within this superfamily remain incompletely resolved, and deeper divergences within the group are poorly understood. Morphology-based studies^4,5^ have enhanced our understanding of cerithioidean relationships; however, high phenotypic plasticity has often led to inconsistent or conflicting topologies. Lydeard et al.^6^ produced the first comprehensive molecular phylogeny of Cerithioidea, using partial 16S rRNA sequences to investigate inter-familial relationships. Subsequently, Strong et al.^2^ further analyzed these relationships incorporating 16S rRNA, 28S rRNA, and morphological data, proposing three major cerithioidean clades. However, both studies struggled to resolve the monophyly of certain clades due to limited phylogenetic resolution and low support values. Furthermore, Forestello et al.^7^ reexamined cerithioidean phylogeny by incorporating additional 16S rRNA and 28S rRNA data using maximum likelihood (ML) and Bayesian inference (BI) frameworks. Although their analysis confirmed the monophyly of several previously unresolved groups, some relationships remained ambiguous, and certain nodes showed low support values. Collectively, these findings underscore the need for more comprehensive molecular data, particularly complete mitochondrial genomes (mitogenomes), to clarify unresolved evolutionary relationships within Cerithioidea.
In recent years, mitogenomes have emerged as a powerful tool in invertebrate systematics and evolutionary biology^8,9^. Due to their relatively conserved structure and gene content, mitogenomes provide extensive phylogenetic information and enable the detection of lineage-specific features, such as gene rearrangements and unique substitution patterns^10^. Although recent studies have identified novel gene orders and other evolutionary signatures in cerithioidean mitogenomes^11,12^, taxonomic sampling remains limited across several key lineages. Moreover, growing evidence suggests that positive selection on mitochondrial protein-coding genes (PCGs) can drive adaptations in response to fluctuating environmental conditions, particularly temperature and salinity gradients, among marine and brackish invertebrates^13,14^. Mitochondrial genes, which play a critical role in oxidative phosphorylation, are subject to selective pressures that optimize metabolic efficiency under varying ecological constraints^15^. For instance, several marine invertebrate lineages show signs of positive selection in genes such as ATP6, ATP8, and NADH dehydrogenase subunits, likely reflecting adaptations to maintain respiratory efficiency under challenging or novel conditions^16^. These findings support the notion that mitochondrial adaptations can evolve relatively rapidly, offering a selective advantage in environments characterized by fluctuating energetic demands. Investigating similar patterns in Cerithioidea may reveal how historical and contemporary selective pressures have influenced mitochondrial function in euryhaline gastropods, promoting resilience and diversification across marine and brackish environments.
Here, we present the complete mitochondrial genomes of two batillariid and four potamidid species to help resolve phylogenetic relationships within Cerithioidea and to examine patterns of molecular evolution in mitochondrial PCGs. By integrating molecular phylogenetics with evolutionary rate analyses, we aim to reconstruct the evolutionary history of these lineages and examine how long-term environmental changes may have influenced their diversification. Ultimately, this work enhances our understanding of mitogenome evolution and lineage diversification in euryhaline gastropods.
Results
Mitochondrial genomes and organization of six cerithioid species
The complete mitochondrial genomes of the two batillariid species, Batillaria attramentaria and B. multiformis, measured 16,098 bp and 16,218 bp, respectively (Fig. 1). Both species exhibited the typical gene complement of molluscan mitogenomes, consisting of 13 PCGs, 22 transfer RNA (tRNA) genes, and two ribosomal RNA (rRNA) genes^10,17^. Variation in genome length between the two species was minimal within coding regions; observed differences were primarily limited to non-coding regions, particularly the putative control region. In both Batillaria species, all PCGs initiated with ATG and terminated with either TAA or TAG (Supplementary Tables S2–S3). An extended A + T-rich region was identified between trnF and trnC, consistent with non-coding control regions described in other gastropods. Both species exhibited a 7 bp overlap between nad4l and nad4, and 47 bp overlap between cytb and nad6 (Supplementary Tables S2–S3). The complete mitochondrial genomes of the four potamidid species measured 15,639 bp in Cerithidea tonkiniana, 15,687 bp in C. rhizophorarum, 15,531 bp in Cerithideopsis largillierti, and 15,632 bp in Pirenella cingulata (Fig. 1). All four species utilized ATG as a start codon, except for nad4 in P. cingulata (GTG) and nad6 in C. rhizophorarum (ATT). All PCGs terminated with either TAA or TAG (Supplementary Tables S4–S7), and gene lengths were generally conserved across species, with the exception of nad6. Three species contained a 543 bp-long nad6, whereas P. cingulata possessed a shorter nd6 (507 bp), consistent with P. pupiformis^11^. Similar to Batillariidae, gene overlaps were observed in Potamididae, including 7 bp overlap between nad4l and nad4, and 38 bp overlap between cytb and nad6. However, in P. cingulata, only a 1 bp-long overlap was observed between cytb and nad6, whereas the 7 bp overlap between nad4l and nad4 remained. All four potamidid species also contained a long non-coding region between trnF and trnC (Supplementary Tables S4–S7).Fig. 1. Mitochondrial genome maps of six cerithioidean species. The central image shows a specimen of each species. Circular maps illustrate genomic features: (1) the black ring indicates GC content; (2) the green-purple ring shows GC skew values, where green/purple color intensity reflects the degree of skew; (3) the outer and inner rings depict the arrangement of genes. Genes on the outer ring are encoded on the forward strand, while genes on the inner ring reside on the reverse strand. Different colors denote protein-coding genes (PCGs), ribosomal RNAs (rRNAs), and transfer RNAs (tRNAs).
Despite the generally conserved arrangement of PCGs, Batillariidae and Potamididae exhibited differences in the positioning of certain tRNA genes. In Batillariidae, trnR is located on the light strand between trnC and trnQ, whereas in Potamididae it is situated between trnC and trnA. Additionally, trnQ is positioned between trnR and trnK on the light strand in Batillariidae, but occurs between trnS2 and nad4l on the heavy strand in Potamididae. Most tRNA genes formed the typical cloverleaf structure, including the amino acid acceptor stem, TψC stem, anticodon stem, and DHU stem (Supplementary Figs. S1–S6). The two batillariid species exhibited identical nucleotide lengths for all tRNA genes and shared identical sequences for trnC, trnL2, trnR, trnS1, trnY, trnW, and trnN (Supplementary Figs. S1–S2). In contrast, the four potamidid species showed minor length variations (1–3 bp) in several tRNAs, and trnS1 exhibited a truncated structure lacking a DHU arm (Supplementary Figs. S3–S6).
The overall nucleotide compositions of the complete mitochondrial genomes and the 13 PCGs across the six cerithioidean species are summarized in Table 1. All species demonstrated a pronounced A + T bias (62.51–65.56%), consistent with patterns observed in other molluscan mitogenomes^14,18^. AT skew values were negative in all species, indicating a higher proportion of thymine (T) than adenine (A). GC skew values were predominantly negative, except in C. rhizophorarum and Ce. largillierti, which exhibited slightly positive values, suggesting a marginal excess of guanine (G) over cytosine (C). Within PCG regions, the A + T content remained high (62.30–66.61%), with even more negative AT skew values, reflecting a stronger T bias in coding sequences, a pattern frequently reported in Caenogastropoda^17,19^.Table 1. Nucleotide composition of the complete mitochondrial genomes and protein-coding genes (PCGs) of six cerithioidean species.Total mitochondrial genomePCGsLength(bp)A + T (%)G + C (%)AT skewGC skewLength(bp)A + T (%)G + C (%)AT skewGC skewB. multiformis16,09865.5634.44− 0.0764− 0.019111,30764.3135.65− 0.2225− 0.0265B. attramentaria16,21865.2134.79− 0.0726− 0.035111,30764.9935.01− 0.2186− 0.0265C. tonkiniana15,63963.1636.84− 0.0711− 0.003611,28362.3237.68− 0.2076− 0.0289C. rhizophorarum15,68762.5137.49− 0.07730.014511,28364.7935.21− 0.2194− 0.0239Ce. largillierti15,53164.4335.57− 0.07960.007211,28366.6136.39− 0.1924− 0.0360P. cingulata15,62963.0836.92− 0.0481− 0.048711,24762.3037.70− 0.2028− 0.0307
To assess codon usage across species, a heatmap of relative synonymous codon usage (RSCU) values with a hierarchical clustering dendrogram was generated (Fig. 2). Overall, the six cerithioidean species displayed similar codon usage patterns, with a marked preference for A or T at the third codon position. Despite minor exceptions, the dendrogram generally grouped freshwater and marine species separately, suggesting potential associations between codon usage bias and habitat type, as previously reported^20^.Fig. 2. Heatmap of Relative Synonymous Codon Usage (RSCU) for 13 mitochondrial protein-coding genes from Cerithioidea. Data are based on six Cerithioidea mitochondrial genomes. The dendrogram above the heatmap clusters species according to codon usage similarity, using Ward’s method and Euclidean distance. Red dots on branches mark clusters with approximately unbiased (AU) p-values > 95%, indicating strong statistical support. Species labels are color-coded by habitat type (freshwater, brackish/marine) to highlight potential associations between codon usage patterns and environmental conditions.
Phylogenetic relationships of Cerithioidea
Phylogenetic trees reconstructed using ML and BI approaches yielded largely congruent topologies across the three datasets (PCGs + rRNAs, PCGs only, amino acids). The resulting relationships were consistent among analytical methods (Fig. 3). All major cerithioidean families, Batillariidae, Potamididae, and Semisulcospiridae, emerged as strongly supported, monophyletic clades. However, certain taxa adjacent to Batillariidae (e.g., Turritellidae, Cerithiidae, Pachychilidae) exhibited unstable placements and weak support values. Turritella sarasinorum formed a sister group to Batillariidae in the PCGs + rRNAs trees; however, it appeared paraphyletic in the ML tree using PCGs and in the amino acid-based analysis and collapsed in BI tree based on PCGs. Specifically, the PCGs + rRNAs trees supported the topology (Batillariidae + Pachychilidae) + (Turritellidae + Cerithiidae), whereas the other trees indicated ((Batillariidae + ((Turritellidae + Cerithiidae) + Pachychilidae))). In the BI tree based on PCGs, these families formed paraphyletic assemblages with low support. Although certain nodes were weakly supported, Potamididae consistently appeared as the sister group to Semisulcospiridae across nearly all datasets, except in the BI tree derived exclusively from PCGs, where Potamididae instead clustered with ((Thiaridae + Hemisinidae) + Paludomidae), albeit with very low bootstrap support. Within Potamididae, Cerithidea and Pirenella were both monophyletic, though interspecific relationships were somewhat unstable, particularly involving Ce. largillierti and P. cingulata. In the PCGs and amino acid-based trees, Ce. largillierti occupied the outermost position within Cerithidea, whereas Pirenella emerged as the basal taxon in the PCGs + rRNAs dataset.Fig. 3. Phylogenetic trees of Cerithioidea inferred from mitochondrial genome sequences. Trees were reconstructed from 13 protein-coding genes (PCGs) and two rRNA genes for 33 cerithioidean species, with two caenogastropod species as outgroups. Maximum Likelihood (ML) and Bayesian Inference (BI) analyses were performed on the nucleotide dataset based on 13 PCGs and 2 rRNAs. ModelFinder 2.2.0 selected the best-fit substitution models, and ML trees were generated via IQ-TREE with 10,000 ultrafast bootstrap replicates. BI trees were inferred using MrBayes (two runs of 10 million generations, sampling every 1,000). Convergence was assessed by the mean standard deviation of split frequencies (< 0.01). The final tree was visualized in FigTree v1.4.4. Nodes labeled #1–#3 indicate branches under positive selection as identified by the aBSREL analysis. Colored boxes highlight alternative topologies observed in different datasets.
Although the arrangements of PCG appeared largely conserved throughout Cerithioidea, tRNA organization varied at the earliest divergence points. In Turritellidae, Cerithididae, Pachychilidae, and Batillariidae, trnQ was located between trnR and trnK. In contrast, Semisulcospiridae, Potamididae, Thiaridae, Hemisinidae, and Paludomidae positioned trnQ between trnS2 and nad4l. Additionally, the location of trnR differed: it was found between trnY and trnQ in Turritellidae, Pachychilidae, and Batillariidae, and between trnW and trnQ in Cerithiidae (due to an inverted transposition, trnE–trnY). In Semisulcospiridae, Potamididae, Thiaridae, Hemisinidae, and Paludomidae, trnR was positioned between trnC and trnA (Fig. 3).
Adaptive evolution in mitochondrial protein-coding genes
Ka/Ks ratios (ω) were used to evaluate selective pressures on the 13 mitochondrial PCGs, with Clypeomorus sp. (Cerithiidae) serving as the reference (Fig. 4). A Ka/Ks ratio greater than 1 suggests potential positive selection, whereas a ratio close to 1 indicates neutral evolution, and a ratio less than 1 reflects purifying (negative) selection^21^. Except for atp8, which exhibited Ka/Ks ratios greater than 1 in two semisulcospirid species (Koreoleptoxis nodifila and Semisulcospira egretta) and one pleurocerid species (Leptoxis ampla), all other PCGs showed Ka/Ks ratios below 1, implying strong purifying selection. cox1 exhibited the lowest mean Ka/Ks (approximately 0.007), reflecting a high degree of conservation. Among the NADH dehydrogenase genes, nad6 showed slightly elevated Ka/Ks values, but remained under purifying selection.Fig. 4. Ka/Ks plot depicting selection pressure across 13 mitochondrial PCGs in Cerithioidea. For each of the 13 mitochondrial protein-coding genes, the ratio of nonsynonymous substitutions (Ka) to synonymous substitutions (Ks) was calculated. Ka/Ks > 1, suggesting potential signals of positive selection, are shown.
HyPhy analysis revealed pervasive purifying selection across all 13 PCGs in Cerithioidea. FUBAR detected predominantly neutral or negative selection, although two codons in nad6 suggested possible positive selection. MEME identified six codons under episodic positive selection, including three also highlighted by FUBAR (Table 2). CodeML analysis (PAML) provided further support for weak positive selection, with significant likelihood ratio test results for M0 vs. M3, M1a vs. M3, and M7 vs. M8 (p < 0.005), but not for M1a vs. M2a (p > 1). Although BEB analysis suggested an overall trend toward positive selection, no individual codon met the BEB significance threshold (p > 1).Table 2. Codons under positive selection inferred from site and branch-site models based on mitochondrial protein-coding genes in Cerithioidea.GeneSite modelsBranch-site modelsFUBARMEMEBEB analysis (M2a)Codon (PP)Codon (p value)Branch #1 (PP)Branch #2 (PP)Branch #3 (PP)cox22259 (0.991)nad42871 (0.994)2904 (0.984)3075 (0.984)3306 (0.048)3504 (0.964)3528 (0.989)3671 (0.974)4029 (0.984)nad54192 (0.990)4264 (0.988)4303 (0.980)**5647 (0.002)****5647 (0.960)cytb8146 (0.982)9058 (0.957)nad69236 (0.918)****9236 (0.020)**9239 (0.033)**9242 (0.965)****9242 (0.025)****9260 (0.984)****9260 (0.017)**9384 (0.961)9402 (0.986)9437 (0.966)9446 (0.968)9477 (0.997)9480 (0.976)nad110,013 (0.989)10,044 (0.963)10,494 (0.992)10,503 (0.986)nad213,662 (0.998)13,858 (0.985)14,410 (0.961)14,509 (0.979)14,536 (0.990)14,554 (0.966)atp814,852 (0.964)Codon positions refer to the nucleotide position (start codon numbers) in the B. attramentaria mitochondrial genome assembled in this study (PV619093). Branches showing signals of positive selection (p < 0.05) were initially identified using the aBSREL method and subsequently designated as foreground branches in the branch-site model of CodeML. Codons with posterior probability values exceeding 1.0 in the BEB analysis under the site model (M8), which are considered unreliable estimates, were excluded from the table.Significance of bold for positively selected sites was assessed using FUBAR (PP > 0.90), MEME (p < 0.05) in Datamonkey, and BEB in CodeML (PP > 0.95).
The aBSREL method identified three branches experiencing episodic diversifying selection (p < 0.05), which were subsequently examined using branch-site models in CodeML to detect positively selected codons. Several mitochondrial PCGs contained positively selected sites. In Branch #1, broadly separating freshwater and marine species, most sites under selection were located in nad2 and nad6. Branch #2, which marks the divergence of Semisulcospiridae and Potamididae from other taxa, exhibited one positively selected codon in cytb. Branch #3, marking the divergence of Cerithiidae, displayed the highest number of positively selected sites, primarily in nad2, nad4, and nad6. One codon in nad5 (no. 5647) identified by MEME as episodically selected was also confirmed in Branch #3.
Although certain codons were identified by only a single method (MEME, FUBAR, or BEB), sites were considered functionally significant only if supported by at least two independent approaches^22^. Three codons in nad6 consistently appeared in both FUBAR and MEME analyses, prompting further structural analysis (Fig. 5). AlphaFold predictions revealed that the protein’s fundamental α-helical and transmembrane domains were conserved, whereas disordered regions exhibited some variation. These findings suggest that although the fundamental structure of nad6 remains stable, adaptive changes may occur within flexible regions, reflecting functional adaptations to diverse environmental conditions.Fig. 5. Predicted 3D structure and disordered regions of the ND6 protein from Cerithioidea. The ND6 protein was modeled using AlphaFold, with structural confidence indicated by a color gradient (blue = higher confidence, yellow to red = lower confidence or disordered regions). The C-terminal portion exhibits an extended, disordered region implicated in regulatory flexibility. Sites under positive selection are highlighted on the 3D model and boxed in the sequence.
Divergence time estimation
Divergence time analyses suggest that Ampullarioidea (Architaenioglossa) and Cerithioidea diverged before Jurassic (346.23–194.88 million years ago). Within Cerithioidea, two principal lineages subsequently separated during the Middle Jurassic to Early Cretaceous (170.03–127.25 million years ago): one lineage comprising Turritellidae, Cerithiidae, Pachychilidae, and Batillariidae, and the other including Semisulcospiridae, Pleuroceridae, Potamididae, Thiaridae, Hemisinidae, and Paludomidae. Most family-level divergences occurred in the Middle Cretaceous, whereas genus- and species-level diversification peaked during the Upper Cretaceous to Paleocene. The genus Batillaria experienced rapid diversification following the Miocene (Fig. 6).Fig. 6. Time-calibrated phylogeny of Cerithioidea based on 13 mitochondrial PCGs. Divergence times were estimated using BEAST under a relaxed molecular clock with a Yule speciation prior. Fossil calibration points (red dots) were applied to constrain key nodes. Tip labels are color-coded by habitat (freshwater vs. brackish/marine) to illustrate ecological breadth. Node bars indicate 95% highest posterior density (HPD) intervals; mean divergence times (Ma) are shown above each node.
Discussion
Our sequencing of six complete mitochondrial genomes—two Batillariidae (Batillaria multiformis and B. attramentaria) and four Potamididae (Cerithidea tonkiniana, C. rhizophorarum, Cerithideopsis largillierti, and Pirenella cingulata)—revealed a high A + T content (62.51–65.56%), consistent with typical molluscan mitogenomes^23^. Among the PCGs, two overlapping regions were consistently observed: a short (7 bp) overlap between nad4l and nad4, commonly reported in Caenogastropoda, and a longer overlap (38–47 bp) between cytb and nad6^8^. These overlaps may reflect selective pressures favoring compact mitochondrial genomes by minimizing intergenic regions, which are subject to higher mutation rates^10,18^. RSCU analyses revealed a strong preference for A or T at the third codon position, consistent with the overall A + T bias observed in cerithioidean mitogenomes. Notably, although the clustering pattern of codon usage did not fully align with the phylogenetic relationships, freshwater and marine/brackish species tended to form separate groups, with the exception of T. sarasinorum. Although this trend has not previously been reported in gastropods, a similar pattern has been observed in ciliates, where variation in codon usage appears to correlate with habitat salinity^20^. Such patterns may arise from selection for translational efficiency or adaptations to differing metabolic demands^24^. Although codon usage bias reflects the interplay of multiple complex factors, considerable evidence suggests that both evolutionary history and ecological conditions, such as habitat, play critical roles^24,25^.
The newly sequenced mitochondrial genomes of Batillaria attramentaria and Cerithidea tonkiniana from Korea provide valuable genomic data for populations previously characterized using specimens collected elsewhere. The mitochondrial genome of B. attramentaria exhibited approximately 2.4% sequence divergence from that of the invasive population introduced to the United States in the 1930s^26^. This divergence likely reflects population-level genetic differentiation that accumulated following geographic and ecological isolation, rather than adaptive divergence. Nonetheless, such differentiation provides a useful baseline for future studies investigating potential adaptive evolution between native and invasive lineages^27^. Interestingly, the Korean B. attramentaria mitogenome was more than 99% identical to that of B. cumingii (MT323103) from China. Although these are currently recognized as separate species, their close genetic similarity suggests they may be conspecific, consistent with earlier hypotheses. Resolving this taxonomic question will require integrative morphological and molecular analyses using reliably identified voucher specimens. Similarly, our newly generated mitogenome of C. tonkiniana showed 99.7% identity with a Chinese specimen (MZ168697), with most differences confined to the putative control region (CR).
Molluscan mitochondrial genomes are well known for frequent gene rearrangements, particularly in the positions and transcriptional orientations of tRNA genes^18^. Among these changes, tRNA gene rearrangements are the most common and may play a critical role in shaping mitochondrial genome organization, as their secondary structures can function as transcriptional barriers and RNA cleavage signals^28^. The duplication–random loss model (DRLM) provides a plausible mechanism for these shifts: duplicated tRNAs may be selectively retained or lost, resulting in new gene orders over time^29,30^. The differences in tRNA arrangements observed within Cerithioidea may reflect such events. Although all analyzed cerithioidean species shared the same order of PCGs, variations in the location and strand orientation of several tRNAs, such as trnQ, trnR, trnE, and trnY, indicate lineage-specific translocations (Fig. 3). These rearrangements likely resulted from accumulated duplication–loss events, which may have occurred early in cerithioidean evolution, as they coincide with the earliest divergence points in the phylogeny (Fig. 3). However, the limited availability of complete mitogenomes complicates efforts to reconstruct their evolutionary trajectories. More extensive taxon sampling will be necessary to fully elucidate the mechanisms and evolutionary significance of mitochondrial genome rearrangements in Caenogastropoda.
We reconstructed phylogenetic trees using ML and BI methods based on three datasets, and all trees robustly supported the monophyly of Cerithioidea and consistently resolved it into two distinct lineages. Despite recent advances in cerithioidean phylogenetics, family-level relationships remain unresolved. Previous mitogenome-based studies have reported conflicting topologies: while Ling et al.^12^, Yang and Deng^31^, and Yin et al.^32^ recovered Potamididae and Semisulcospiridae as paraphyletic, other studies by Kato et al.^11^, Xu et al.^19,33^, and Forestello et al.^7^ inferred them to be monophyletic. The most recent analysis by Forestello et al.^7^, which used partial markers (16S and 28S rRNA), clustered Potamididae with Thiaridae, Hemisinidae, and Paludomidae, while excluding Semisulcospiridae. Similarly, although our results suggested that Semisulcospiridae is the sister group to Potamididae, this node received weak support across all three datasets, indicating that additional data may alter this interpretation. Additional mitogenomic data from closely related families are needed to definitively resolve this relationship. Our findings also indicate that Batillariidae formed a monophyletic group with Pachychilidae, in contrast to previous studies that grouped Batillariidae with (Turritellidae + Pachychilidae). This shift may be partially attributed to the inclusion of a new Cerithiidae sequence (Clypeomorus sp., PQ310514). The topology aligns with that of Forestello et al.^7^, who also recovered (Pachychilidae + Batillariidae) as sister to (Turritellidae + Cerithiidae) using 16S and 28S rRNA. Nevertheless, the weak support values and unstable branching patterns suggest that relationships among these families remain unresolved and warrant further investigation using broader taxon sampling.
Although atp8 did not exhibit strong evidence of positive selection across all taxa, Ka/Ks analysis revealed ω > 1 in several lineages, suggesting possible episodic adaptive evolution (Fig. 4). Ka/Ks ratios > 1 indicate a suggestion of positive selection; however, they are not definitive, especially under purifying selection on synonymous sites^34^. Although codon-level methods such as FUBAR and MEME did not detect statistically significant sites in atp8, the combination of gene-level and branch-specific signals suggests that atp8 may be subject to lineage-specific selective pressures. As atp8 contributes to the assembly of the F₀ region of ATP synthase and plays a role in ATP production^35^, adaptive changes in this gene could enhance metabolic efficiency in response to diverse ecological stresses^36^. Previous studies on vertebrates have shown that atp8 may undergo positive selection in species exposed to high-altitude, hypoxic, or extreme-temperature environments^37,38^, underscoring its potential ecological and evolutionary significance. However, given its short length, site-level analyses of atp8 may lack statistical power, warranting careful interpretation. By contrast, nad6 generally exhibited Ka/Ks < 1, indicating strong purifying selection (Fig. 4). nad6 is a critical component of mitochondrial complex I, mediating electron transfer from NADH to ubiquinone during oxidative phosphorylation^39^. Because it spans the inner mitochondrial membrane, nad6 is believed to facilitate structural rearrangements essential for proton pumping. Positive selection on nad6 has previously been associated with local adaptation in oxidative phosphorylation, potentially driving energy production under distinct environmental conditions^40,41^. Despite the overall evidence of purifying selection, both FUBAR and MEME identified three codons in nad6 under positive selection, suggesting that certain sites may experience episodic or lineage-specific adaptive pressures^42,43^.
While only one overlap was observed between the sites identified by the site model and those detected by the branch-site model, this discrepancy is not unexpected. The site model detects pervasive selection across the entire phylogeny, whereas the branch-site model focuses on episodic selection occurring in specific lineages. MEME identified a codon overlapping with Branch #3, supporting the hypothesis that episodic selection may have contributed to the divergence of major cerithioidean lineages. The detection of positively selected codons along Branches #1–#3 suggests that substitutions at these evolutionary nodes may have facilitated key functional shifts or ecological adaptations. Site-level methods (FUBAR, MEME) and branch-specific approaches (BEB in CodeML) identified distinct sets of positively selected codons, indicating the co-occurrence of both pervasive and episodic selection across mitochondrial genes. nad6 consistently exhibited strong signals across multiple methods, highlighting its potential role in lineage-specific adaptation within Cerithioidea. AlphaFold-based structural modeling of nad6 and related proteins revealed that α-helices and transmembrane domains are conserved across the superfamily, underscoring their critical role in oxidative phosphorylation. However, notable variation in predicted disordered regions, particularly near the C-terminal ends, suggests that adaptive changes may accumulate in more structurally flexible regions. These variations could enable regulatory modifications without disrupting key structural motifs^44,45^. Notably, the three observed size variants of nad6 (507, 543, and 552 bp) corresponded with distinct taxonomic clusters, implying that structural differences in disordered regions may contribute to lineage-specific adaptations to environmental factors such as temperature or salinity^46^. Recent research increasingly supports the role of adaptive evolution in mitochondrial PCGs among marine and brackish invertebrates, likely driven by fluctuations in temperature, salinity, and oxygen levels^14,16^. Despite differing levels of functional constraint, both atp8 and nad6 can exhibit episodes of positive selection at the gene or codon level, optimizing energy metabolism in response to dynamic conditions^37^. Analyses of site- and region-specific adaptations offer valuable insights into how invertebrate populations mitigate environmental stress, highlighting the pivotal role of mitochondrial function in ecological and evolutionary resilience.
Although Cerithioidea has a rich fossil record, accurately classifying fossil species remains challenging. To address this, we established calibration points based on a recent revision of fossil taxa^46^. Our estimates place the divergence of Semisulcospiridae at approximately 77.65 million years ago (95.19–60.10 Ma), which is older than the approximately 44.5 Ma range (66–24 Ma) reported by Neiber et al.^48^. Strong and Köhler^49^ proposed that this clade began diversifying around 55 Ma, with the most recent common ancestor of Semisulcospira emerging approximately 25 Ma. Our estimate for that event, 33.07 Ma (41.24–24.89 Ma), is broadly consistent with both this previous finding and Japanese fossil records dated to approximately 23–15 Ma^50^. Reid et al.^47^ documented Cerithideopsis fossils in the Middle to Late Eocene, whereas our analyses infer an earlier, Paleocene origin. For Batillariidae, we placed the genus Batillaria in the Early Miocene, considerably more recent than fossil-based estimates suggesting a Late Paleocene to Eocene origin^51^. Hazhauser et al. (2023) noted that Potamididae and Batillariidae were highly diverse during the Miocene Climate Optimum, but subsequently experienced the extinction of many large-bodied species^52^. This extinction event may partly explain discrepancies between molecular divergence times and the fossil record. While Han et al.^53^ inferred the origin of Cerithioidea around 150 Ma based on whole-genome data, our mitochondrial estimate suggests a much deeper origin, possibly extending back to the Cambrian and Early Jurassic intervals (274.29 million years ago; 351.07–197.51 Ma). Divergence time differences may result from variations in molecular clock calibrations, gene regions analyzed, taxon sampling, and analytical models. Nonetheless, our study, based on mitogenomic data, produced relatively narrow confidence intervals. Future efforts integrating broader taxon sampling, improved calibration points, and more comprehensive datasets will help further refine these estimates.
An intriguing finding of our study is that the divergence of major cerithioidean families occupying different habitats occurred primarily during the Cretaceous Thermal Maximum (CTM; ~ 90 Ma), with further increases in lineage diversity inferred around the Paleocene–Eocene Thermal Maximum (PETM; ~ 56 Ma), both periods characterized by elevated global temperatures^54,55^. BEAST analyses suggest that the earliest family-level divergences coincided with the CTM, a time of high atmospheric CO_2_ concentrations, extremely warm equatorial sea surface temperatures, and widespread oceanic anoxia. These extreme conditions likely weakened geographic and ecological barriers, such as salinity gradients and thermal thresholds, facilitating dispersal and early diversification. In addition, our results indicate that cerithioidean lineages surviving the K–Pg mass extinction (~ 66 Ma) subsequently underwent increased diversification, suggesting that ecological opportunities created by this global crisis were rapidly exploited^56^. During the PETM, further warming, sea-level rise, and shifts in ocean chemistry appear to have promoted continued radiation, broadening lineage richness and ecological breadth^57^. Taken together, these events highlight how repeated episodes of climatic extremes and biotic crises shaped the tempo and mode of cerithioid evolution.
Overall, our findings underscore the interplay between mitochondrial genome evolution and global environmental fluctuations in shaping the diversification of Cerithioidea. Continued research that integrates whole-genome sequencing, paleoenvironmental modeling, and comprehensive taxon sampling will be essential for fully reconstructing the evolutionary trajectory of Cerithioidea and understanding how historical climate shifts influenced lineage-specific adaptations.
Materials and methods
Sample collection, DNA extraction, and sequencing
Specimens were collected from intertidal zones at different sites along the western and southern coasts of South Korea (Supplementary Table S1). The species used in this study are not subject to animal ethics regulations in South Korea or internationally. Thus, no ethical approval was required, but all efforts were made to minimize environmental impact and animal stress. Species identification was based on morphological features and confirmed through analysis of partial sequences from a molecular marker. Total genomic DNA was extracted from a section of muscular foot tissue using a DNeasy Blood and Tissue kit (Qiagen, Germany). DNA quality and quantity were assessed using a NanoDrop 4000 spectrophotometer (Thermo Fisher Scientific, USA). A fragment of the mitochondrial cox1 gene was amplified using the primers LCO1490 and HCO2198^58^. PCR amplification was performed under the following conditions: initial denaturation at 94 °C for 10 min, followed by 35 cycles of denaturation at 94 °C for 30 s, primer annealing at 48 °C for 1 min, and extension at 72 °C for 1 min, and a final extension at 72 °C for 10 min. PCR products were purified using the QIAquick PCR Purification kit (QIAGEN Co., USA) and sequenced directly using an ABI Prism 3730 DNA sequencer (PerkinElmer Inc., USA) with the BigDye Terminator Sequencing kit (PerkinElmer Inc., USA). After verifying the reliability of the nucleotide sequences, the confirmed cox1 sequences were subjected to BLAST searches. Complete mitochondrial genomes were sequenced using next-generation sequencing (NGS) technology. Sequencing libraries were constructed with an average insert size of 150 bp using the QIAseq FX single cell DNA library kit (Qiagen, Germany). Sequencing was performed using the Illumina HiSeq 4000 platform. Raw sequencing reads were subjected to quality control prior to assembly. Adapter sequences and low-quality bases were trimmed, and reads with a Phred quality score below Q30 were removed. Only high-quality reads passing these thresholds were retained for downstream analyses.
Mitogenome assembly, annotation, and characterization
The mitochondrial genomes of six cerithioidean species were assembled using NOVOPlasty v4.3.1^59^, with partial sequences of the cox1 gene used as seed sequences. PCGs were identified using ORF Finder (https://www.ncbi.nlm.nih.gov/orffinder) and MITOS^60^. A total of 22 tRNA genes were predicted using tRNAscan-SE (https://lowelab.ucsc.edu/tRNAscan-SE/) and ARWEN^61^. rRNA genes were annotated through comparative analyses with other caenogastropod mitogenomes, and their boundaries were manually adjusted based on the positions of adjacent genes^62^. To visualize genome structure, each mitochondrial genome was illustrated in circular format using the Proksee web server (https://proksee.ca/) (Fig. 1). The complete mitochondrial genome sequences and their corresponding annotation files for all six species were uploaded from GenBank (Supplementary Table S1).
Following annotation, nucleotide composition and RSCU for the PCGs were analyzed using the CAIcal server (http://genomes.urv.es/CAIcal/). Nucleotide skewness was calculated using the following formulas: AT skew = (A − T)/(A + T) and GC skew = (G − C)/(G + C)^63^. To assess codon usage patterns across species, RSCU values were computed for each codon in each species. The resulting RSCU matrix was visualized as a heatmap, with codons on the x-axis and species on the y-axis. To highlight similarities in codon usage patterns, hierarchical clustering of species was performed using Ward’s minimum variance method (ward.D2) and Euclidean distance, and the clustering dendrograms were displayed alongside the heatmap. Stop codons (TAG and TAA) were excluded to minimize the effect of their amino acid composition. All analyses were conducted in R v.4.5.1^64^ using the pheatmap package^65^. To evaluate the robustness of the species clusters, multiscale bootstrap resampling was performed using the pvclust package^66^. Clusters with approximately unbiased (AU) p-values > 95% were considered statistically significant and are marked with red dots on the dendrogram (Fig. 2).
Phylogenetic analyses
Phylogenetic trees were constructed using ML and BI methods based on sequences from 13 PCGs and two rRNA genes from 33 cerithioidean species. Two additional caenogastropods were included as outgroups (Fig. 3, Supplementary Fig. S7). The PCG sequences were aligned, and start and stop codons were trimmed using BioEdit v7.2^67^. Ambiguously aligned regions in the rRNA genes were removed using Gblocks v0.91b with default parameters^68^. Three datasets were used for the analysis: (1) a combined nucleotide dataset comprising 13 PCGs and two rRNAs, (2) a nucleotide dataset of the 13 PCGs, and (3) amino acids dataset. Partitioning schemes were determined using ModelFinder v2.2.0^69^, which selected the best-fit models for each gene partition based on the Bayesian information criterion (BIC). The selected models were TIM + F + I + G4 for cox1, GTR + F + I + G4 for cox2 + nad4l + nad3, TVM + F + I + G4 for nad4 + nad5 + cytb, GTR + F + I + G4 for cox3, TVM + F + I + G4 for nad6 + atp8, TVM + F + I + G4 for nad1 + atp6, TVM + F + I + G4 for nad2, and TVM + F + I + G4 for rrnS + rrnL for the nucleotide datasets, and mtVer + F + I + G4 for the amino acid dataset. ML analyses were performed using the IQ-TREE web server (http://iqtree.cibiv.univie.ac.at/) with 10,000 ultrafast bootstrap replicates. BI analyses were conducted using MrBayes v3.2.7a^70^, using the previously identified best-fit substitution models. Two simultaneous Monte Carlo Markov Chain (MCMC) runs were executed for 10,000,000 generations, with trees sampled every 1,000 generations. The first 25% of sampled trees were discarded as burn-in. Convergence of the independent MCMC runs was assessed by examining the mean standard deviation of split frequencies (< 0.01). The resulting phylogenetic trees were visualized using FigTree v1.4.4^71^.
Selection analyses
The strength of selection against nonsynonymous substitutions relative to synonymous substitutions was assessed by calculating the ratio of nonsynonymous substitutions per nonsynonymous site (Ka) to synonymous substitutions per synonymous site (Ks). To compare patterns of sequence evolution among cerithioidean species, Ka/Ks ratios were calculated from pairwise DNA sequence comparisons using the yn00 module in PAML v4.8^72^ (Fig. 4).
Codons potentially under selection were identified using the HyPhy package via the DataMonkey web server (https://www.datamonkey.org/). The fast unconstrained Bayesian approximation (FUBAR) method was used to detect codons undergoing pervasive purifying or diversifying selection^73^, and the mixed effects model of evolution (MEME) was used to identify episodic positive selection^22^. Additionally, an adaptive branch-site random effects likelihood (aBSREL) was used to detect episodic selection across all branches^74^. Statistical significance was determined using a posterior probability (PP) > 0.9 for FUBAR, and p-values < 0.05 for MEME and aBSREL. To further test for positive selection at specific codons or lineages, site models implemented in CodeML within the PAML package were also applied. Six different site models were tested using equal codon frequencies, as proposed by Yang et al.^75^: M0 (one ω ratio), M1a (nearly neutral), M2a (positive selection), M3 (discrete), M7 (beta), and M8 (beta and ω). Likelihood ratio tests (LRTs) were conducted to compare null models with those that allow ω > 1, as follows: M0 vs. M1a to test for a single ω ratio across codons, M0 vs. M3 to assess variable selection pressure among sites, and M1a vs. M2a and M7 vs. M8 to detect evidence of positive selection. When LRT results supported positive selection, Bayes empirical Bayes (BEB) analysis was used to estimate the PP of codons under positive selection (ω > 1) in models M2a and M8. Codons with PP > 0.95 were considered to be under positive selection^75^ (Table 2). Additionally, branches identified by aBSREL as undergoing episodic diversifying selection (p < 0.05) were designated as foreground branches for subsequent branch-site model analyses using CodeML. For these branches, the M2a branch-site model was applied to detect codon-specific positive selection. Sites with BEB posterior probabilities exceeding 0.95 were considered to be under positive selection within those lineages (Table 2).
To assess whether codons or genes under positive selection may lead to structural or functional changes in the encoded proteins, the AlphaFold Server (https://alphafoldserver.com/) was used to generate three-dimensional structure predictions (Fig. 5). The resulting models were examined to identify potential alterations in regions such as binding sites, transmembrane domains, or disordered regions.
Divergence time estimation
Divergence time estimation was conducted using BEAST v2.6.0^76^ based on concatenated sequences of 13 PCGs. Fossil calibration points were incorporated using BEAUti v2 to generate the XML file. Three fossil calibration points were applied based on the fossil records: (1) the crown group of Thiaridae + Hemisinidae + Paludomidae was constrained to the Mid-Cretaceous (100.5 Ma)^77^, (2) the earliest known fossil of the family Potamididae from the Late Cretaceous (66.0–72.1 Ma)^47^, and (3) a fossil of the genus Batillaria from the Early Miocene (15.97–23.03 Ma)^51^. Fossil calibration priors were implemented as log-normal distributions, following standard practice to accommodate uncertainty in fossil ages. For each calibration, the offset was set to the minimum bound of the corresponding fossil age range, while the mean and standard deviation in log space were both set to 1.0, producing a moderately right-skewed distribution. Accordingly, the offset values were 100.5 Ma for the Thiaridae + Hemisinidae + Paludomidae calibration, 66.0 Ma for Potamididae, and 15.97 Ma for Batillaria. Divergence times were estimated under a Yule speciation prior with a relaxed log-normal molecular clock. The best-fitting substitution model for each partition was applied in BEAST. Bayesian inference was performed using 20 million MCMC generations, with parameters sampled every 1,000 generations. The initial 25% of samples were discarded as burn-in. Two independent runs with different random seeds were performed to ensure convergence. Tracer v1.7^78^ was used to assess convergence and mixing of parameters, confirming that all major effective sample sizes (ESS) exceeded 200 after burn-in. The log and tree files from independent runs were combined using LogCombiner, and the resulting posterior distribution of trees was summarized as a maximum clade credibility (MCC) tree in TreeAnnotator v2.6.0. The final tree was visualized and edited in FigTree v1.4.4^71^ (Fig. 6).
Supplementary Information
Supplementary Information.
The reference list from the paper itself. Each links out to its DOI / PubMed record.
- 1Mollusca Base. Mollusca Base. https://www.molluscabase.org (2025). Accessed 2 April 2025.
- 2Ponder, W. F. et al. Caenogastropod phylogeny. In Molluscan Phylogeny (eds Ponder, W. F. & Lindberg, D. R.) 331–383 (University of California Press, 2008).
- 3Houbrick, R. S. Cerithiodean phylogeny. In Prosobranch Phylogeny (ed. Ponder, W. F.) Malacol. Rev. Suppl.4, 88–128 (1988).
- 4Simone, L. R. L. Phylogenetic analysis of Cerithioidea (Mollusca: Caenogastropoda) based on comparative morphology. Arq. Zool.36, 147–263. 10.11606/issn.2176-7793.v 36i 2p 147-263 (2001).
- 5Ghiselli, F. et al. Molluscan mitochondrial genomes break the rules. Philos. Trans. R. Soc. Lond. B Biol. Sci.376, 20200159. 10.1098/rstb.2020.0159 (2021).10.1098/rstb.2020.0159 PMC 805961633813887 · doi ↗ · pubmed ↗
- 6Xu, Y. B. et al. A new species of Semisulcospira O. Boettger, 1886 from Fujian, China with mitochondrial genome and its phylogenetic implications. Zoosyst. Evol.101, 17–34. 10.3897/zse.101.136882(2025).
- 7Dhar, D., Dey, D., Basu, S. & Fortunato, H. Insight into the adaptive evolution of mitochondrial genomes in intertidal chitons. J. Molluscan Stud.87, eyab 018. 10.1093/mollus/eyab 018(2021).
- 8Vermeij, G. J. A natural history of shells. (Princeton University Press, 1993).