Effects of energy-matched low- versus high-carbohydrate diets on glycaemic control, lipid profile, and body composition in healthy adults: a systematic review and meta-analysis of randomised controlled trials
Alexandros Anagnostou, Eneko Larumbe-Zabala, Jo Fiore, Justin Roberts, Fernando Naclerio

TL;DR
Low-carb diets slightly improve blood sugar and cholesterol in healthy adults compared to high-carb diets when calories are matched.
Contribution
This study provides a systematic review and meta-analysis comparing low- and high-carbohydrate diets under energy-matched conditions.
Findings
Low-carb diets reduced fasting blood glucose and insulin more than high-carb diets.
Low-carb diets improved HDL cholesterol and triglycerides, while high-carb diets lowered LDL cholesterol.
Low-carb diets led to greater reductions in body mass and fat mass compared to high-carb diets.
Abstract
The comparative effects of energy-matched low-carbohydrate (LC) versus high-carbohydrate (HC) diets on metabolic and anthropometric outcomes in healthy adults remain unclear. To evaluate the effects of LC diets (≤ 44% of total daily caloric intake [TDCI] from carbohydrate) versus HC diets (≥ 45% TDCI) on fasting glycaemia, insulinaemia, blood lipids, and body composition in non-medicated, disease-free adults under energy-matched conditions. Randomised controlled trials (RCTs) were identified through systematic searches of PubMed and secondary sources up to April 2025. Eligible studies compared energy-matched dietary interventions and reported pre- and post-intervention data for fasting blood glucose (FBG), fasting insulin (FINS), blood lipids (total cholesterol [TC], HDL-cholesterol [HDL-C], LDL-cholesterol [LDL-C], triglycerides [TAG]), and/or body composition. Pooled effect sizes…
Genes, proteins, chemicals, diseases, species, mutations and cell lines named across the full text — each resolved to its canonical identifier and authoritative record.
Click any figure to enlarge with its caption.
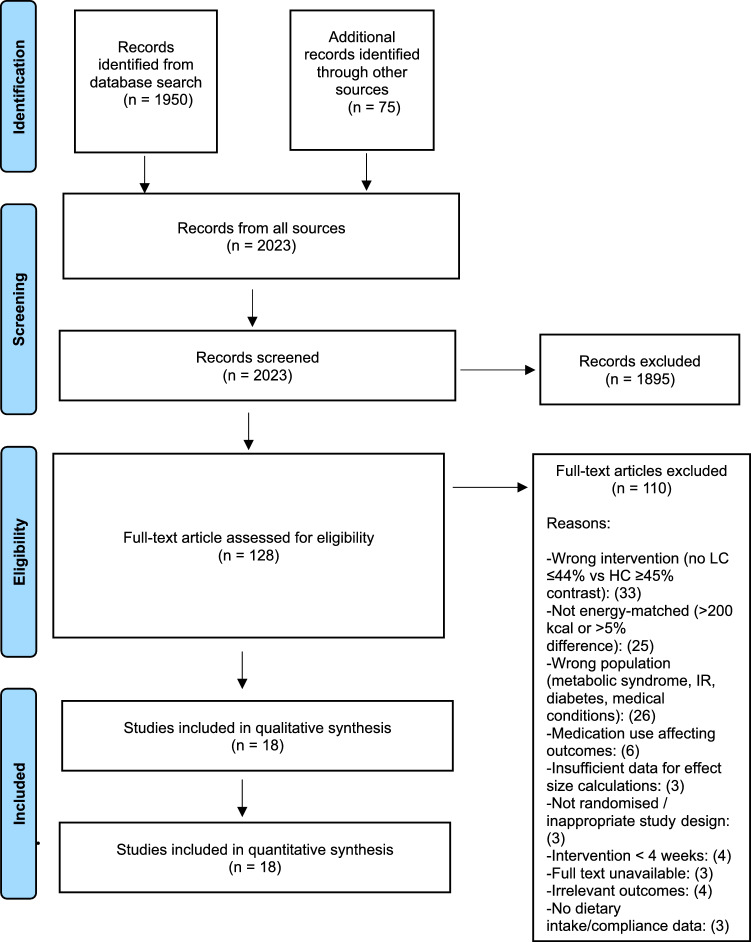 Figure 1
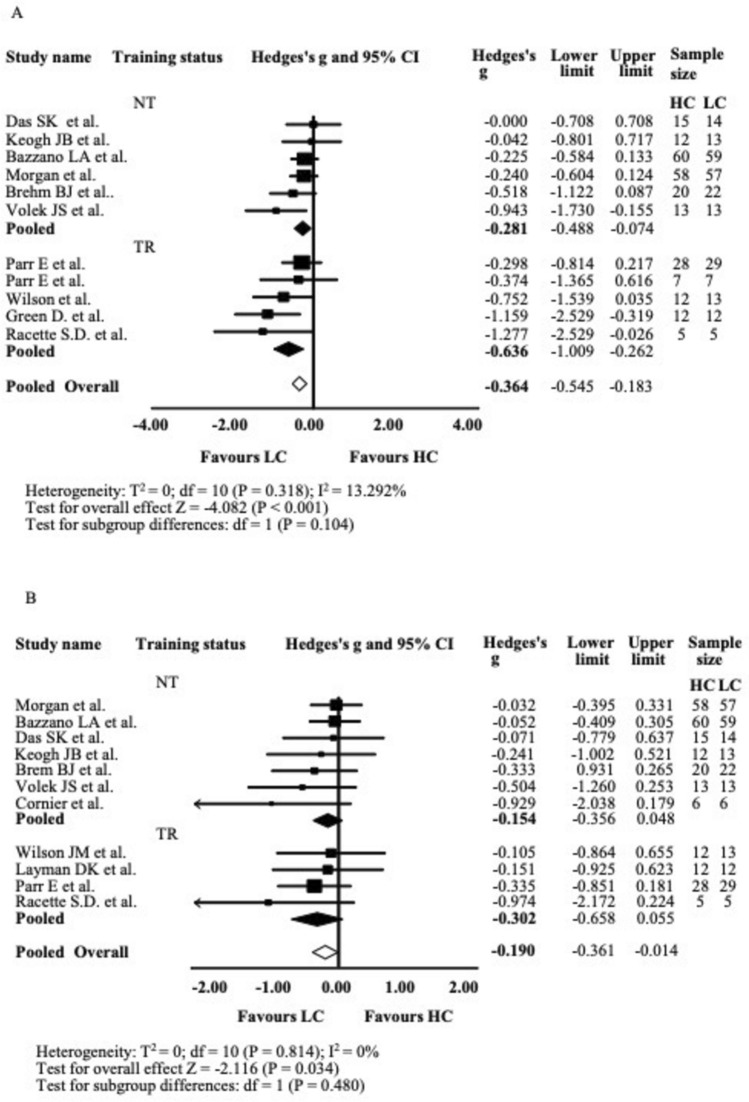 Figure 2
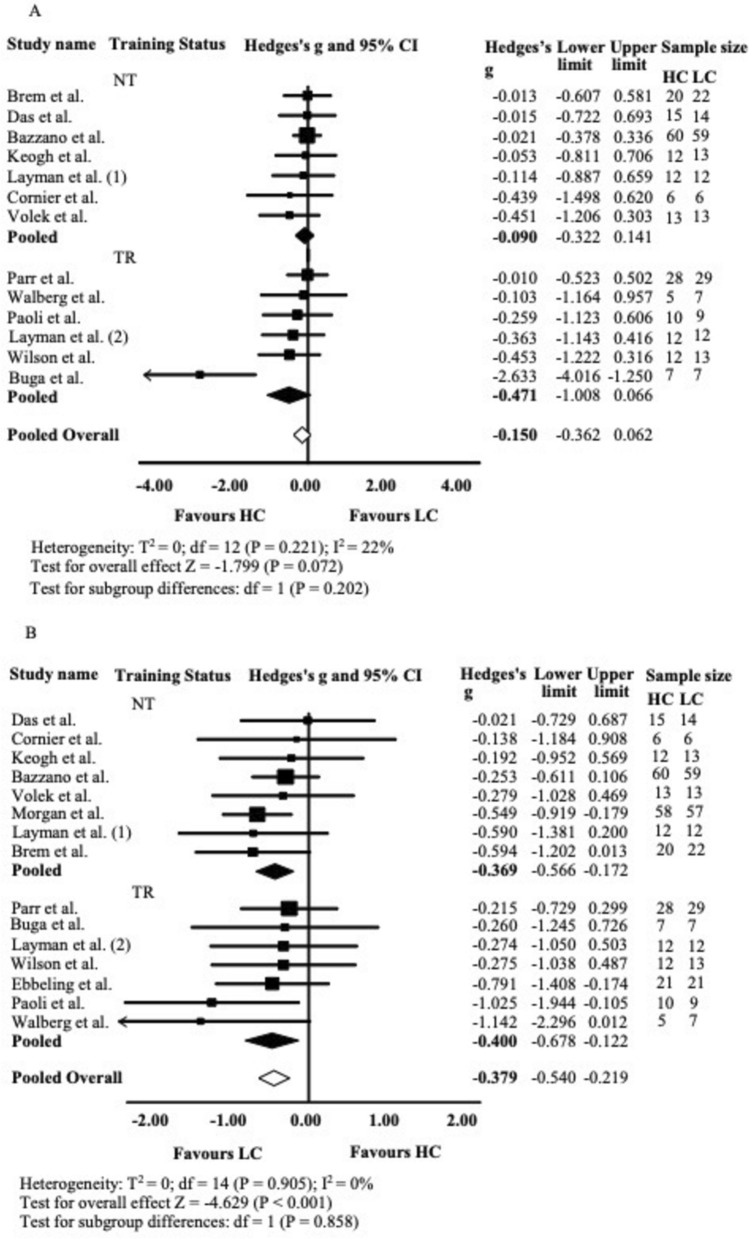 Figure 3
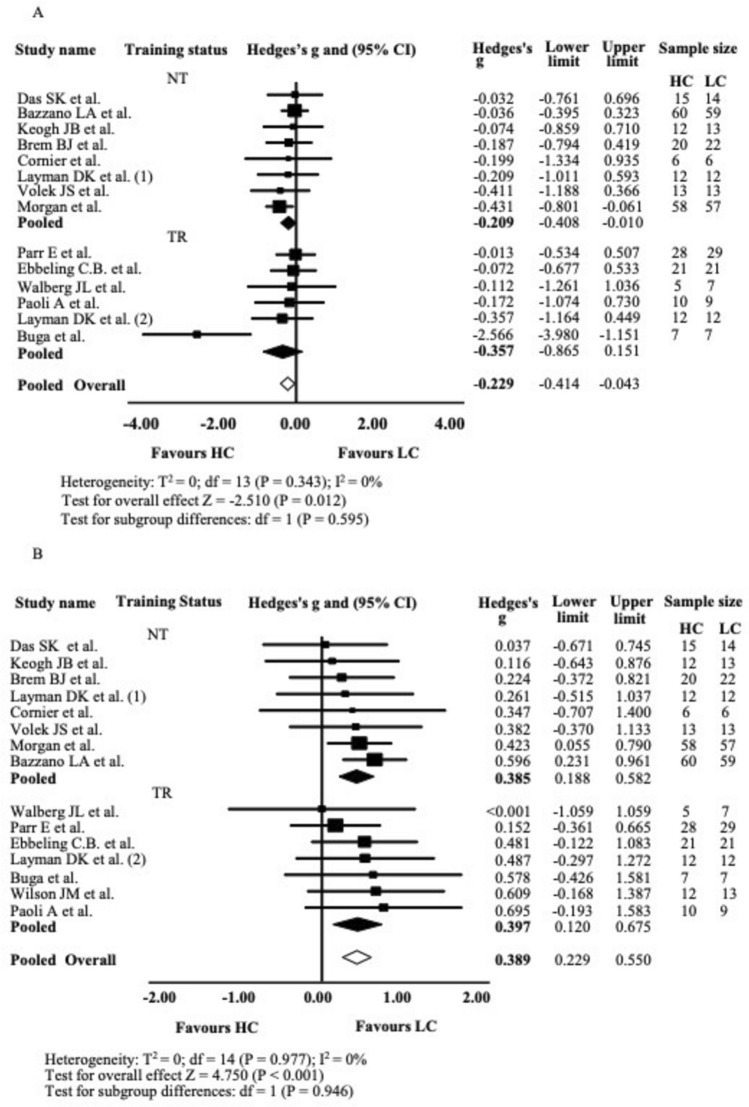 Figure 4
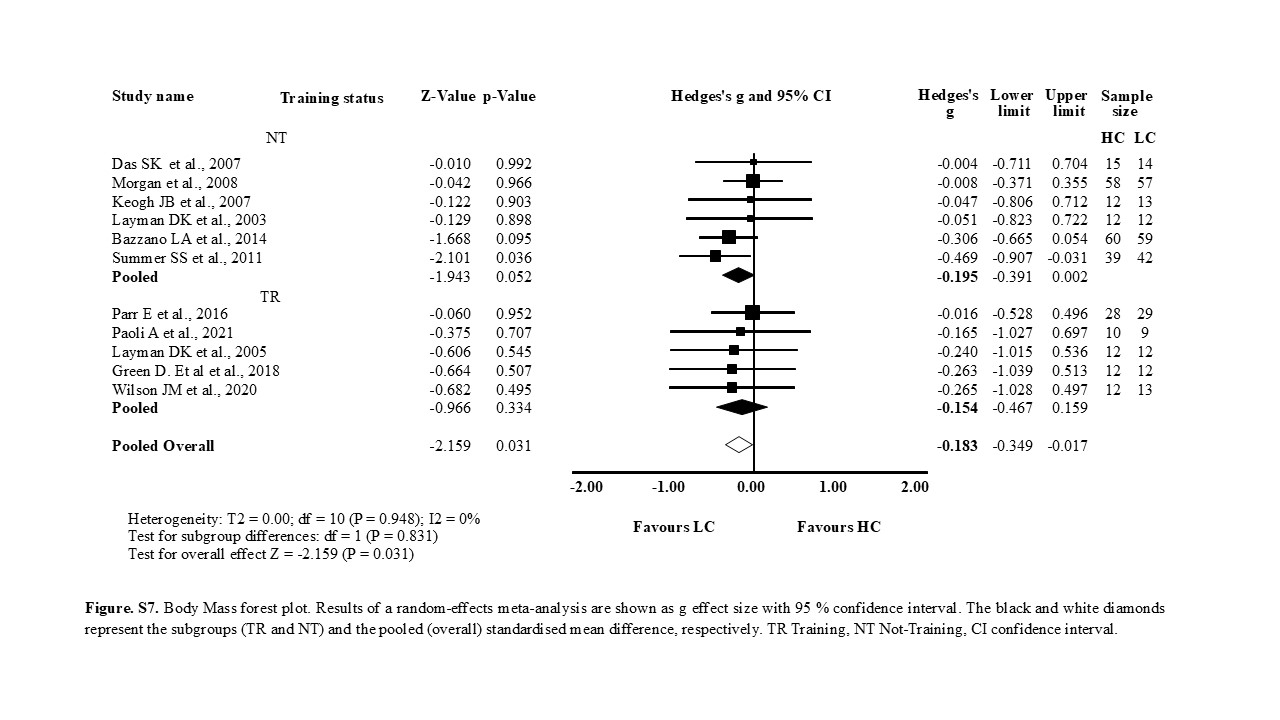 Figure 5
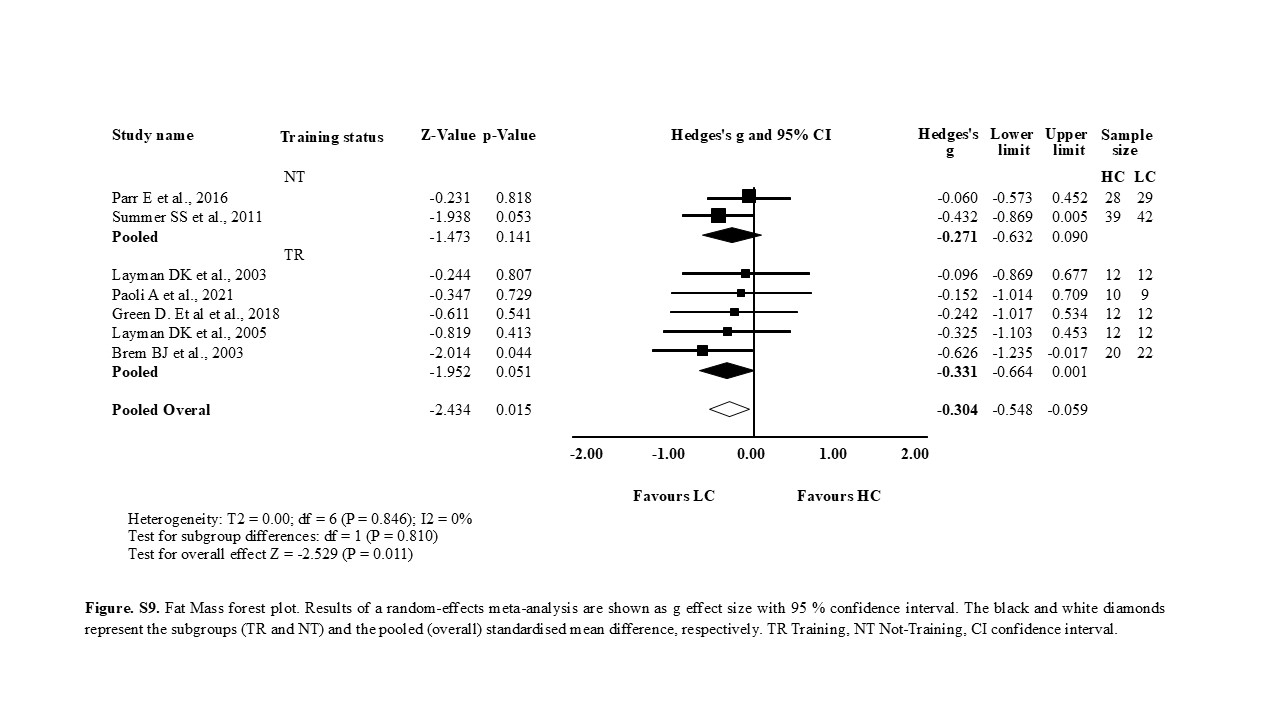 Figure 6
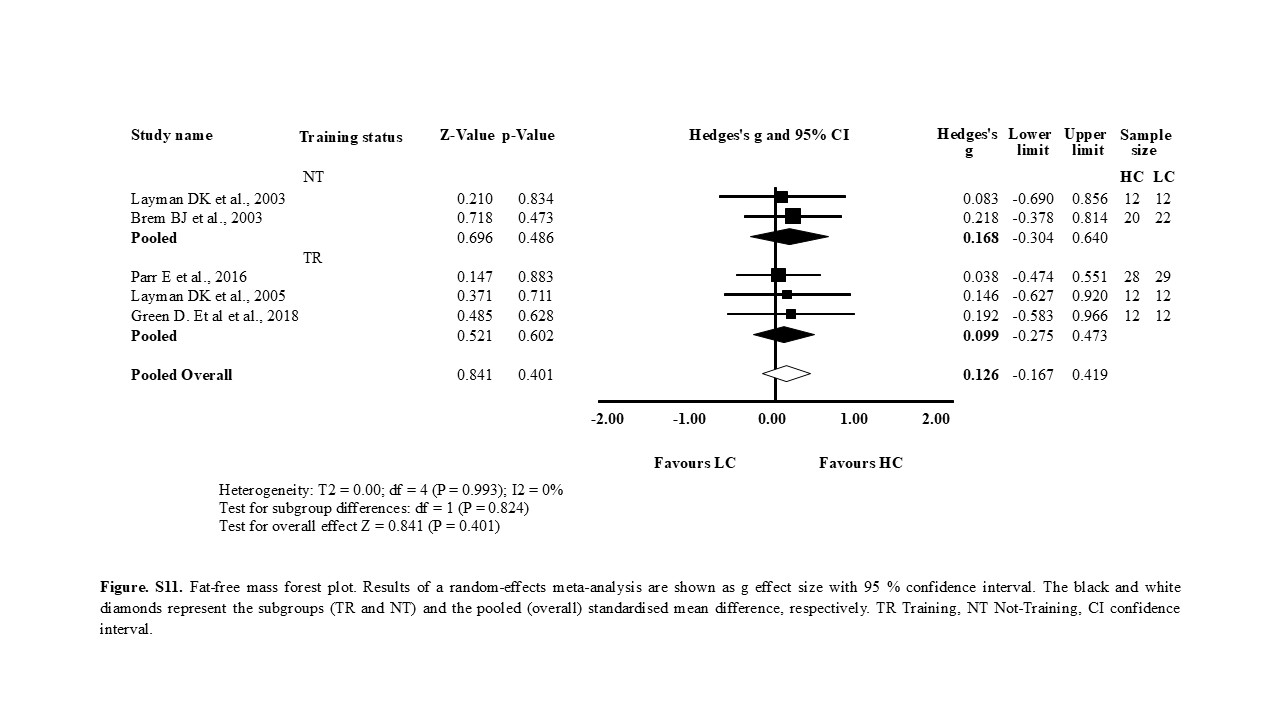 Figure 7
Peer Reviews
No public reviews on file for this paper yet. If you reviewed it on a platform where reviews are public (OpenReview, ICLR, NeurIPS, ICML), you can paste yours below so the community can read it here.
Videos
No videos yet. Explain this paper in a talk, walkthrough, or lecture? Add one.
Taxonomy
TopicsDiet and metabolism studies · Dietary Effects on Health · Food composition and properties
Introduction
Obesity represents a significant global health challenge, with projections indicating that by 2035, over 50% of the world’s population could be classified as overweight or obese [1]. The resulting economic burden due to obesity-related healthcare and societal costs is substantial [1, 2]. Obesity significantly increases the risk of developing cardiovascular disease, type 2 diabetes, and various cancers, highlighting the need to understand the underlying metabolic mechanisms, particularly insulin resistance and hyperinsulinemia [3–6]. Hyperinsulinemia represents a critical target for investigating dietary strategies aimed at reducing the risk of metabolic syndrome, given its assssociation with carbohydrate-induced insulin secretion and its strong link to obesity and metabolic syndrome development [7].
Moreover, recent reviews have questioned the long-standing association between saturated fat intake, elevated cholesterol levels, and increased cardiovascular disease risk. These analyses found insufficient evidence to support this association. Conversely, some findings suggest that higher intake of saturated fats may be beneficial to health, particularly when dietary fats substitute carbohydrates. Such substitution of increased fats and reduced carbohydrates has been shown to improve lipid profiles by reducing the total cholesterol: HDL-C and LDL-C: HDL-C ratios [8–11].
Metabolic syndrome is diagnosed when an individual presents with at least three of the following clinical markers: central obesity (waist circumference ≥ 102 cm in men or ≥ 88 cm in women), elevated triglyceride (TAG) levels (≥ 1.7 mmol/L), reduced HDL cholesterol (< 1.0 mmol/L in men or < 1.3 mmol/L in women), elevated blood pressure (≥ 130/85 mmHg), or elevated fasting plasma glucose (≥ 5.6 mmol/L), or is receiving treatment for any of these conditions [12].
The available evidence suggests that the macronutrient distribution range, not merely total caloric intake, plays a critical role in regulating blood lipid profiles, insulin and glucose levels, body composition, and the development, remission, and prevention of metabolic disorders. Extensive research has examined the effects of various macronutrient distribution ranges [13, 14], particularly carbohydrate intake, on metabolic markers [15–17] and body composition [18, 19]. However, significant methodological heterogeneity among these studies has hindered the ability to reach a consensus and formulate evidence-based dietary recommendations for the general healthy adult population. For instance, regular physical activity is effective in managing dyslipidaemia and may serve as a primary prevention strategy, potentially reducing the need for pharmacological intervention [20]. Furthermore, existing literature supports the role of exercise as an effective intervention for glycaemic control and enhancement of insulin sensitivity, not only in healthy, non-overweight individuals but also in obese, prediabetic, and diabetic populations [21–25].
Therefore, this systematic review and meta-analysis aimed to quantify the effects of dietary carbohydrate modification on metabolic health and body composition in healthy, non-medicated adults with or without regular physical activity. We specifically compared recommended carbohydrate intakes (≥ 45% of total daily caloric intake, TDCI) [26–28] against lower carbohydrate intakes (≤ 44% TDCI) in energy-matched conditions. Primary outcomes included changes in fasting blood glucose, fasting insulin, and blood lipid profiles (TC, HDL-C, LDL-C, and TAG). Secondary outcomes assessed changes in body composition parameters: body mass (BM), fat mass (FM), and fat-free mass (FFM). The findings aim to provide robust evidence to inform dietary recommendations and potentially contribute to public health strategies for reducing the global burden of obesity and metabolic syndrome.
Methods
This study was performed under the Preferred Reporting Items for Systematic Review and Meta-Analysis (PRISMA). The analysis method and inclusion criteria were specified and documented in a protocol registered at the International Prospective Register of Systematic Reviews, PROSPERO (CRD420251012019).
Search strategy
A systematic review of the literature was conducted in accordance with PRISMA guidelines [29–31] and the guidelines described for systematic reviews in the nutrition field [32]. The keywords used to ensure that all potentially eligible studies were identified in our search included: (energy-matched or isoenergetic or conventional or western or traditional or vegan or high* protein or low protein or vege* or vega* or high* carb* or low carb* or high* fat or low fat or Mediterranean or keto* or carnivore or diet) and (body composition or lean body mass or LBM or fat-free mass or FFM or blood markers of health or fasting glucose or triglycerides or total cholesterol or high density cholesterol or HDL or low density cholesterol or LDL or total leukocytes or leukocyte subsets or neutrophils or eosinophils or basophils or monocytes or lymphocytes or platelets or physical performance or upper body strength or lower body strength or 1 repetition maximum test or 1-RM or markers of physical performance or 10-m walking or 10-MW or 6-min walking or 6-MW or 5-times sit-to-stand or 5-STS or 30-s sit-to-stand or 30-STS or timed up-and-go or TUG tests) or (documented dietary habits or food tracking or macronutrient tracking or food diary or MyFitnessPal or diet tracking) not (chronic or injury or disease or metabolic syndrome or diabet* or drugs or medications or adolescence or acute or Illn* OR Canc* OR Frail* OR Sick* OR ICU OR Sclerosis OR Patient* OR Hospit* OR Rehab* OR Child* OR Kids* OR Toddler* OR Animal* OR Rats* OR Mice OR Mouse or short-term or days or acute or osteoporosis or hiv or rehabilitation or morbid obesity or sarcopenia).
The search was conducted between July to December 2024. The initial result from the PubMed database was 62,032 studies before filters were applied. Following the automatic filter application of PubMed to make the search accurate, the result was reduced to 1950. After hand-picking the eligible studies based on title and published abstract, we selected 53 studies from the search in PubMed and another 75 found through references of similar SR and MA. Finally, the researcher (AA) selected 18 studies eligible for data extraction, and the remaining were excluded due to failing our eligibility criteria, incomplete data, or variables measured that were not relevant to our review (Fig. 1). A second reviewer, FN, independently screened the identified publications before proceeding to the data extraction.Fig. 1PRISMA-P Flow chart diagram of the study selection
Eligibility criteria
The inclusion and exclusion criteria were the following: (i) Randomised Controlled trials only; (ii) with healthy human adults, including overweight and obese, not injured, not rehabilitating, not under any medication, disease-free and (iii) to ensure the inclusion of metabolically healthy, non-diabetic populations, studies that explicitly recruited insulin-resistant or metabolically impaired participants were excluded [33–35]. We assessed whether they had IR based on one of the following scenarios: studies had specifically tested for IR, using methods such as HOMA-IR [36, 37] or explicitly mentioned in their eligibility criteria that they included only non-diabetic participants, or in some cases classified their participants as having no existing medical conditions. Minor variations in insulin sensitivity within the normal physiological range were accepted, as such fluctuations are common among free-living healthy adults and do not indicate the presence of diabetes or metabolic impairment. When we observed contradicting indications from their baseline blood tests, we excluded the study. In addition, (iii) participants had to be: not pregnant and/or not diagnosed with metabolic syndrome (studies with three or more metabolic syndrome [MS] risk factors present at baseline measurements were excluded, even if the study classified the participants as healthy and/or not diagnosed with MS) [38]; (iv) a minimum of two intervention groups was required in each publication, comparing a traditional diet \documentclass[12pt]{minimal} \usepackage{amsmath} \usepackage{wasysym} \usepackage{amsfonts} \usepackage{amssymb} \usepackage{amsbsy} \usepackage{mathrsfs} \usepackage{upgreek} \setlength{\oddsidemargin}{-69pt} \begin{document}$$\ge $$\end{document} 45% CHO (HC) of a TDCI to a low CHO ≤ 44% (LC), based on the minimum recommended intake of \documentclass[12pt]{minimal} \usepackage{amsmath} \usepackage{wasysym} \usepackage{amsfonts} \usepackage{amssymb} \usepackage{amsbsy} \usepackage{mathrsfs} \usepackage{upgreek} \setlength{\oddsidemargin}{-69pt} \begin{document}$$\ge $$\end{document} 45% set by the Institute of Medicine and supported by the American Health Associations along with the governments of the U.S. and U.K. [26, 27, 39, 40]; (v) the dietary interventions had to be energy-matched and any study with > 200 kcal or > 5% difference between groups was excluded [41, 42]. In this context, ‘energy-matched’ refers to interventions in which both comparison groups were designed to maintain equivalent total energy intake across the study period, although not necessarily identical to participants’ habitual or baseline caloric intake. This approach ensured that the observed effects reflected differences in macronutrient composition rather than disparities in overall energy consumption. We used the former criterion for studies with groups consuming a mean daily caloric intake of ≥ 1500 kcal and the latter for studies with diets of < 1500 kcal. This decision was made based on the evidence that variations in daily caloric intake, especially if it leads to a caloric deficit, result in weight loss, affect blood lipid profile, along with fasting insulin [43, 44]. Furthermore, we decided to use a variation of 200 kcal from the target TDCI between diet groups as the cutoff point, similarly to other publication [45] which defines the groups as energy-matched as aligned with previously published research [46, 47]; (vi) in addition, dietary intake should have been reported and monitored along with dietary advice provided to the participants to ensure compliance; (vii) the minimum duration of intervention was 4 weeks; and (viii) lastly, measured variables should be sufficiently presented as mean differences and standard deviation (SD) or to allow for calculations of mean and SD for some or all of the following dependent variables: TC (mmol/l), HDL-C and triglycerides (mmol/l), insulin (mmol/l), testosterone (ng/dl), cortisol (μg/dl), BM (kg), FM (kg), body fat (%), FFM (kg) and muscular strength (1RM).
In accordance with the PICOTS framework, the review was structured as follows:
- Population: Healthy, non-diabetic, metabolically healthy adults, including those who were overweight or obese.
- Intervention: Low-carbohydrate diets providing ≤ 44% of total daily caloric intake (TDCI) from carbohydrates.
- Comparator: High-carbohydrate diets providing ≥ 45% of TDCI.
- Outcomes: Cardiometabolic, hormonal, and body-composition indicators, including total cholesterol (TC), HDL-cholesterol (HDL-C), triglycerides (TG), insulin, testosterone, cortisol, body mass, fat mass, body-fat percentage, fat-free mass (FFM), and muscular strength.
- Timing: Interventions lasting a minimum of four weeks.
- Setting: Controlled laboratory or free-living conditions, as specified by the original study authors
Study records
Data management and selection
(i) The initial identification of data from the selected studies was conducted by screening the titles and published abstracts; (ii) full-text articles were then retrieved and assessed for eligibility; (iii) in certain cases, authors were contacted to obtain precise data that were only available in graphical form or not reported as means (± SD), or in any other usable format for calculation; (iv) when necessary, SDs were calculated from mean confidence intervals (MCI), standard errors (SE), or percentage changes in mean and SD.
Data collection process and coding
The extracted qualitative and quantitative data from each study were as follows: (1) researcher’s name; (2) year of publication; (3) population characteristics at baseline; (4) dietary intervention and exercise intervention when applicable; (5) study duration; (6) methods of monitoring compliance; (7) sample number per group; (8) pre and post measurements expressed in means and SD for the following variables: (i) total cholesterol, lipoproteins and triglycerides; (ii) blood glucose; insulin (iii) waist circumference, body fat (BF), body fat % (BF%), lean mass (LM)/ FFM, total mass/BM; (iv) blood pressure; and (v) V̇O_2max_; lower and upper body strength (expressed in kilograms).
Risk of bias in individual studies
Methodological details concerning the potential influence of bias were carefully evaluated. As part of the quality control process, two independent reviewers (AA and FN) individually extracted information from each study. The risk of bias for each study was assessed using six domains from the Cochrane collaboration tool [48], which included: randomisation process, period of carryover effects, deviations from intended intervention, missing out data, measurement of the outcome, selection of the reported results, and overall bias. These domains corresponded to various types of bias, including selection, allocation, performance, detection, attrition, reporting, and others. The two reviewers conducted independent evaluations of study quality, comparing and discussing their results until reaching a consensus [If a consensus could not be agreed, a third reviewer (JF) was consulted]. Each domain was rated as − 1 for high risk, 0 for unclear risk, and 1 for low risk, with total scores ranging from − 6 to 6.
Data analysis
A meta-analysis was conducted using Comprehensive Meta-Analysis (CMA) V4 software under the condition that the included studies exhibited no significant heterogeneity (p > 0.10 and I^2^ < 50). A random-effects model was selected to account for potential variability in the true effect sizes across studies. To perform the analysis, at least four studies per outcome were necessary to calculate weighted group mean differences, 95% confidence intervals (CIs), and heterogeneity p-values. Data on pre- and post-intervention means, standard deviations (SD), and sample sizes were extracted for both the HC and LC groups. When SDs were not directly provided, but standard error, CI 95%, mean change, or percentage change was available, SDs were calculated accordingly. Hedges' g was used to determine effect sizes, interpreted as small (0.2), medium (0.5), and large (0.8) effects [49]. The primary analysis focused on comparing the effects of HC versus LC diets on various outcomes, including total cholesterol, HDL-C, LDL-C, TAG, BM, FFM, FM, upper and lower body strength (1RM). When quantitative analysis was not feasible, findings were summarised descriptively. If heterogeneity or sensitivity analyses indicated high variability, further meta-analysis was avoided, and results were presented individually. Outliers were identified by analysing standardised residuals beyond the ± 1.96 range. Publication bias was assessed through funnel plots (effect size vs. standard error), the “Trim and Fill” method for random effects, and Orwin’s Fail-Safe N analysis.
Results
Study selection
The search strategy is outlined in Fig. 1. An initial search yielded 1,950 potentially relevant references. After reviewing the titles and abstracts, 53 publications were selected for further evaluation. Following this evaluation, 48 studies were excluded, leaving a total of 5 studies [37, 43, 50–52]. Additionally, through references from similar systematic reviews and RCTs, 75 more studies were identified, of which 13 were selected [36, 47, 53–63] and fully reviewed, providing a total of 18 studies for the final meta-analysis. Table S15, summarising the 110 full-text articles assessed and subsequently excluded with reasons for exclusion, is provided in the Supplementary Material.
Characteristics of the included studies
The included studies were generally of high methodological quality, with a low risk of bias as assessed using the Cochrane tools (ROB2_IRPG_beta_v9 for parallel-group designs and ROB2_crossover_beta_v2 for crossover trials). Table S14 (Supplementary Material) summarises the individual risk of bias assessments. Eighteen studies reported valid HC or LC group data, comprising 905 participants (male and female, aged 18–70 years).
Sample sizes ranged from 7 to 138 participants, with similar demographic characteristics within studies. The HC diet groups included 5 to 60 participants, while 6 to 59 subjects were assigned to the LC group. The selected RCTs followed a parallel design [37, 43, 50, 52–55, 57–63], a randomised crossover design [47, 51, 64], or a controlled 3-way crossover design [56].
All eighteen included studies compared energy-matched dietary interventions, with inter-group energy intake differences of ≤ 200 kcal or ≤ 5% of TDCI, contrasting diets providing ≥ 45% vs ≤ 44% of TDCI from carbohydrates.
The methods utilized by the researchers to ensure compliance and accuracy included: TDEE calculation equations, food diaries, diet analysis by software, provided measuring tools, utensils, and digital scales for portion size, handouts with list of foods, meal plans and recipes, specific to each diet group were shared, educational meetings, counselling, and supervision with dieticians, supplementation, urine tests (24 h urine nitrogen/urea/ketone levels), blood ketone levels, blood glucose, regular weigh-ins, all the meals prepared, leftovers returned and measured for accuracy of TDCI.
Several of the included studies employed various methods to calculate the total daily energy expenditure (TDEE), resting metabolic rate (RMR), or basal metabolic rate (BMR) to appropriately tailor the dietary interventions [37, 51, 52], predictive equations [43, 50] and stable isotope analysis [56]. Body composition was measured via various methods, including Dual X-ray absorptiometry (DXA) [37, 43, 50, 51, 53, 54, 57, 62], Bioelectrical Impendence [52, 61], and Digital Scales [60].
Table 1 provides a structured overview of study design, dietary macronutrient distributions, primary outcomes, and key findings in a format that enhances readability while preserving methodological detail for reproducibility; the accompanying GRADE ‘Summary of Findings’ table (Supplementary Table S15) summarises the certainty of evidence across all primary metabolic and anthropometric outcomes.Table 1. Summary of the included StudiesStudyDesignSampleDurationEnergy DistributionDiet composition (mean % CHO/PRO/FAT)ExerciseOutcomesWilson et al. [50]PGN = 25; Men; Age = 18–30; Normal weight11 wksMaintenance calories ≈ 2600 kcal determined by the Mifflin St. Jeor equationHC (55/20/25); LC (5/20/75) CHO reintroduced for the KD at weeks 10 and 11RT, 8 wks, 3 d/wk, 5 to 11 exercises per session; Load increasing weekly 65–95% 1RM and reps deceasing from 15 to 5; Week #1–4 hypertrophy, Week #5–8 maximal strength↑LBM wk 0-10^a^; ↑LBM wk 10-11^f, h^; ↑Wingate PP^b^; ↑SQ & BP^a^; ↔ TC, HDL, LDL; ↑TAG^c^ wk 10–11; ↑Total Testosterone^c^; ↔ Fasted insulinParr et al. [43]PGN = 89; Men and Women; Age = 35–59; Overweight/Obese16 wksReduced 250 kcal/d from maintenance ≈ 1600 kcal; citing that they estimated it based on the SR by Frankenfield et al. [65]HC (55/30/15); LC (40/30/30)RT × 3/wk (48 sessions in 16 wks; Individualised programs based on 1RM and Endurance exercise × 4/wk = 250 kcal/day↓BF^a^; ↑LBM^a^; ↑V̇O_2max_ and 1RM^a^; ↓HOMA-index^a^Cornier et al. [37]PGN = 21; Women; Age = 23–53; Obese16 wksReduced 400 kcal/d from maintenance; Estimates of daily energy intake were made using 3-day food diary, 3-day control diet, and baseline RMR plus an activity factorHC (60/20/20); LC (40/20/40)TDEE was not measured; PA from interviews and questionnaires (unspecified) was tracked to make sure it was the same throughout↓BM^a, e, g^; ↓Fasted insulin^a^; ↔ TC, HDL, LDL, TAGPaoli et al. [52]PGN = 19; Men; Age = 20–40; Normal weight8 wksMaintenance calories ≈ 3500 kcal; The caloric intake of the dietary patterns provided was calculated by assigning an energy expenditure of 45 kcal/kg of muscle mass [49]HC (55/25/20) LC (5/25/70)Competitive Body building preparation↓FM^C^; ↑LBM^b^; ↑1RM^a^; ↑REE^b^; ↓TC^c^; ↑HDL^c, e^; ↓TAG^c, f^; ↓Glucose and Insulin^c, e^; ↓Testosterone in KD^c^: ↓IGF-1^c^; ↓IL-6^c^, ↑IL-6^b^; ↓TNF-Α^c, e^; ↑Max strength (1RM)^a^Layman et al. [54]PGN = 24; Women; Age = 45–56; Overweight/Obese10 wksReduced ≈ 400 kcal/d from maintenance; ≈ 1663 kcal/dayHC (58/16/26); LC (41/30/29)Physical activity was monitored with questionnaires and was kept constant for each subject throughout the study↑ Fat: Lean mass loss^a, d, h^;↓TC^a^; ↓ LDL^a^; ↔ HDL; ↓ TAG^c^; ↔ FINS; ↔ FBGBrehm et al. [57]PGN = 42; Women; Age = 29–59; Overweight/Obese24 wksBaseline: HC (1707 kcal); LC (170 kcal)Mo 3: Hypocaloric; HC (1420 kcal); LC (1119 kcal)Mo 6: Hypocaloric; HC (1373 kcal); LC (1273 kcal)HC—3mo (54/18/28), 6mo (53/18/29); LC—3mo (15/28/57), 6mo (30/23/46);Participants continued with their baseline level of activity. Unspecified↓BM^a, f, h^; ↓FM^a, e, h^; ↓FFM^a, e, h^; ↓TAG^a, d, h^; ↓LC^a^; ↓LDL^a^; ↑HDL^a^; ↓FBG^a^; ↓FINS^a^ (Significantly more for LC at 3 vs 6 mo)Walberg et al. [59]PGN = 12; Women; Age 23–36; Obese5 wks28-d liquid diet ≈ 530 kcal/d; 330 kcal from formula: 33 g protein, 44 g C, 3 g fats; The remaining 200 kcal was added as C or Fats accordinglyHC (71/25/4); LC (33/25/42)Brisk walk or jogging 30-45 min at 60% V̇O_2max_; total calories burnt 248–373 kcal; 3 days/wk↓BM^a^; ↓TC^a^; ↓HDL^a^; ↔ TAG; ↓LDL^a^; ↓V̇O_2max_^a^ (not changed when expressed per kg/bm)Layman et al. [53]PGN = 48, Women Age = 40–56; Overweight/Obese16 wksHypocaloric diet ≈ 1700 kcalHC + ex (45/15/30); LC + ex (40/30/30),Walking 5 d/wk & RT 2 d/wk; Walking > 30 min; RT using 7 machines; ≥ 1 set of 12 repetitions per machine to elicit fatigue by the 12th repetition↓BM^a, e, h^; ↓FM^a, e, h^; ↔ LBM (only in EX groups); ↓in NON-EX; ↓TC^a, e, g^; ↓LDL^a, e, g^; ↓TAG^a^; ↑HDL^c, d^; ↓HDL^b, d^ ↓TAG:HDL^c, d^Racette et al. [58]PGN = 23; Women; Age = 21–47; Overweight/Obese23 wksReduced by 25% from individual’s RMR estimated with the Harris-Bendict formula; ≈1164 kcal/dayWk 0–5: All groups (45/20/35), Wk 5–17: HC + ex (57/24/19); LC (26/25/49) Wk 17–23: All groups (45/20/35)3 d/wk; endurance exercise; 45 min/session; 60–65% V̇O_2max_↓BM^a, d^; ↓FFM^a^; ↓FM^a^; (Aerobic EX had a significant effect in ↓FM P < 0.01); ↔ FBG^a^Ebbeling et al. [56]CO; 4wks per diet; no washout periodN = 21; Men and Women; Age = 18–40; Overweight/Obese16 wksWk 0–3: hypocaloric for 10–15% weight loss; Wk 4–16: Maintenance diet based on TEE assessed by Stable isotope analysisWk 4–16: HC(LF) (59/24/18); LC(VLC) (10/30/60)Allowed unspecified endurance physical activity but prohibited resistance training↑HDL^c, f^; ↓HDL^b^; ↓TAG^c, f^; ↓BM^a^; ↑Cortisol^c, e^; ↑Peripheral and hepatic insulin resistance^b, d^Green D. et al. [51]CO; 3mo per diet; 2wks washout periodN = 12; Men and Women; Age = 24–53; Normal weight24 wksAd libitum ≈ 2066 kcalHC (45/22/33); LC (8/23/69)Competitive Olympic weightlifting training;↓BM^c, d^; ↓LBM^c, d^; ↔ FM; ↔ 1RMDas et al. [55]PGN = 34; Men and Women; Age = 24–42; Overweight/Obese48 wks30% caloric reduction from TEE measured by doubly labeled water [66]HC (40/30/30); LC (60/20/20)TDEE measured with Double-Labelled-Water; No training↓BM^a^; ↓BF^a^; ↓TAG^a^; ↓TC^a^; ↓Insulin^a^; ↑HDL^a^; ↓LDL^a^; ↔ Blood glucoseVolek et al. [36]CO; 4wks per diet; no reported washout periodN = 26; Women; Age ≈ 25–43; Overweight/Obese4 wks − 500 kcal from the nearest 200 kcal increment (≈1931 kcal) of REE obtained using indirect calorimetry; Diet intervention ≈ 1260 kcal/dayHC (59/19/21); LC (9/28/63)Sedentary/moderately active. Recorded but unspecified↓TAG:HDL^c, d^; ↓TC^b, d^; ↓LDL^b, d^; ↓HDL^b, d^; ↓VLDL^c, a^; ↓FINS^c, d^; ↓FBG^c, d^; ↓HOMA-IR^c, d^Keogh et al. [60]PGN = 25; Men and Women; Age = 20–65; Obese12 wks≈ 1434 kcal to achieve 0.5-1 kg/wk weight loss; ≈ 30% energy restriction based on estimated usual intake using FFQ at baseline [67]HC (60/20/20); LC (33/40/27)No training↓BM^a^; ↓FBG^a^; ↓Insulin^a^; ↓TC^a^; ↔ HDL; ↓LDL^a^; ↓TAG^a^Bazzano et al. [61]PGN = 103; Men and Women; Age = 22–75; Obese48 wksBaseline: HC (2034 kcal); LC (1998 kcal) Mo 3: Hypocaloric; HC (1418 kcal); LC (1258 kcal) Mo 6: Hypocaloric; HC (1481 kcal); LC (1324 kcal) Mo 12: Hypocaloric; HC (1527 kcal); LC (1448 kcal)HC (54/19/30); LC (34/24/41)Participants in each group were asked to refrain from changing their physical activity levels during the intervention↓BM^a, e, h^;↓BF^a, d, h^; ↑LBM^c, e^; ↔ TC; ↔ LDL; ↑HDL^c, f^; ↓TC:HDL^c, e^; ↓TAG^c, e^; ↓Insulin^a^; ↔ FBGSummer et al. [62]PGN = 81; Women; Age > 18; Overweight/Obese16–24 wksBaseline: HC (1949 kcal); LC (1874 kcal) Post-intervention: HC (1342 kcal); LC (1405 kcal)HC(AHA Step I) (50/19/31); LC(Atkins) (27/24/49)Maintained the same level of physical activity. Pedometers were worn to monitor daily step counts↓BM^c, d, h^; ↓FM^c, d, h^Morgan et al. [63]PGN = 293; Men and Women; Age = 21–60; Overweight/Obese24 wksBaseline: HC (2426 kcal); LC (2283 kcal) Mo 2: Hypocaloric; HC (1534 kcal); LC (1627 kcal) Mo 6: Hypocaloric; HC (1485 kcal); LC (1631 kcal)HC(Rosemary Conley) (48/20/31); LC(Atkins) (18/26/51)No training↓BM^a^; ↓LDL^b^; ↓TAG^a^; ↓HDL^b, h^Buga et al. [47]CO; 6wks per diet; 2wks washout periodN = 7; Men; Age 18–45; Highly trained endurance athletes12 wksAd libitum; Overal Mean: HC (2837 kcal); LC (2947 kcal)HC(56/15/28); LC(6/25/69)Participants were instructed to keep their usual exercise routine unchanged and maintain a consistent training intensity and volume throughout the study↓TAG^c, e, h^; ↓VLDL^c, e, h^; ↓TAG:HDL^c, e, h^; ↑TC^c, e, h^; ↑LDL^c, e, h^; ↑HDL^c, d, h^ ↔ FBG; ↔ HbA1cLG: Low glycaemic load; LGI: Low glycaemic index; HG: High glycaemic load; VLC: Very low carbohydrate; CR: Calorie reduction; HC: High carbohydrate; LC: Low carbohydrate; LF: Low fat; wks: weeks; mo: months; PINS: Postprandial insulin; FBG: Fasting blood glucose; BG: Blood glucose; TAG: Triglycerides; PBG: Postprandial blood glucose; FINS: Fasting insulin; TAG: Triglycerides; HDL: High-density lipoprotein; LDL: Low-density lipoprotein; TC: Total Clesterol; WD: Western diet; KD: Ketogenic diet; C: Carbohydrates; P: Protein; F: Fats; PRO: protein group; C: carbohydrate group; EX: Exercise group; LF: Low fat; LBM: Lean body mass; BF: Body fat; BM: Body weight; SQ: Squat; BP: Bench press; RT: Resistance Training; h: Hours; PP: Peak power; PG: Parallel Groups Design; CO: Crossover design^a^Significant difference p < 0.05 from baseline for both groups; ^b^Significant difference from baseline only for HC; ^c^Significant difference from baseline only for LC; ^d^Significant difference between LC vs HC P < 0.05; ^e^significant difference between LC vs HC P < 0.01; ^f^: significant difference between LC vs HC P < 0.001; ^g^Significantly greater for HC vs LC; ^h^Significantly greater for LC vs HC; ↑: significant increase from baseline; ↓: significant reduction from baseline; ↔ : no significant difference from baseline; ^a^Significantly greater for HC; ^b^Significantly greater for LC; ^c^No difference between HC and LC
Changes in the analysed variables
Primary outcomes
Changes in FBG
From the 11 studies analysing changes in FBG, the mean effect size was small and significant (g = − 0.364, 95% CI = − 0.709 to − 0.019, P < 0.001). The sensitivity analysis showed that none of the studies contributed disproportionately to the results of the meta-analysis. No significant heterogeneity was found within the 11 treatments. As shown in Fig. 2A, LC diets resulted in greater reductions in fasting blood glucose (FBG) compared to HC diets, with no outliers detected. Among the 11 studies reporting FBG changes, 5 included training (TR) and 6 did not (NT). Both NT and TR subgroups showed significant reductions in fasting blood glucose (NT: g = − 0.281, 95% CI = − 0.488 to − 0.074, P = 0.008; TR: g = − 0.636, 95% CI = − 1.009 to − 0.262, P = 0.001). Although the TR subgroup exhibited a larger numerical reduction, the difference in the magnitude of FBG reduction between the TR and NT subgroups was not statistically significant. Funnel plot inspection revealed no major asymmetry, suggesting a low risk of publication bias for this outcome (Fig. S1 supplementary material).Fig. 2. Fast Blood Glucose (FBG), Panel A and Fasting Insulin (FINS), Panel B Forest plot. Results of a random-effects meta-analysis are shown as g effect size with 95% confidence interval. The black and white diamonds represent the subgroups (TR and NT) and pooled (overall) standardised mean difference respectively. TR Training, NT Not-Training, CI confidence interval
Changes in FINS
From the 11 studies analysing changes in FINS, the mean effect size was very small and significant (g = − 0.190, 95% CI = − 0.361 to − 0.014, P = 0.034). The sensitivity analysis showed that none of the studies contributed disproportionately to the results of the meta-analysis. No significant heterogeneity was found within the 11 treatments. As shown in Fig. 2B, LC diets led to a greater reduction in fasting insulin (FINS) compared to HC diets, with no outliers identified among the included studies. Subgroup analysis of the 11 studies reporting FINS changes revealed that 4 included training (TR) and 7 did not (NT). In the NT subgroup, the effect size was very small and not statistically significant (g = − 0.154, 95% CI = − 0.356 to 0.048, P = 0.135). Similarly, in the TR subgroup, the effect size was small and non-significant (g = − 0.302, 95% CI = − 0.658 to 0.055, P = 0.097). No significant differences were found between the TR and NT subgroups in terms of FINS reduction. Visual inspection of the funnel plot showed slight asymmetry, with smaller studies tending toward larger effects, which may indicate mild small-study effects or bias (Fig. S2 supplementary material).
Changes in TC
Across 13 studies assessing TC changes, the mean effect size was very small and not statistically significant (g = − 0.150; 95% CI − 0.362 to 0.062; P = 0.086), with no significant heterogeneity across studies. As shown in Fig. 3A, TC levels did not significantly differ between HC and LC groups. Subgroup analysis of the 13 studies (6 with training [TR], 7 without [NT]) also showed non-significant and small effect sizes for both subgroups (NT, g = − 0.090, 95% CI = − 0.322 to 0.141, P = 0.443; TR g = − 0.471, 95% CI = − 1.008 to 0.066, P = 0.086). No significant differences in effect sizes were found between TR and NT subgroups. The funnel plot appeared symmetric, supporting a low likelihood of publication bias for this outcome (Fig. S3 supplementary material).Fig. 3. Total Cholesterol (TC), Panel A and Triglycerides (TAG), Panel B Forest plot. Results of a random-effects meta-analysis are shown as g effect size with 95% confidence interval. The black and white diamonds represent the subgroups (TR and NT) and pooled (overall) standardised mean difference respectively. TR Training, NT Not-Training, CI confidence interval
Changes in TAG
From the 15 studies assessing TAG changes, the mean effect size was small to moderate and statistically significant (g = − 0.379; 95% CI − 0.540 to − 0.219; P < 0.001), with no significant heterogeneity or outliers detected. As shown in Fig. 3B, LC diets reduced TAG more effectively than HC diets. Subgroup analysis (7 TR, 8 NT) revealed significant reductions in both groups, with no significant difference observed between the subgroups (TR: g = − 0.400; 95% CI − 0.678 to − 0.122;* P* = 0.005; NT: g = − 0.369; 95% CI − 0.566 to − 0.172; P < 0.001). The funnel plot showed mild asymmetry favouring LC, which may reflect small-study effects or variability in study size (Fig. S4 supplementary material).
Changes in LDL-C
Across 14 studies assessing LDL-C, the mean effect size was small but statistically significant (g = − 0.225; 95% CI − 0.406 to − 0.043; P = 0.015), with no significant heterogeneity or outliers identified. As shown in Fig. 4A, HC diets reduced LDL-C more effectively than LC diets. Subgroup analysis (6 TR, 8 NT) showed small, but not significant effects for TR (g = − 0.344; 95% CI − 0.831 to 0.143; P = 0.166) and small, but significant effects for NT groups (g = − 0.205; 95% CI − 0.401 to − 0.010; P = 0.040), with no significant difference between subgroups. Funnel plot asymmetry was minimal, indicating a low risk of publication bias in LDL-C comparisons (Fig. S5 supplementary material).Fig. 4. Low-Density Lipoprotein Cholesterol (LDL), Panel A and High-Density Lipoprotein Cholesterol (HDL), Panel B Forest plot. Results of a random-effects meta-analysis are shown as g effect size with 95% confidence interval. The black and white diamonds represent the subgroups (TR and NT) and pooled (overall) standardised mean difference respectively. TR Training, NT Not-Training, CI confidence interval
Changes in HDL-C
Across 15 studies assessing HDL-C changes, the mean effect size was small to moderate and statistically significant (g = 0.389, 95% CI = 0.229 to 0.550, P < 0.001), with no evidence of significant heterogeneity or influential outliers. As shown in Fig. 4B, LC diets increased HDL-C significantly more than HC diets. Subgroup analysis (n = 15; 7 TR, 8 NT) also revealed significant and similar effects for both TR (g = 0.397; 95% CI 0.120 to 0.675;* P* = 0.005) and NT groups (g = 0.385; 95% CI 0.188 to 0.582; P < 0.001), with no significant differences between subgroups. The HDL-C funnel plot showed mild asymmetry, with some smaller studies reporting larger positive effects, suggesting a possible small-study effect (Fig. S6 supplementary material).
Secondary outcomes
Changes in BM
From the 11 studies assessing changes in BM, the overall effect size was very small but statistically significant (g = − 0.183; 95% CI − 0.349 to − 0.017; P = 0.031), with no outliers or significant heterogeneity identified. As shown in Figure S7 (supplementary material), no significant BM differences were found between HC and LC groups. Subgroup analysis (5 TR, 6 NT) also showed minimal effects in both groups (TR: g = − 0.154; 95% CI − 0.467 to 0.159; P = 0.334; NT: g = − 0.195; 95% CI − 0.391 to 0.002; P = 0.052), with no significant differences between subgroups. The funnel plot was visually symmetrical, indicating low risk of publication bias for this outcome (Fig. S8 supplementary material).
Changes in FM
From the 7 studies assessing FM, the overall effect size was small but significant (g = − 0.304; 95% CI − 0.548 to − 0.059; P = 0.015), with no outliers or significant heterogeneity detected. As shown in Figure S9 (supplementary material), FM was significantly reduced in the LC groups compared to the HC. Subgroup analysis (5 TR, 2 NT) revealed small, non-significant trends for both groups (NT: g = − 0.271; 95% CI − 0.632 to 0.090; P = 0.141; TR: g = − 0.331; 95% CI − 0.664 to 0.001; P = 0.051), with no significant differences between subgroups. Funnel plot inspection suggested some asymmetry, with smaller studies showing stronger LC effects, which may indicate a potential small-study effect (Fig. S10 supplementary material).
Changes in FFM
Across 5 studies examining FFM, the overall effect size was very small and not significant (g = 0.126; 95% CI − 0.167 to 0.419; P = 0.401), with no outliers or significant heterogeneity observed. As shown in Figure S11 (supplementary material), there were no significant differences in FFM between HC and LC groups. Subgroup analysis (3 TR, 2 NT) also showed non-significant and very small effect sizes (TR: g = 0.099; 95% CI − 0.275 to 0.473; P = 0.602; NT: g = 0.168; 95% CI − 0.304 to 0.640; P = 0.486), with no differences between subgroups. Although the FFM funnel plot appears visually symmetrical, the number of included studies was small (k = 5). Funnel plot interpretation is unreliable with fewer than 10 studies. Therefore, no conclusions regarding publication bias can be drawn. (Fig. S12 supplementary material).
Synthesis of results
Following the GRADE approach, the overall quality of evidence was rated as high for the effects of a LC diet (≤ 44% of total daily caloric intake from carbohydrates) compared to a HC diet (≥ 45% CHO). High-certainty evidence supported beneficial effects of the LC diet on HDL-C, TAG, BM, FM, FINS and FBG in healthy adults. Conversely, there was high-certainty evidence favouring the HC diet for reducing LDL-C. The certainty of evidence was rated as low for TC and FFM.
Discussion
This meta-analysis indicates that, under energy-matched conditions, LC (≤ 44% of TDCI) diets produce modest yet favourable changes in several cardiometabolic health markers compared with HC (≥ 45% TDCI) diets in healthy adults. Variability among studies was mainly attributable to differences in sample size, intervention duration, and methods used to assess energy intake and body composition. These factors were accounted for in the Risk of Bias assessment and are summarised in Supplementary Table S13.
Notably, the effects of both dietary approaches on fasting glucose, HDL-C, triglycerides, LDL-C, body mass, fat mass, and fat-free mass were generally consistent regardless of participants' engagement in regular physical activity. This suggests that the benefits observed are primarily driven by macronutrient composition rather than exercise status.
FBG was significantly reduced in participants following LC diets, with a pooled effect size of g = − 0.364. This directionally consistent finding across 8 of 11 studies suggests a robust effect, even in participants with normal glycaemic control at baseline. Although small, this reduction may carry clinical relevance, particularly for individuals at risk of insulin resistance [8]. These effects appear to occur independently of energy restriction, highlighting the role of macronutrient composition in glycaemic regulation [7].
FINS was also lower in the LC groups, with a pooled effect size of g = − 0.190, with all the 11 studies showing reductions. These findings align with those of Hashimoto et al. [68], who reported improved insulin sensitivity and lower TAG under energy-matched LC conditions in overweight Japanese men. The trend across studies suggests a beneficial effect of LC diets on early insulin dynamics.
Even though TC showed no significant difference with a pooled effect size of g = − 0.150, likely due to offsetting changes in HDL-C and LDL-C, blood lipid responses also favoured LC diets. TAG were significantly reduced with a pooled effect size of g = − 0.379 and HDL-C increased significantly with a pooled effect size of g = 0.389. These effects were observed across varied populations and durations and align with established physiological responses to reduced carbohydrate intake, including enhanced reverse cholesterol transport and lower hepatic triglyceride synthesis. TAG decreased in 13 of 15 studies, and HDL-C rose in 11 of 15, reinforcing the reliability of these changes. Importantly, the TAG:FBG index (Tyg index) has been strongly correlated with the hyperinsulinemic-euglycemic clamp, the gold standard for assessing insulin sensitivity and has been proven to be better than the HOMA-IR for evaluation of insulin resistance/sensitivity [69–71]. Therefore, the findings that LC diets can decrease insulin resistance are even more relevant as the level of TAG and HDL is directly related to levels of insulin resistance.
Conversely, LDL-C was reduced to a greater extent in HC groups with a pooled effect size of g = − 0.225, although this change was small and limited to 7 of 14 studies. Nonetheless, it is worth clarifying that different LDL subfractions have been associated with distinct lipid profiles and varying atherogenic potential. Larger, more buoyant LDL particles (Pattern A) are considered less harmful, whereas smaller, denser LDL particles (Pattern B) remain in circulation for longer periods, are more susceptible to oxidative modification, and more readily penetrate the arterial wall, contributing to atherogenesis. This increased risk is independent of total LDL-C concentration [72]. Moreover, LDL particle size has been shown to increase under LC compared to HC diets, reflecting a shift toward larger, less dense, and less atherogenic LDL subfractions [8, 63]. A recent one-year study of 100 individuals on a ketogenic diet reported substantial elevations in LDL-C and ApoB; however, neither baseline ApoB levels nor their changes were associated with non-calcified plaque volume or total plaque burden, as assessed by coronary computed tomography angiography [73]. Although direct assessment of LDL particle size is not routinely conducted in clinical settings, the TAG to HDL-cholesterol ratio (TAG/HDL-C) is considered a practical surrogate. Ratios exceeding 3.5 are indicative of a predominance of small, dense LDL particles and are frequently associated with insulin resistance [74]. The TAG/HDL-C ratio has been identified as one of the best markers to predict the risk of developing atherosclerosis, cardiovascular disease and type 2 diabetes [74–77]. In addition, a systematic review by Ravnskov et al. [78] challenged this conventional interpretation of LDL-C, reporting no consistent association between LDL-C and cardiovascular disease in individuals over 60 years of age, and even suggested an inverse relationship with all-cause mortality. These findings highlight the complexity of LDL-C as a biomarker and underscore the importance of evaluating lipid profiles within the broader context of age, metabolic status, and particle quality.
In terms of body composition, LC diets led to small but statistically significant reductions in body mass with a pooled effect size of g = − 0.183, and FM g = − S0.304. No significant differences in FFM were observed with a pooled effect size of g = 0.126. The greater reduction of FM in all 12 relevant studies, through the LC, suggests that higher carbohydrate distribution may influence nutrient partitioning, water retention, or satiety, even under energy-matched conditions. The consistent preservation of FFM supports the importance of adequate protein and physical activity over carbohydrate content in maintaining lean tissue [28, 79]. The observed no effect of diet type on FFM reduction also counters common concerns about muscle loss on LC diets when protein intake is ≥ 1.6 g/kg BW and combined with resistance training [50]. These results suggest LC diets may confer modest metabolic advantages in healthy adults without requiring energy restriction. Improvements in FBG, HDL-C, and TAG highlight the role of macronutrient distribution in regulating cardiometabolic risk.
Our findings support previous meta-analyses, including those by Santos et al. [80] and Mansoor et al. [81], which also reported improved glycaemic and lipid outcomes with LC diets. However, our review differs in its exclusive focus on energy-matched interventions in healthy adult populations. Prior reviews included trials with hypocaloric protocols, pharmacological interventions, or participants with obesity or metabolic disease and adolescents [68, 82–85]. By isolating the effect of carbohydrate distribution under energy-controlled conditions, the current review offers a clearer understanding of its independent impact.
Additionally, consistent findings across studies with varied participant sex, training status, and intervention durations suggest that the benefits of LC diets may extend to a broad range of healthy individuals. The small effect sizes (especially in glycaemic outcomes) reflect the already healthy baseline profiles of the participants, which may have limited the degree of observable change.
In summary, LC diets resulted in more favourable changes in fasting glucose, HDL-C, and TAG compared to HC diets under energy-matched conditions. Reductions in LDL-C were slightly more pronounced with HC diets, though the broader lipid profile supported LC benefits. Favourable reductions in body mass and FM occurred with LC diets, while FFM was preserved. These findings indicate that LC diets (< 45% TDCI) are a viable dietary strategy for improving cardiometabolic and body composition markers in healthy adults.
Although the present analysis focused on directly measured outcomes such as glycaemic and lipid markers, LC and HC diets may also exert broader metabolic effects through hormonal and molecular pathways [37, 86, 87]. Factors such as insulin, leptin [88, 89], cortisol, and sex hormones [90–101] could partly mediate the observed differences, warranting further mechanistic research beyond the scope of this meta-analysis.
The differential effects observed between LC and HC diets may partly reflect hormonal adaptations influencing substrate utilization and energy partitioning. Lower carbohydrate intake can reduce postprandial insulin secretion, thereby promoting greater reliance on lipid oxidation and improving triglyceride clearance. Conversely, higher carbohydrate intake increases hepatic glycogen storage and may enhance LDL-cholesterol clearance through upregulation of LDL receptors. These mechanisms, together with differences in leptin and cortisol responses, may underlie the observed lipid and glycaemic patterns.
Limitations and recommendations for future studies
Several limitations should be considered when interpreting these results. Although most of the included studies lasted more than eight weeks, the minimum threshold of four weeks may not fully capture longer-term physiological adaptations. Additionally, all trials were conducted under free-living conditions, limiting dietary control. Despite the use of food diaries, consultations, and biochemical monitoring, self-reported dietary intake is subject to underreporting and measurement error [102–105].
To target healthy, non-medicated populations, studies containing the terms ‘patient’ or ‘hospit*’* were intentionally excluded; however, this restriction may have inadvertently omitted some eligible trials involving clinically stable individuals, constituting a minor limitation.
There was considerable heterogeneity in participant characteristics, including sex, physical activity levels, and body composition. While all participants were classified as healthy adults, such variation may reduce the generalisability of the pooled estimates. Sample sizes also varied widely, influencing the weighting and precision of individual study outcomes. Additionally, hormonal profiles and menopausal status were rarely reported, despite their known influence on lipid metabolism and insulin sensitivity.
Future studies should aim to implement longer interventions, controlled feeding environments, and more homogeneous participant selection. Stratified reporting by sex, hormonal status, and physical activity level would allow for more nuanced interpretation and enhance the accuracy and applicability of findings.
Conclusions
LC diets (≤ 44% TDCI) result in modest but statistically significant improvements in HDL-C, TAG, FBG, BM, and FINS compared to HC diets (≥ 45% TDCI) under energy-matched conditions in healthy adults. Importantly, these effects were largely consistent in both physically active and inactive individuals. In contrast, HC diets were more effective in reducing LDL-C. No significant differences were observed in TC and FFM. These findings support the role of carbohydrate distribution, independent of physical activity status, in shaping metabolic and body composition outcomes.
Supplementary Information
Below is the link to the electronic supplementary material.Supplementary file1 (DOCX 42 KB)Supplementary file2 (DOCX 30 KB)Supplementary file3 (DOCX 29 KB)Supplementary file4 (PDF 56 KB)Supplementary file5 (PDF 55 KB)Supplementary file6 (PDF 55 KB)Supplementary file7 (PDF 56 KB)Supplementary file8 (PDF 55 KB)Supplementary file9 (PDF 56 KB)Supplementary file10 (JPG 140 KB)Supplementary file11 (PDF 54 KB)Supplementary file12 (JPG 118 KB)Supplementary file13 (PDF 53 KB)Supplementary file14 (JPG 105 KB)Supplementary file15 (PDF 52 KB)
The reference list from the paper itself. Each links out to its DOI / PubMed record.
- 1Luo P, Cao Y, Li P, et al (2022) Ty G index performs better than HOMA-IR in Chinese type 2 diabetes mellitus with a BMI <35 kg/m 2: a hyperglycemic clamp validated study. Med (Lithuania) 58(7):876. 10.3390/medicina 58070876