Mitochondrial integrity modulates mTOR signaling and podocyte function
Cem Özel, Khawla Abualia, Duc Nguyen-Minh, Mahsa Matin, David Unnersjö-Jess, Martin Höhne, Wilhelm Bloch, Henning Hagmann, Richard J.M. Coward, Sebastian Brähler, Bernhard Schermer, Thomas Benzing, Philipp Antczak, Paul T. Brinkkötter

TL;DR
Mitochondrial health affects kidney cell function and disease, with OMA1 playing a key role in regulating this process.
Contribution
The study reveals that OMA1 ablation rescues glomerular disease in PHB2-deficient mice.
Findings
OMA1 ablation rescues glomerular disease in PHB2-deficient mice.
Mitochondrial dysfunction sensitizes podocytes to insulin, triggering mTOR overactivation.
mTOR hyperactivity alone does not drive glomerular disease.
Abstract
Mitochondrial dysfunction has emerged as a key contributor to the pathogenesis of steroid-resistant nephrotic syndrome (SRNS) and genetic focal-segmental glomerulosclerosis (FSGS). This study explores the role of mitochondrial integrity in podocyte biology, focusing on the impact of OMA1, a critical regulator of mitochondrial morphology. Using a model of disrupted mitochondrial homeostasis, we show that mitochondrial dysfunction sensitizes podocytes to insulin, triggering the overactivation of mTOR signaling. Disruption of OMA1 function was achieved through the deletion of Oma1 or a podocyte-specific knockout of its regulator Phb2. Remarkably, simultaneous Oma1 deletion extended the lifespan of severely affected Phb2pko mice, alleviated proteinuria, and restored mitochondrial morphology. Increased mTOR activity was observed in Phb2pko, Oma1del, and Phb2/Oma1 double-knockout mice. Our…
Genes, proteins, chemicals, diseases, species, mutations and cell lines named across the full text — each resolved to its canonical identifier and authoritative record.
Click any figure to enlarge with its caption.
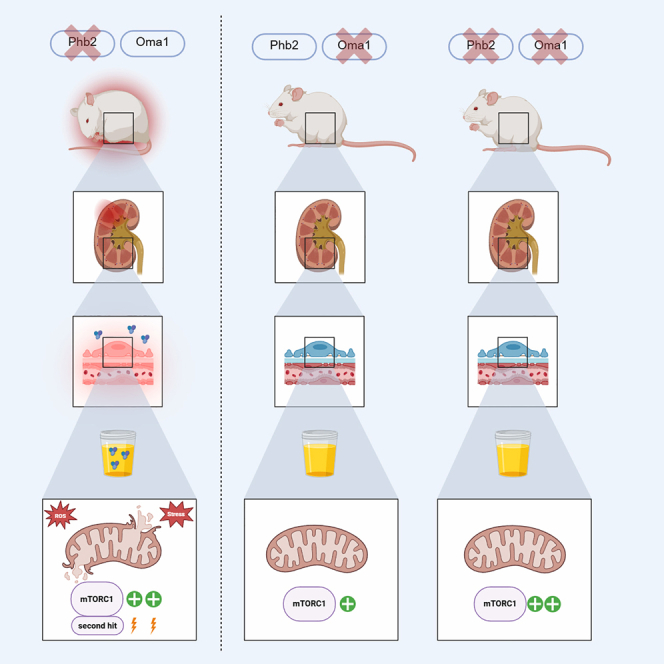 Figure 1
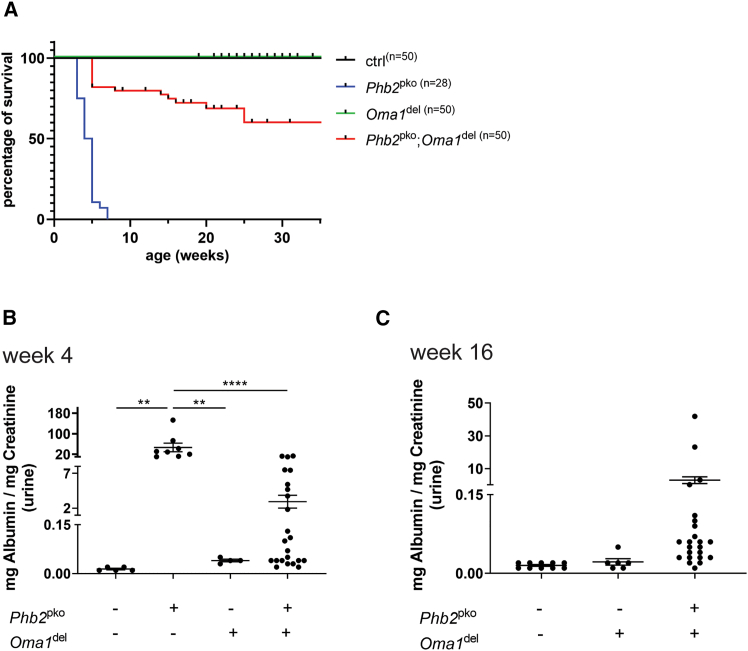 Figure 2
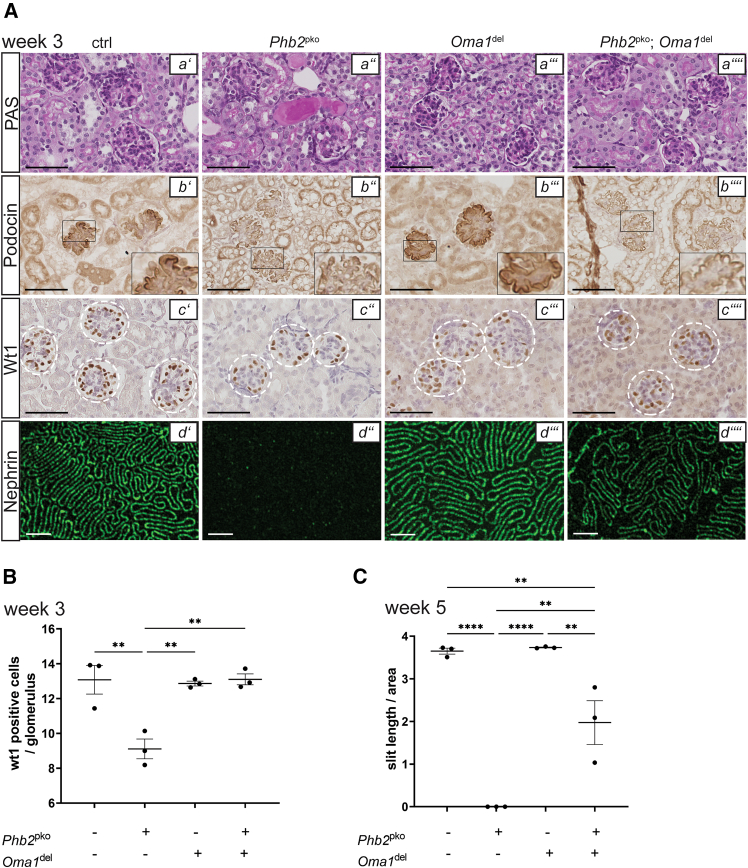 Figure 3
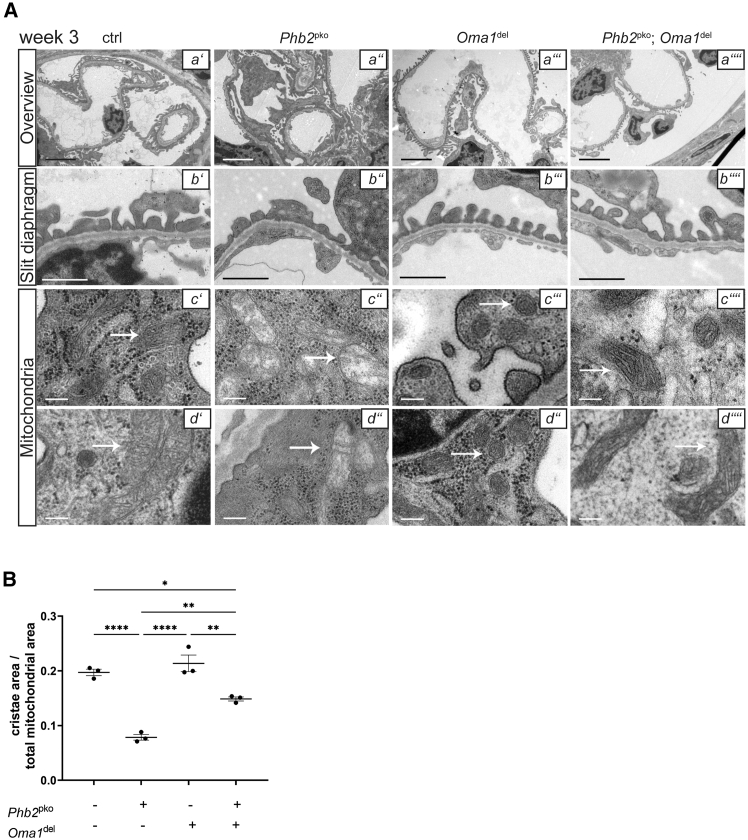 Figure 4
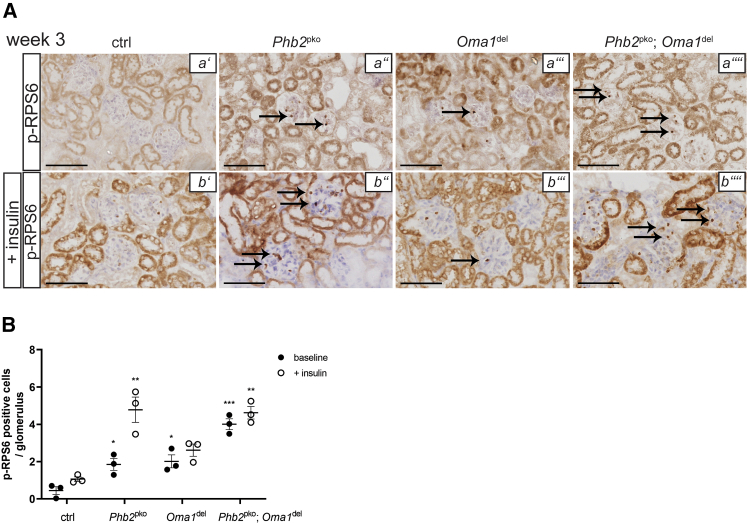 Figure 5
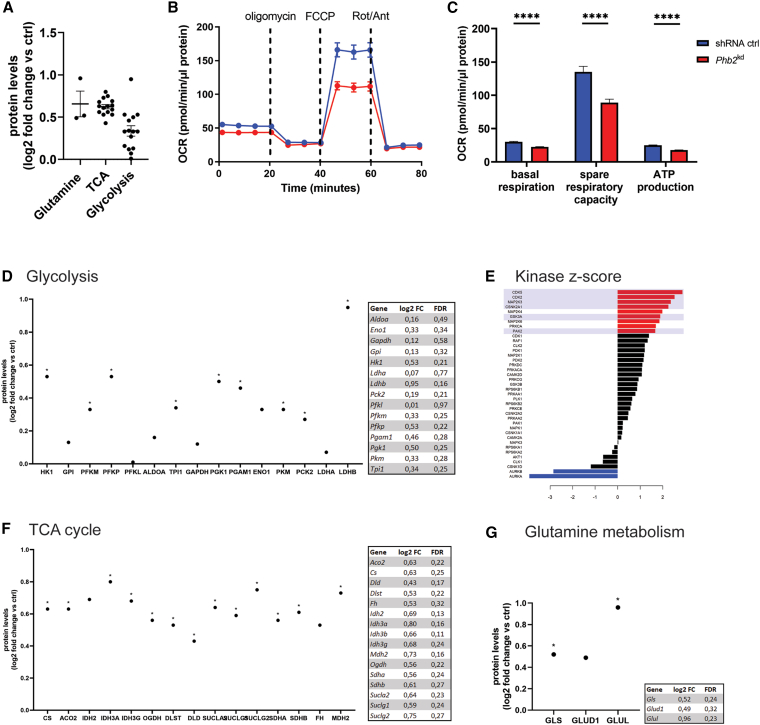 Figure 6
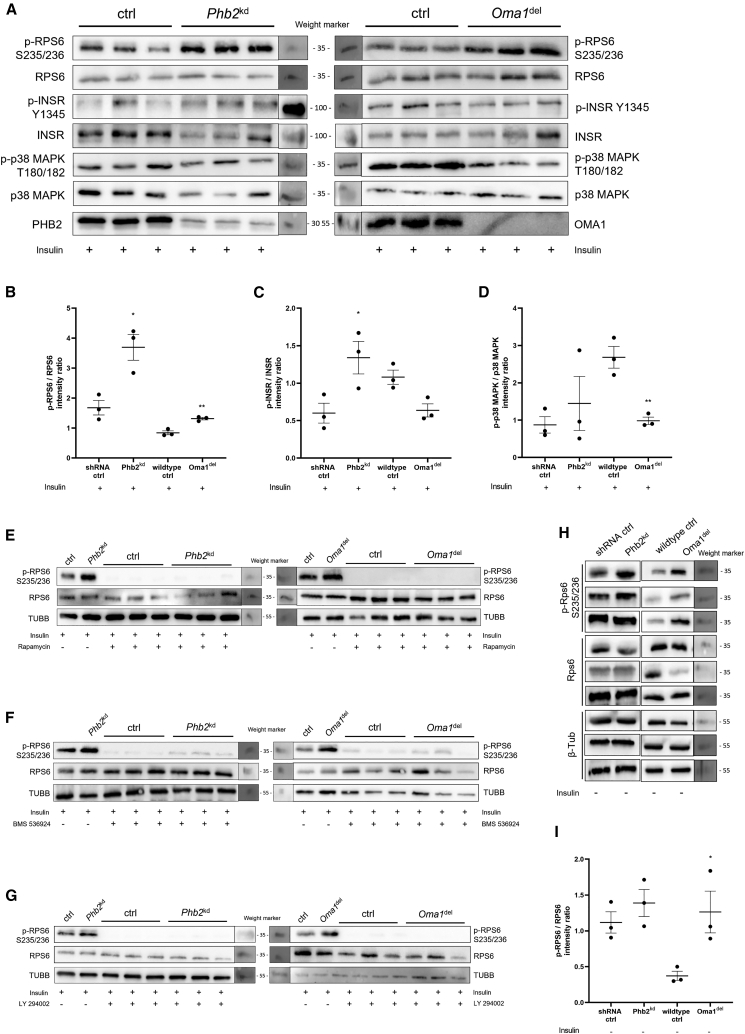 Figure 7
Peer Reviews
No public reviews on file for this paper yet. If you reviewed it on a platform where reviews are public (OpenReview, ICLR, NeurIPS, ICML), you can paste yours below so the community can read it here.
Videos
No videos yet. Explain this paper in a talk, walkthrough, or lecture? Add one.
Taxonomy
TopicsRenal Diseases and Glomerulopathies · Mitochondrial Function and Pathology · Genetic and Kidney Cyst Diseases
Introduction
In most cases, kidney diseases evolve from the filtering unit of the blood, the glomeruli.1 While damage to all three components of the glomerular filtration barrier – podocytes, endothelial cells, or the glomerular basement membrane – might lead to nephrotic syndrome, most glomerular diseases originate from podocytes.2^,^3 Many factors, such as genetic mutations, metabolic disorders, or chemical stressors, can contribute to the development of glomerular disease; the accompanying histological pattern of FSGS can be observed in most cases, especially when leading to end-stage renal disease.4^,^5 To better understand the underlying mechanisms of glomerular diseases, it is essential to consider the cellular processes that influence the function and integrity of podocytes. Mitochondria play a crucial role in this context by orchestrating cellular metabolism and bioenergetics, generating ATP through oxidative phosphorylation, utilizing the tricarboxylic acid (TCA) cycle, and β-oxidation of fatty acids.6 Additionally, mitochondria regulate apoptosis, modulate intracellular signaling, and control protein quality.7^,^8^,^9^,^10 Dysfunction of mitochondria has been implicated in various diseases and age-related conditions.11^,^12 To adapt to the changing bioenergetic demands and to maintain their intracellular structure and distribution, mitochondria undergo cycles of fusion and fission, collectively known as “mitochondrial dynamics.”13 While mitochondrial fission facilitates apoptosis and mitophagy, mitochondrial fusion allows impaired mitochondria to merge, complementing each other and promoting cell survival.14^,^15
Previously, we established a link between mitochondrial dysfunction, overactive insulin signaling, and mTOR activation. We showed that podocyte-specific Phb2 knockout mice exhibit reduced lifespan, proteinuric kidney failure, and increased the phosphorylation of mTOR downstream effector ribosomal protein S6 (RPS6).16 Inhibition of mTOR with rapamycin or simultaneous genetic deletion of both insulin and insulin growth factor 1 (Igf1) receptors alleviated RPS6 hyperphosphorylation, mitigated renal disease, and extended lifespan, suggesting that altered metabolic signaling plays a significant role in glomerular disease development and progression.16 Prohibitins, specifically Prohibitin 1 (PHB1) and Prohibitin 2 (PHB2), are not primarily involved in respiratory chain assembly or function and reside in the inner mitochondrial membrane, forming multimeric ring complexes that stabilize the inner mitochondrial membrane and create functional lipid microcompartments within it.17 OMA1, a key peptidase whose activity is regulated by prohibitins, is encapsulated within these lipid microcompartments. As a result of cellular stress, these lipid microcompartments open, releasing OMA1, which in turn cleaves OPA1 into shorter isoforms, S-OPA1, promoting mitochondrial fission.18^,^19^,^20^,^21
To deepen our understanding of the relationship between mitochondrial dysfunction and glomerular disease, we used Phb2-deficient mice as a model to study mitochondrial disease.2^,^22 Specifically, we investigated the role of OMA1-mediated mitochondrial processing in podocyte biology in vivo by disrupting OMA1 function through podocyte-specific Phb2 knockout, with and without the additional depletion of OMA1. Additionally, we isolated Oma1^del^ podocytes and generated Phb2^kd^ podocytes for comprehensive in vitro immunoblot studies following insulin treatment. In summary, this study investigated the effects of disrupted mitochondrial integrity on the metabolic signaling of podocytes, aiming to elucidate the poorly understood mechanisms underlying its contribution to glomerular diseases.
Results
Oma1 ablation ameliorates nephrotic syndrome and enhances the survival of podocyte-specific prohibitin 2 knockout mice
Oma1^del^ mice exhibited normal kidney function and lifespan, while Phb2^pko^ mice displayed nephrotic-range proteinuria and premature mortality at six weeks (Figures 1A–1C). Simultaneous genetic deletion of Oma1 in Phb2^pko^ mice led to a significant improvement of proteinuria, thereby ameliorating the overall disease phenotype (Figures 1B and 1C). The survival rate of Oma1 deficient Phb2^pko^ mice was markedly improved, with a mortality rate of 40% at 35 weeks (Figure 1A). Histology at three weeks of age revealed FSGS and widespread protein casts in the kidneys of Phb2^pko^ mice, whereas these abnormalities were absent in Oma1^del^ mice and mice with both Phb2^pko^ and Oma1^del^ (Figure 2A). The reduced expression of podocin and nephrin in Phb2^pko^ mice was also partially restored by simultaneous Oma1 ablation, leading to an increase in slit diaphragm length (Figures 2A and 2C). Quantification of podocytes through the staining of their specific nuclear marker Wilms Tumor 1 (WT1) showed a significantly lower count in Phb2^pko^ mice, which was recovered by Oma1 ablation (Figures 2A and 2B). Oma1^del^ mice exhibited no significant alterations compared to wildtype control in transmission electron microscopy (TEM) (Figures 3A and 3B). In Phb2^pko^ mice, TEM revealed profound alterations in mitochondrial morphology. Quantitative analysis confirmed a severe loss of mitochondrial cristae structure in Phb2pko mice compared to controls (Figures 3A and 3B). This loss of cristae structure was significantly, albeit partially, rescued by additional Oma1 deletion (Figures 3A and 3B).Figure 1Oma1 ablation ameliorates nephrotic syndrome and enhances the survival of podocyte-specific Phb2 knockout mice(A and B) Kaplan-Meier survival curve. Phb2^fl/fl^; Oma1^wt/wt^; Nphs2-Cre^wt/wt^ mice served as ctrl (B) urinary albumin/creatinine ratio at week 4. Data are presented as mean ± SEM. ∗p < 0.05; ∗∗p < 0.01; ∗∗∗p < 0.001; ∗∗∗∗p < 0.0001. Statistical analysis was performed using one-way ANOVA followed by Tukey’s multiple comparison test. All pairwise group comparisons were tested, and only significant differences are indicated by asterisks. Sample size: ctrl n = 5; Phb2^pko^n = 8; Oma1^del^n = 4; Phb2^pko^; Oma1^del^n = 23.(C) Urinary albumin/creatinine ratio at week 16. Data are presented as mean ± SEM. ∗p < 0.05; ∗∗p < 0.01; ∗∗∗p < 0.001; ∗∗∗∗p < 0.0001.Statistical analysis was performed using one-way ANOVA followed by Tukey’s multiple comparison test. All pairwise group comparisons were tested, and only significant differences are indicated by asterisks. Sample size: ctrl n = 10; Oma1^del^n = 6; Phb2^pko^; Oma1^del^n = 23.Figure 2Oma1 ablation enhances podocyte survival and slit-diaphragm length of podocyte-specific Phb2 knockout mice(A) Representative periodic acid-Schiff (PAS; a' – a'''') and immunostainings (IHC; Podocin b' – b''''; Wilms Tumor 1 (WT1) c' – c'''') at three weeks (40x magnification, scale bars = 20 μm). STED microscopy at five weeks (d' – d''''; scale bars = 2 μm). Images are representative of n = 3 animals per group.(B) Average number of WT1 positive cells per glomerulus at three weeks. Data are presented as mean ± SEM. ∗p < 0.05; ∗∗p < 0.01; ∗∗∗p < 0.001; ∗∗∗∗p < 0.0001. Statistical analysis was performed using one-way ANOVA followed by Tukey’s multiple comparison test. All pairwise group comparisons were tested, and only significant differences are indicated by asterisks. n = 3 for all experimental groups; >20 glomeruli per mouse were assessed manually.(C) Average slit diaphragm length measured semiautomatically in Stimulated Emission Depletion microscopy (STED) images stained for nephrin at five weeks. Data are presented as mean ± SEM. ∗p < 0.05; ∗∗p < 0.01; ∗∗∗p < 0.001; ∗∗∗∗p < 0.0001.Statistical analysis was performed using one-way ANOVA followed by Tukey’s multiple comparison test. All pairwise group comparisons were tested, and only significant differences are indicated by asterisks. n = 3 for all experimental groups.Figure 3Oma1 ablation rescues slit diaphragm organization and mitochondrial morphology of Phb2^pko^ mice(A) Transmission electron microscopy (TEM) of glomeruli (a' – a''''; 4000x magnification, scale bars = 1 μm), slit diaphragm (b' – b''''; 12,000x magnification, scale bars = 500 nm) and podocyte mitochondria (c' – c'''', d' – d''''; 30,000x magnification, scale bars = 100 nm; marked by arrows). TEM images are representative of n = 3 animals per group.(B) Cristae area/total mitochondrial area ratio measured in TEM images. Data are presented as mean ± SEM. ∗p < 0.05; ∗∗p < 0.01; ∗∗∗p < 0.001; ∗∗∗∗p < 0.0001. Statistical analysis was performed using one-way ANOVA followed by Tukey’s multiple comparison test. All pairwise group comparisons were tested, and only significant differences are indicated by asterisks. n = 3 for all experimental groups (5 mitochondria each).
Oma1 modulates insulin signaling and mechanistic target of rapamycin hyperactivity of prohibitin 2-deficient podocytes
To investigate the extent to which the simultaneous loss of Oma1 in Phb2 deficient podocytes influences insulin signaling and mTOR activity, we analyzed the phosphorylation of ribosomal protein S6 (RPS6), a downstream target of insulin-dependent mTOR activation in 3-week-old mice, before and after insulin stimulation (1 IU/kg bodyweight for 60 min). Immunohistochemistry revealed that both Phb2^pko^ and Oma1^del^ mice demonstrated similarly elevated mTOR activity at baseline (Figures 4A and 4B). Following insulin stimulation, only Phb2^pko^ mice exhibited a further marked increase in the number of p-RPS6-positive glomerular cells (Figures 4A and 4B). In contrast, Phb2^pko^; Oma1^del^ mice displayed the highest baseline p-RPS6 levels, comparable to the insulin-stimulated levels observed in Phb2pko mice (Figures 4A and 4B). Following insulin stimulation, these double knockout mice did not demonstrate a significant additional increase, likely due to a saturation of the signaling pathway (ceiling effect) (Figures 4A and 4B). This suggests a synergistic effect of Phb2 deficiency and Oma1 deletion on mTOR hyperactivity (Figures 4A and 4B).Figure 4Oma1 modulates insulin signaling and mTOR hyperactivity of Phb2-deficient podocytes(A) Immunohistochemical staining of phosphorylated ribosomal protein S6 (p-RPS6) of three week old mice before (a’ – a’’’’) and after (b’ – b’’’’) insulin stimulation (1 IU/kg bodyweight for 60 min). P-RPS6 positive glomerular cells are indicated by arrows in representative images (40x magnification, scale bars = 20 μm). Stainings are representative of n = 3 animals per group.(B) Average amounts of p-RPS6 positive cells per glomerulus at baseline and after insulin stimulation (1 IU/kg bodyweight for 60 min). Data are presented as mean ± SEM. ∗p < 0.05; ∗∗p < 0.01; ∗∗∗p < 0.001; ∗∗∗∗p < 0.0001.Statistical analysis was performed using one-way ANOVA followed by Tukey’s multiple comparison test. All pairwise group comparisons were tested at baseline and after insulin treatment, and only significant differences are indicated by asterisks. n = 3 for all experimental groups; >25 glomeruli per mouse were assessed semi-automatically.
Oma1 ablation alters metabolic and kinase signaling in glomeruli
To gain deeper insights into intracellular signaling alterations resulting from disrupted mitochondrial integrity, we performed proteomic and phosphoproteomic analyses on glomerular lysates of Oma1^del^ mice. Proteomic profiling revealed an increased expression of key proteins associated with glutamine metabolism and the tricarboxylic acid (TCA) cycle (Figures 5A, 5F, and 5G). Additionally, most proteins involved in glycolysis were upregulated in Oma1^del^ glomerular cells, with lactate dehydrogenase b upregulated the most (Figures 5A and 5D). Phosphoproteomic analysis identified heightened activity of cyclin-dependent kinases 2 and 5 as well as mitogen-activated protein kinases 3, 4, and 6, suggesting enhanced cellular proliferation and growth, processes commonly associated with mTOR signaling (Figure 5E). Furthermore, we conducted Seahorse studies for the bioenergetic profiling of Phb2^kd^ podocytes and observed a reduction of spare respiratory capacity, basal respiration, and ATP production (Figure 5B).Figure 5Oma1 ablation alters metabolic and kinase signaling in glomeruli(A) Overview of expression of proteins associated with glutamine metabolism, the TCA cycle, and glycolysis measured through proteomic studies of glomerular lysates of Oma1^del^ mice (log2 fold change vs. ctrl). Data are presented as mean ± SEM. n ≥ 3 for all experimental groups.(B–C) Seahorse studies of Phb2^kd^ podocytes. Data are presented as mean ± SEM. ∗p < 0.05; ∗∗p < 0.01; ∗∗∗p < 0.001; ∗∗∗∗p < 0.0001 (Student’s t test). n = 3 (3 biological replicates with 17–33 technical replicates per group) (D) Expression of proteins associated with glycolysis in the proteome of Oma1^del^ glomerular cells (log2 fold change vs. ctrl). n ≥ 3 for all experimental groups. ∗ FDR <0.3. HK1: hexokinase 1, GPI: glucose-6-phosphate isomerase, PFKM: phosphofructokinase (muscle), PFKP: phosphofructokinase (platelet), PFKl: phosphofructokinase (liver), ALDOA: Aldolase (Fructose-Bisphosphate A), TPI1: Triosephosphate Isomerase 1, GAPDH: glyceraldehyde-3-phosphate dehydrogenase, PGK1: phosphoglycerate kinase 1, PGAM1: phosphoglycerate mutase 1, ENO1: enolase 1, PKM: pyruvate kinase M1/2, PCK2: phosphoenolpyruvate carboxykinase 2 (mitochondrial), LDHA: lactate dehydrogenase a, LDHB: lactate dehydrogenase b (E) kinase z-scores of the phosphoproteome of glomerular cells of Oma1^del^ mice. n = 4 for all experimental groups.(F) Expression of proteins associated with the TCA cycle in the proteome of Oma1^del^ glomerular cells (log2 fold change vs. ctrl). n ≥ 3 for all experimental groups. ∗ FDR <0.3. CS: citrate synthase, ACO2: aconitase 2, IDH2: mitochondrial isocitrate dehydrogenase [NADP], IDH3A: isocitrate dehydrogenase (NAD(+)) 3 catalytic subunit alpha, IDH3G: isocitrate dehydrogenase (NAD(+)) 3 non-catalytic subunit gamma, OGDH: oxoglutarate dehydrogenase, DLST: dihydrolipoamide s-succinyltransferase, DLD: dihydrolipoamide dehydrogenase, SUCLA2: succinate-CoA ligase ADP-forming subunit beta, SUCLG1: succinate-CoA ligase GDP/ADP-forming subunit alpha, SUCLG2: succinate-CoA ligase GDP/ADP-forming subunit beta, SDHA: succinate dehydrogenase complex flavoprotein subunit a, SDHB: succinate dehydrogenase complex iron sulfur subunit b, FH: fumarate hydratase, MDH2: malate dehydrogenase 2.(G) Expression of proteins associated with glutamine metabolism in the proteome of Oma1^del^ glomerular cells (log2 fold change vs. ctrl). n ≥ 3 for all experimental groups. ∗ FDR <0.3. GLS: glutaminase, GLUL: glutamine synthetase, GLUD1: glutamate dehydrogenase 1.
Oma1 ablation reduces insulin receptor and p38 MAPK phosphorylation in podocytes
For immunoblot studies, we generated podocytes with an inducible Phb2 knockdown using a lentiviral approach in heat-sensitive mouse podocytes (HSMPs) and immortalized podocytes isolated from Oma1^del^ mice (Figure S2A). Cells were treated with insulin for signaling studies or analyzed at baseline (Figure S2B). At baseline, we observed increased RPS6 phosphorylation in Oma1^del^ podocytes and a non-significant trend to increased RPS6 phosphorylation in Phb2^kd^ podocytes (Figures 6H and 6I). Following insulin treatment, we observed an increased RPS6 phosphorylation in vitro in both Oma1^del^ and Phb2^kd^ podocytes (Figures 6A and 6B). Notably, Phb2^kd^ podocytes exhibited increased Y1345 phosphorylation of the insulin receptor after insulin treatment (Figures 6A and 6C). Furthermore, we observed reduced T180/182 phosphorylation of p38 MAPK in Oma1^del^ podocytes following insulin-treatment (Figures 6A and 6D–6G), which was also measured in in vivo phosphoproteomic studies of Oma1^del^ mouse glomeruli at baseline (−0,91/−0,85 log2 FC versus ctrl; FDR 0,08/0,07). mTOR hyperactivity could be suppressed in both Phb2^kd^ and Oma1^del^ podocytes by inhibiting mTORC1 with rapamycin, insulin receptor autophosphorylation with BMS 536924 or PI3K/AKT with LY294002 (Figures 6E–6G).Figure 6Oma1 ablation reduces insulin receptor and p38 MAPK phosphorylation in podocytes(A) Immunoblot studies of Phb2^kd^ and Oma1^del^ podocytes after insulin treatment. n = 3 biological replicates per group.(B) Intensity ratio of immunoblot studies of p-RPS6 S235/236. Data are presented as mean ± SEM. ∗p < 0.05; ∗∗p < 0.01; ∗∗∗p < 0.001; ∗∗∗∗p < 0.0001 (Student’s t test versus respective ctrl). n = 3 biological replicates per group.(C) Intensity ratio of immunoblot studies of p-INSR Y1345. Data are presented as mean ± SEM. ∗p < 0.05; ∗∗p < 0.01; ∗∗∗p < 0.001; ∗∗∗∗p < 0.0001 (Student’s t test versus respective ctrl). n = 3 biological replicates per group.(D) Intensity ratio of immunoblot studies of p-p38-MAPK T180/182. Data are presented as mean ± SEM. ∗p < 0.05; ∗∗p < 0.01; ∗∗∗p < 0.001; ∗∗∗∗p < 0.0001 (Student’s t test versus respective ctrl). n = 3 biological replicates per group.(E) Immunoblot studies of Phb2^kd^ and Oma1^del^ podocytes after insulin treatment, after mTOR inhibition with Rapamycin. n = 3 biological replicates per group.(F) Immunoblot studies of Phb2^kd^ and Oma1^del^ podocytes after insulin treatment after insulin receptor inhibition with BMS536924. n = 3 biological replicates per group.(G) Immunoblot studies of Phb2^kd^ and Oma1^del^ podocytes after insulin treatment after PI3K/AKT inhibition with LY294002. n = 3 biological replicates per group.(H) Immunoblot studies of Phb2^kd^ and Oma1^del^ podocytes at baseline. n = 3 biological replicates per group.(I) Intensity ratio of immunoblot studies of p-RPS6 S235/236.Data are presented as mean ± SEM. ∗p < 0.05; ∗∗p < 0.01; ∗∗∗p < 0.001; ∗∗∗∗p < 0.0001 (Student’s t test versus respective ctrl). n = 3 biological replicates per group.
Discussion
In this study, we investigated the relationship between mitochondrial dysfunction and podocyte biology using a mitochondrial disease model with disrupted mitochondrial integrity. Specifically, we explored the role of OMA1 by genetically disrupting its function in combination with a podocyte-specific knockout of Phb2, an upstream regulator of OMA1. Our findings demonstrate that genetic Oma1 ablation rescues glomerular disease phenotypes in podocyte-specific Phb2^ko^ mice, resulting in improvements in lifespan, renal function, glomerulosclerosis, podocyte count, slit diaphragm length, slit diaphragm organization, as well as mitochondrial morphology.
Proteomic and phosphoproteomic analyses of Oma1^del^ glomeruli reveal the upregulation of key enzymes involved in glycolysis, the TCA cycle, and glutamine metabolism, alongside heightened activity of cell cycle and mitogenic kinases. Enhanced kinase activities suggest the activation of proliferative and repair pathways that may offset mitochondrial damage, while elevated lactate dehydrogenase B (LDHB) expression implies a push toward lactate metabolism, which may enhance cellular resilience against mitochondrial dysfunction. The metabolic shift of podocytes toward glycolysis has been discussed as essential in maintaining energy supply in diabetic conditions, especially in podocyte foot processes.23 These metabolic adaptations are particularly crucial for podocyte function, as these highly specialized cells must maintain their complex cytoskeletal architecture and slit diaphragm integrity while having limited regenerative capacity.2^,^24 Our data show a broad upregulation across glycolysis, the TCA cycle, and glutamine metabolism in Oma1^del^ glomeruli, suggesting an overall enhancement of metabolic capacity. Whether this metabolic profile contributes to podocyte resilience or is merely a consequence of OMA1 deletion requires further investigation. Given that PHB2 inhibits OMA1 and the double-knockout rescues the phenotype, it is plausible that the FSGS phenotype is mediated directly by OMA1 activity rather than a lack of protective metabolic reprogramming. Enhanced glutamine metabolism may support podocyte survival by providing alternative energy sources and maintaining intracellular pH homeostasis, preserving foot process structure and preventing proteinuria.25^,^26 Furthermore, we show decreased p38 MAPK activation in Oma1^del^ podocytes, a kinase that has been implicated as an important positive regulator of stress-induced mTORC1 activation in mammalian and Drosophila tissue culture studies.27 Our observed regulatory interplay between p38 MAPK and mTORC1 in Oma1^del^ podocytes aligns with recent in vivo evidence demonstrating that p38 serves as both a downstream effector and upstream amplifier of mTORC1-driven stress responses.28^,^29 The attenuation of p38 MAPK signaling may be particularly beneficial in preventing podocyte apoptosis and cytoskeletal derangement, key pathological features that drive glomerulosclerosis progression.30 Further studies, including the functional perturbation of the p38 pathway, are needed to assess whether targeting the p38-mTORC1 crosstalk could alleviate glomerular disease in states of mTOR hyperactivation independent of PHB2 deficiency.
Maintaining homeostasis between anabolic and catabolic processes is essential for proper cellular function and requires the precise regulation of metabolic pathways. The mechanistic target of rapamycin (mTOR) plays a critical role in integrating environmental cues, such as nutrient availability, into cellular metabolism. It coordinates diverse cellular processes, including cell growth, differentiation, and autophagy.31^,^32 Increased mTOR activity has been implicated in several glomerular diseases, such as membranous nephropathy, focal segmental glomerulosclerosis (FSGS), minimal change disease, and diabetic nephropathy.33^,^34^,^35^,^36^,^37 Conversely, the genetic inhibition of mTOR in podocytes has been associated with glomerular diseases, resulting in early-onset FSGS in rodent models.38^,^39 In this study, both Phb2^pko^ and Oma1^del^ mice exhibit elevated baseline mTOR activity, as measured by RPS6 phosphorylation. This finding indicates that OMA1 inhibits mTORC1 activation under basal conditions in podocytes, as loss of OMA1 alone is sufficient to increase mTOR activity. However, only Phb2^pko^ mice displayed an amplified response to insulin stimulation. In the double knockout, elevated basal mTORC1 activity might limit further induction by insulin, resulting in an overall response similar to controls. In PHB2 deficient podocytes, the Y1345 hyperphosphorylation of the insulin receptor may potentiate mTORC1 hyperactivity. While the concomitant loss of OMA1 mitigates the overall disease phenotype in vivo, whether it directly recalibrates insulin receptor signaling at the level of Y1345 phosphorylation in the context of PHB2 deficiency remains to be determined, as in vitro analysis of double-deficient cells was not performed. We acknowledge that the 10 μg/mL insulin concentration used in our in vitro experiments is supraphysiological and exceeds standard acute stimulation protocols. This represents a limitation, as it may amplify certain signaling responses. However, the dose was chosen to ensure consistent activation based on established podocyte protocols.40^,^41 Supraphysiological insulin exposure, as used in our in vitro model, can induce receptor and post-receptor desensitization, trigger insulin resistance and non-specific pathway activation (e.g., proliferation, anti-apoptosis, and Akt recruitment).42^,^43^,^44 While such dosing enables robust pathway activation and, in some cases, is a standardized approach to study podocyte biology, it is critical to interpret results within the context of these limitations. As such, extrapolation to physiological scenarios or disease mechanisms must be made cautiously. Importantly, the key genotype-dependent differences we report were robust, but nonetheless, future work should address this limitation with dose-response experiments. Notably, despite the rescue of glomerular disease, mTORC1 hyperactivity was most pronounced in Phb2^pko^; Oma1^del^ mice at baseline. While mTORC1 activation is often implicated in glomerular pathogenesis, our data strongly suggest that mTORC1 hyperactivity per se is not the primary driver of the disease in this model.45^,^46^,^47 Instead, the rescue conferred by Oma1 deletion indicates that the pathogenic effects of Phb2 loss are mediated through OMA1 activity. This supports a “two-hit” model: Phb2 deficiency induces mTOR hyperactivity, but requires OMA1-dependent mitochondrial disruption, as evidenced by the quantified loss of cristae structure, to precipitate severe podocyte injury and FSGS. By removing OMA1, the critical second hit is eliminated, allowing podocytes to tolerate elevated mTOR activity. Another contributing factor in the context of Phb2 deficiency could be an extra-mitochondrial role of Phb2 in stabilizing the slit diaphragm between adjacent podocyte foot processes, as suggested previously.48 Consistent with this view, murine studies in which the podocyte-specific ablation of Tsc1 led to “super-activation” of mTORC1 show that excessive signaling alone is sufficient to provoke FSGS, whereas more modest, physiologic levels of mTORC1 activity do not cause disease, unless an additional stressor is present.45 In that sense, loss of Phb2 might establish a sensitized background in which extra-mitochondrial slit-diaphragm instability operates as the requisite second hit, jointly with mTORC1 hyperactivity, to precipitate podocyte injury and progressive glomerulopathy. It should be noted, however, that direct evidence for a podocyte-specific “second-hit” mechanism of this kind is currently lacking, and our interpretation represents a conceptual hypothesis based on analogy with other models of kidney disease. Mitochondrial cristae disintegration observed in our Phb2^pko^ mice is a hallmark of bioenergetic failure. Studies in cardiomyocytes have shown that the genetic ablation of PHB2 precipitates a decline in ATP production and a concomitant rise in mitochondrial ROS.49 In our Seahorse studies, we could also observe a decrease in ATP production in Phb2^kd^ podocytes. More generally, the inhibition of mitochondrial fusion has been connected to diminished OXPHOS and elevated ROS generation.50 These convergent data support the notion that the structural defects we report are sufficient to compromise ATP synthesis and redox homeostasis, providing a link to the mTOR hyper-activation we observe.
These findings highlight the therapeutic potential of targeting OMA1 to modulate mTORC1 signaling in glomerular diseases characterized by mTORC1 hyperactivity. Preclinical studies have already demonstrated promise in targeting OMA1. The peptide SS31, which was associated with decreased levels of OMA1, has alleviated glomerular disease and restored OXPHOS in a mouse model of diabetic kidney disease with mitochondrial dysfunction.51 SS31-mediated mitochondrial stabilization has also shown beneficial effects in other rodent disease models, including ischemia-reperfusion, sepsis, ureteral obstruction, and post-ischemic chronic kidney disease.52 Similarly, hyperoside, a compound derived from Abelmoschus manihot flowers, alleviated adriamycin-induced podocyte injury as well as ischemia/reperfusion-induced acute kidney injury in mice by acting as an OMA1 inhibitor.53 In a mouse model of ischemic kidney injury, mitochondrial fragmentation due to OPA1 proteolysis by OMA1 has been implicated as a contributing factor to renal tubular injury and could be rescued by OMA1 ablation.54 Our data underscore the potential of OMA1 inhibition as a therapeutic strategy for glomerular diseases and warrant further investigation. Interestingly, the beneficial effects of OMA1 ablation appear to be cell-type specific. In a neuron-specific Phb2^nko^ mouse model, additional Oma1 ablation failed to restore disrupted mitochondrial morphology and prolonged lifespan for less than 10 weeks, with total mortality observed after 30 weeks.55
A critical consideration for the translational potential of these findings is the applicability of the Phb2^pko^ model. While mutations in PHB2 have not been linked to FSGS in humans, mitochondrial dysfunction is a common feature across various forms of glomerular disease.56 In this context, the Phb2^pko^ mouse serves as a valuable genetic tool to dissect the consequences of severe mitochondrial stress and OMA1 activation in podocytes. Our findings suggest that targeting OMA1 may offer a therapeutic benefit in a broader spectrum of nephropathies characterized by mitochondrial distress, irrespective of the initiating insult.
In conclusion, our findings indicate that Oma1 plays a crucial role in modulating podocyte metabolism. Additionally, our findings suggest a positive effect of Oma1 ablation on mTORC1 signaling, which may contribute to understanding why pharmacological inhibition led to the alleviation of glomerular disease in various rodent models. These results underscore the importance of comprehending the complex interplay between mitochondrial integrity and metabolic signaling in the context of renal health. Further exploration of these pathways may illuminate novel interventions to preserve podocyte function in the context of glomerular diseases linked to mitochondrial disorders.
Limitations of the study
While our study establishes the role of OMA1 in mitigating glomerular disease in PHB2-deficiency, we did not directly assess OPA1 cleavage in podocytes. As OMA1 is known to cleave multiple substrates, including DELE1, future studies will be necessary to determine the relative contributions of these pathways in podocyte biology and glomerular disease. The glomerular proteomic and phosphoproteomic data derive from bulk lysates containing endothelial and mesangial cells, potentially diluting podocyte-specific signatures. Advanced single-cell proteomics approaches could better resolve compartment-specific metabolic shifts. The complete OMA1 ablation in Phb2^pko^ mice contrasts with the partial inhibition achievable pharmacologically. This difference may limit the direct clinical translation of our findings and highlights the need for future studies employing pharmacological or inducible approaches. Notably, Oma1^del^ mice exhibit metabolic perturbations in other tissues, complicating the interpretation of systemic versus podocyte-autonomous effects.57 In this study, we chose the systemic Oma1 knockout model primarily due to its immediate availability, which enabled efficient investigation of OMA1 function in vivo. Future studies using cell type-specific knockout models and/or single-cell proteomics will be necessary to distinguish these contributions more clearly. The insulin concentration used (10 μg/mL) corresponds to standard podocyte culture protocols but is higher than doses typically applied in acute signaling studies, which may influence pathway activation. While we observed reduced p38 MAPK activity, we did not perform the functional perturbation of p38 to validate its regulatory role in mTORC1 signaling. While our ultrastructural analyses (TEM, STED) revealed marked alterations in mitochondrial morphology and podocyte architecture, the association with mTOR pathway activation was established through parallel signaling analyses. Although these findings suggest a link between disrupted mitochondrial integrity and mTOR hyperactivation, our approach does not directly demonstrate causality or the underlying bioenergetic mechanisms. While our quantitative ultrastructural analyses demonstrate profound changes in mitochondrial morphology (e.g., cristae loss) consistent with altered mitochondrial dynamics, we did not directly measure the rates of mitochondrial fusion and fission events in vivo. Therefore, our conclusions relate primarily to mitochondrial integrity and structure rather than the dynamics per se. The proteomic and phosphoproteomic analyses were performed only in Oma1del mice versus controls. To fully understand the metabolic reprogramming that underlies the rescue phenotype in Phb2pko; Oma1del mice, future studies comparing all four genotypes will be necessary.
Resource availability
Lead contact
Further information and requests for resources and reagents should be directed to and will be fulfilled by the lead contact, Paul T. Brinkkötter ([email protected])
Materials availability
This study did not generate new unique reagents.
Data and code availability
- •Proteome and Phosphoproteome data have been deposited to the ProteomeXchange Consortium via the PRIDE partner repository with the dataset identifier PXD071171.
- •Original immunoblot images have been deposited at Mendeley Data and are publicly available as of the date of publication at https://doi.org/10.17632/27432g3zhs.1.
- •This article does not report original code.
- •Any additional information required to reanalyze the data reported in this article is available from the lead contact upon request.
Acknowledgments
This work was supported by the 10.13039/501100001659Deutsche Forschungsgemeinschaft as part of the Clinical Research Unit KFO329 and Collaborative Research Center TRR422. PB was supported by research funding from the 10.13039/501100001659DFG BR-2955/8 and from the German 10.13039/501100002347Federal Ministry of Education and Research (STOP-FSGS 01GM1901E). CO was supported by Gerok funds of the 10.13039/501100001659Deutsche Forschungsgemeinschaft for a medical research rotation. DNM was supported by the Koeln Fortune Program of the Faculty of Medicine of the 10.13039/501100008001University of Cologne. DUJ was partly supported by the Swedish Kidney Foundation (Njurfonden, F2023-0068, F2022-0051). RJC was supported by the 10.13039/501100000265Medical Research Council (Senior Clinical Fellowship, MR/K010492/1, MR/W019582/1, MR/T002263/1). We thank Ruth Herzog, Vivian Ludwig, and Angelika Köser for excellent technical support and acknowledge the help of the Cologne Excellence Cluster on Cellular Stress Response in Aging-Associated Diseases proteomics and imaging facility. In addition, we would like to express our gratitude to all members of our Lab for helpful discussions and support.
Author contributions
C.O.: conducted the majority of the experiments, analyzed the data, and wrote the article; K.A.: analyzed the data (Proteomics, Phosphoproteomics); D.N.M.: conducted experiments (immunoblot); M.M: conducted experiments (immunochemistry); D.U.J.: conducted experiments (STED); M.H.: analyzed the data (Fiji Makro for p-RPS6 quantification); W.B.: analyzed the data (TEM); H.H.: analyzed the data (Histology, UACR) and funded the study; R.J.M.C.: isolated and immortalized Oma1^del^ podocytes; S.B.: analyzed the data (Histology, UACR); B.S.: analyzed the data (Histology, UACR); T.B.: designed the experiments, funded the study, and edited the article; P.A.: analyzed the data (Proteomics, Phosphoproteomics); P.T.B.: designed the experiment, funded the study, analyzed the data, and edited the article; All authors have read, reviewed, and agreed to this version of the article.
Declaration of interests
The authors declare no competing interests.
Declaration of generative AI and AI-assisted technologies in the writing process
During the preparation of this work, the author used Perplexity and ChatGPT in order to improve readability. After using this tool, the author reviewed and edited the content as needed and takes full responsibility for the content of the publication.
STAR★Methods
Key resources table
REAGENT or RESOURCESOURCEIDENTIFIERAntibodiesmouse anti-rabbit secondary antibodyJackson ImmunoresearchCat# 315-001-003 RRID: AB_2340031rabbit anti-podocinSigma AldrichCat# P0372RRID: AB_260918rabbit anti-phospho-S6 ribosomal protein S235/236Cell SignallingCat# 4858RRID: AB_916156rabbit anti-wt1Santa CruzCat# sc-192RRID: AB_632611sheep antinephrin primary antibodyR&D SystemsCat# AF4269RRID: AB_2154851donkey anti-sheep secondary antibodyThermo Fisher ScientificCat # A-21102RRID: AB_2534723rabbit anti-phb2BiolegendCat# 611802RRID: AB_2164497mouse anti-oma1Santa CruzCat# sc-515788RRID: AB_2905488mouse anti beta-tubulinSigma AldrichCat# T0198RRID: AB_477556rabbit anti-S6 ribosomal proteinCell SignallingCat# 2217RRID: AB_331355phospho Akt S473Cell SignallingCat# 4060RRID: AB_2315049rabbit anti-phospho Akt T308Cell SignallingCat# 4056RRID: AB_331163rabbit anti-AktCell SignallingCat# 9272RRID: AB_329827rabbit anti-phospho p44/42 MAPK T202/204Cell SignallingCat# 4370RRID: AB_2315112rabbit anti-p42/44 MAPKCell SignallingCat# 9102RRID: AB_330744rabbit anti-phospho p38 MAPK T180/182Cell SignallingCat# 4631RRID: AB_2139682rabbit anti-p38 MAPKCell SignallingCat# 9212RRID: AB_330713rabbit anti-phospho insulin receptor Y1345Cell SignallingCat# 3026RRID: AB_331260rabbit anti-Insulin receptor βCell SignallingCat# 3020RRID: AB_2280418rabbit anti-phospho GSK3βCell SignallingCat# 5558RRID: AB_10694055rabbit anti-GSK3βCell SignallingCat# 12456RRID: AB_2636978Bacterial and virus strainspLenti4 / TO (PHB2- hp; Mir neg shRNA)Laboratory of Paul BrinkkötterN/AChemicals, peptides, and recombinant proteinsOneTaq 2x Master MixNew England BiolabsM0482SCollagenase IIThermo Fisher Scientific17101015Pronase EThermo Fisher Scientific87785DNAse IThermo Fisher ScientificEN0521Dynabeads M-450 tosylactivatedThermo Fisher Scientific140133,3′-DiaminobenzidinSigma Aldrich#Cat D12384HematoxylinSigma Aldrich#Cat H9627HistomountNational DiagnosticsHS-103Abberior STAR 635P NHSAbberior GmbHST635-0002-1MGITSCorning354350BMS 536924Tocris4774LY 294002Sigma Aldrich440202PD 98059Tocris1213RapamycinSigma AldrichR8781RPMI 1640 MediumGibco11875093PMSFSigma Aldrich#Cat P7626PIMSigma Aldrich#Cat 526524Pierce protease and phosphatase inhibitor cocktailThermo Fisher Scientific78440Critical commercial assaysABC KitVector LaboratoriesPK-7200PAS-KitSigma Aldrich12352106Epoxy embedding medium kitSigma Aldrich12171500Mouse Albumin ELISA KitBethyl LaboratoriesE99-134Creatinine Colorimetric AssayCyman ChemicalCay500701-96BCA Protein Assay KitThermo Fisher Scientific23225SuperSignal West Femto ECLThermo Fisher Scientific10391544Oasis HLB 1cc/30mg columnsWatersWAT094225Fe-NTA Phosphopeptide Enrichment KitThermo Fisher ScientificA32992Seahorse XFp Cell Mito Stress Test KitAgilent103010-100Deposited dataOma1^del^ glomerular lysates (phospho)proteomePRIDEPXD071171Immunoblot studiesMendeley Datahttps://doi.org/10.17632/27432g3zhs.1Experimental models: Cell linesMouse: Oma1^del^ podocytesLaboratory of Richard CowardN/AMouse: Wildtype podocytesLaboratory of Richard CowardN/AMouse: HSMP Phb2^kd^Laboratory of Paul BrinkkötterN/AMouse: HSMP mir neg shRNALaboratory of Paul BrinkkötterN/AExperimental models: Organisms/strainsMouse: Oma1^del:^ Oma1^-/-^ (C57BL/6)Laboratory of Paul BrinkkötterQuiros et al.57; VenkitachalamMGI:5311225Mouse: Phb2^pko^: Phb2^fl/fl^; NPHS2.Cre (C57BL/6)Laboratory of Paul BrinkkötterMerkwirth et al.58; NelkenMoeller et al.59; ObstMGI:3774976MGI: 2654486OligonucleotidesPrimers for Genotyping of Phb2^pko^ mice fwd: ATCGTATTGGTGGCGTGCAGCArev: CGAGGTCTGGCCCGAATGTCANphs2:Cre fwd: ACCCGACGGTCTTTAGGGNphs2:Cre rev: GCAAACGGACAGAAGCATTTIDT–Primers for Genotyping of Oma1^del^ mice fwd: GAGTGCTGTTTCTCTGGGTGTrev: TGCCCTAAACTGAAGGTGTGIDT–Recombinant DNApLenti4/TO (PHB2 shRNA construct)Ising et al.16; McNameeN/ApLenti4/TO (Scrambled shRNA control)Ising et al.16; McNameeN/ASoftware and algorithmsMaxQuant Suite 1.5.0.1Max Planck Institute of BiochemistryRRID:SCR_014485Adobe PhotoshopAdobeRRID:SCR_014199Adobe IllustratorAdobeRRID:SCR_010279Prism 9GraphPadRRID:SCR_002798Fiji / ImageJNIHRRID: SCR_002285Agilent WaveAgilent TechnologiesRRID:SCR_024491
Experimental model and study participant details
Mouse models
To generate podocyte-specific Phb2 knockout mice (Phb2^pko^), previously described C57BL6/N mice in which exons 3 and 4 of the Phb2 gene are flanked by loxP sites (control) were mated with Nphs-Cre mice.58^,^59 Oma1 whole body knockout (Oma1^del^) mice were generated by deleting exon 2 of the Oma1 gene in C57BL6/N mice as previously described.57 Double knockout mice were generated by mating Phb2^pko^ with Oma1^del^ mice. DNA from mouse ear tags was extracted by incubating ear tags in 60 μL base solution at 95°C for 30 minutes before adding 100 μL neutralization solution. For genotyping 1 μL of the following 0,1 nM primers were added to 2 μL DNA, 12,5 μL OneTaq 2x Master Mix (New England Biolabs, Ipswitch, MA, USA) and PCR-grade water for a total volume of 25 μL, before performing PCR. Phb2 = ATCGTATTGGTGGCGTGCAGCA + CGAGGTCTGGCCCGAATGTCA; Oma1 = GAGTGCTGTTTCTCTGGGTGT + TGCCCTAAACTGAAGGTGTG; Nphs-Cre: ACCCGACGGTCTTTAGGG + GCAAACGGACAGAAGCATTT + beta-globin loading control). Annealing temperature for Phb2 was set at 62°C, for Oma1 57°C and Nphs-Cre 59°C. Insulin stimulation of mice was performed after 6h of fasting following i.p. injection of 1 IU / kg bodyweight of insulin 60 minutes before organ harvest. To obtain tissue samples, mice were anesthetized and intracardially perfused with PBS. Kidneys were extracted and fixated in 4% paraformaldehyde for immunohistochemistry or fixated in 4% paraformaldehyde supplemented with 2% glutaraldehyde and 0,1M sodium cacodylate for electron microscopy. Mouse glomeruli were isolated as described previously.60 Briefly, mice were euthanized and their kidneys perfused with HBSS containing magnetic beads. Kidneys were minced and placed in digestion solution containing HBSS, Collagenase II, Pronase E and DNAse I (Thermo Fisher Scientific) for 15 minutes. The solution was sieved through 100 μm cell strainers, centrifuged down and washed with HBSS, before purification using a magnetic particle concentrator. All experiments were performed using drug- and test-naive mice of both sexes, selected solely based on genotype and age as determined by PCR genotyping. Mice were housed under standardized specific pathogen-free conditions (e.g., 22°C, 12h light/dark cycle) and used at the ages indicated in the figures and legends. No additional randomization, blinding, or inclusion/exclusion criteria were applied. All eligible mice were included except in cases of unrelated illness. The influence of sex on experimental outcomes was not specifically analyzed, which may limit the generalizability of the findings. All procedures were approved by the University of Cologne Animal Care Committee and local authorities (LANUV NRW; Reference number 81-02.04.2018.A325) and conducted in accordance with national guidelines.
Cell lines
Conditionally immortalized heat-sensitive mouse podocytes (HSMP) expressing two tetracycline-inducible PHB2 shRNA constructs were generated through transduction of wildtype HSMP cells using a lentiviral approach with pLenti4/TO plasmids as published previously, while HSMP cells expressing tetracycline-inducible scrambled shRNA served as controls.16 Conditionally immortalized heat-sensitive Oma1^del^ podocytes were generated after isolating kidneys of Oma1^del^ mice as previously described, while isolated podocytes of wildtype mice served as controls.61 The sex of the mouse podocyte cell lines used in this study is not known. Cell lines were not further authenticated beyond genotype and functional characterization. All cell lines used in this study were routinely tested for mycoplasma contamination and confirmed to be negative.
Method details
Immunohistochemistry
Formalin-fixed tissue was cut into 4 μm sections, deparaffinized with xylene (VWR, Darmstadt, DE) and rehydrated with graded ethanol. Antigen was retrieved by pressure-cooking samples in 800ml 1x-Tris-EDTA-Tween pH 9 for 10 minutes. Endogenous peroxidase was blocked with 3% hydrogen peroxidase (Fischar, Saarbrücken, DEU), avidin- and biotin blocking was achieved through incubation of samples in 0,2M Sodium Carbonate and 0,2M Sodium Bicarbonate for 15 minutes. Sections were incubated overnight with primary antibodies diluted in TBS with 1% BSA, before incubation with mouse anti-rabbit secondary antibody (Jackson Immunoresearch, West Grove, PA, USA) diluted in TBS with 1% BSA for 60 minutes. Samples were labelled with an ABC Kit (Vector, Burlingame, CA, USA) and developed with DAB (Sigma-Aldrich, St. Louis, MO, USA) according to manufacturer’s instructions. Following counterstaining with hematoxylin (Sigma-Aldrich, St. Louis, MO, USA), sections were dehydrated with ethanol and mounted with Histomount (National Diagnostics, Atlanta, GA, USA). TBST was used for washing in between steps. Images were acquired using Axiovert 200M microscope or Leica SCN400 Slidescanner. The following primary antibodies were used in this study: rabbit anti-podocin (1:400; Sigma-Aldrich, #P0372), rabbit anti-phospho-S6 ribosomal protein S235/236 (1:400, Cell Signalling, #4858), rabbit anti-wt1 (1:400, Santa Cruz, #sc192). Periodic acid Schiff (PAS) stainings were performed using a PAS-Kit (Sigma-Aldrich, St Louis, MO, USA) according to manufacturer’s instructions. Analyses were performed on at least three mice per genotype.
Electron microscopy
Tissue samples were fixated in electron microscopy buffer containing 4% paraformaldehyde, 2% glutaraldehyde and 0,1M sodium cacodylate, pH 7.4 for two weeks at 4°C, fixed with 1% osmium tetroxide in 0.1M cacodylate and dehydrated in graded ethanol. Samples were embedded using the epoxy embedding medium kit according to manufacturer’s instructions (Sigma-Aldrich, St Louis, MO, USA). 30 nm sections cut using Ultracut UCT Ultramicrotome were stained with 1,5% aqueous uranylic acetate and lead citrate and examined with a Zeiss EM902 electron microscope. Images were processed with Adobe Photoshop CS4. Quantitative analysis of mitochondrial morphology was performed using Fiji/ImageJ.62 The Cristae Area / Total Mitochondrial Area ratio was determined in a blinded fashion. For each genotype, N = 3 mice were analyzed. Per mouse, five distinct mitochondria, each from a different podocyte, were evaluated.
STED imaging
Kidney sections were optically cleared and immunolabeled following a previously described protocol.63 Briefly, formalin-fixed kidney tissue was first treated with a hydrogel solution (4% acrylamide, 0.25% VA-044 initiator, PBS) at 4°C overnight, followed by a polymerization process for 3 hours at 37°C. The tissue was then sliced into 0.3-mm-thick sections using a vibratome. After overnight incubation in clearing solution at 50°C, samples were washed in PBST (0,1% Triton X) for 10 minutes. For immunolabeling, samples were incubated with the primary antibody at 37°C for 24 hours, washed in PBST, and then exposed to the secondary antibody for 24 hours at 37°C. The samples were then washed with PBST for 10 minutes at 37°C prior to mounting. Nephrin was stained using a sheep antinephrin primary antibody (1:100, R&D Systems, #AF4269) and a donkey anti-sheep secondary antibody (Thermo Fisher Scientific, #AB_2534723) conjugated with Abberior STAR 635P. Conjugation of Abberior STAR 635P to secondary antibodies was carried out in-house as follows. Abberior STAR 635P NHS ester (Abberior GmbH, ST635-0002-1MG) was dissolved at a dilution of 10 mg/ml in DMSO. The conjugation was carried out under basic conditions, by adding 1M NaHCO_3_ at a dilution of 1:10 to 1X PBS. Secondary antibodies and NHS ester was then added at a dye-to-antibody ratio of 20 (20 times molar excess of dye as compared to antibody). Following incubation over one hour at room temperature, excess fluorophores were removed using a centrifugal filter (Sigma-Aldrich, #UFC5030). Centrifugation was repeated after adding PBS with 0,1% sodium azide, which was added again after centrifugation for a final antibody concentration of 1 mg /ml. Cleared and immunolabeled sections were prepared for imaging by immersing them in 80% fructose solution with 0.5% 1-thioglycerol for 1 hour at 37°C and were then mounted on a glass-bottom dish (Mattek #P35G1.5-14-C). Imaging was performed using a Leica SP8 3X STED system. Morphometric parameters were quantified as described previously, using Fiji software with a macro allowing semi-automatic quantification of slit diaphragm length per area.64
Urinary albumin/creatinine ratio
Urinary Albumin/Creatinine Ratios were determined by ELISA (Mouse Albumin ELISA Kit, Bethyl Laboratories Inc., Montgomery, TX, USA) and Colorimetric Assay (Creatinine Colorimetric Assay Kit, Cayman Chemical, Ann Arbor, MI, USA) according to manufacturer’s instructions.
Cell culture
For maintenance, cells were incubated at 33°C. For differentiation, cells were thermoswitched to 37°C for ten days. For insulin treatment 10 μg insulin / ml medium was added for three hours, after cells were treated with FBS-free medium overnight (ITS; Corning, Corning, NY, USA).40^,^41^,^65 For inhibitor studies, the respective inhibitors were added before insulin treatment using the following target concentrations and durations: 1μM BMS 536924 (Tocris, #4774) in DMSO for 60 minutes, 20μM LY 294002 (Merck, #440202) in DMSO for 60 minutes, 10μM PD 98059 (Tocris, #1213) in DMSO for 60 minutes, 10 ng/ml Rapamycin (Sigma, #R8781) for 120 minutes. Podocytes were cultured in RPMI medium supplemented with 10% FBS, 5% 100 mM SPS and 5% 1M Hepes buffer (Gibco / Thermo Fisher Scientific, Waltham, MA, USA). For each measurement, at least three biological replicates were used.
Immunoblotting
Cells were scraped and lysed in ice cold lysis buffer (1% Triton-X-100, 50mM TrisHCl ph 7.4, 150mM NaCl, 50mM NaF, 15mM Na_4_P_2_O_7_) supplemented with NaO_3_V and protease/phosphatase inhibitors PMSF and PIM (Sigma-Aldrich, St Louis, MO, USA). Protein concentration of samples were measured using BCA Protein Assay Kit (Thermo Fisher Scientific, Waltham, MA, USA). 30μg of total protein was diluted with Laemmli and boiled at 95°C for 5 minutes. Samples were separated with SDS-PAGE, transferred to PVDF (Millipore) membranes and incubated with primary antibodies overnight at 4°C. Following incubation with HRP-conjugated secondary antibodies for 60 minutes, membranes were incubated in SuperSignal West Femto ECL (Thermo Fisher Scientific, Waltham, MA, USA) before immunoreactive bands were visualized using Fusion Solo. The following antibodies were used for this study: rabbit anti-phb2 (1:1000, Biolegend, #611802), mouse anti-oma1 (1:1000, Santa Cruz, #sc515788), mouse anti beta-tubulin (1:1000, Sigma Aldrich, #T0198, rabbit anti-phospho-S6 ribosomal protein S235/236 (1:1000, Cell Signalling, #4858), rabbit anti-S6 ribosomal protein (1:1000, Cell Signalling, #2217), rabbit anti-phospho Akt S473 (1:1000, Cell Signalling, #4060), rabbit anti-phospho Akt T308 (1:1000, Cell Signalling, #4056), rabbit anti-Akt (1:1000, Cell Signalling, #9272), rabbit anti-phospho p44/42 MAPK T202/204 (1:1000, Cell Signalling, #4370), rabbit anti-p42/44 MAPK (1:1000, Cell Signalling, #9102), rabbit anti-phospho p38 MAPK T180/182 (1:1000, Cell Signalling, #4631), rabbit anti-p38 MAPK (1:1000, Cell Signalling, #9212), rabbit anti-phospho insulin receptor Y1345 (1:1000, Cell Signalling, #3026), rabbit anti-Insulin receptor β (1:1000, Cell Signalling, #3020), rabbit anti-phospho GSK3β (1:1000, Cell Signalling, #5558), rabbit anti-GSK3β (1:1000, Cell Signalling, #12456).
nLC-MS/MS
Proteomic and phosphoproteomic studies were conducted as previously described.60^,^66 Briefly, cells were lysed in lysis buffer containing 8M urea, 50 mM ammonium bicarbonate and Pierce protease and phosphatase inhibitor cocktail (Thermo Fisher Scientific, Waltham, MA, USA). Chromatine was degraded using Athena Ultrasonic Probe Sonicator (Athena Technologies, Mumbai, IND) and cleared using centrifugation (16.000g, 45 minutes at 4°C). After determination of protein concentration with a BCA Protein Assay Kit (Thermo Fisher Scientific, Waltham, MA, USA), 800μg of total protein per sample was reduced with 5 mM DTT for 60 minutes and alkylated with 20 mM Iodoacetamide for 60 minutes before adding 50 mM ammoniumbicarbonate to the solution at a ratio of 1:4 and trypsin for over-night digestion supplemented to the solution at a ratio of 1:100. The following day 100% formic acid was added at a ratio of 1:200 to stop digestion and samples were cleared using centrifugation (16.000g, 10 minutes, room temperature). Purification was performed using Oasis HLB 1cc/30mg columns (Waters Corp., Milford, MA, USA) according to manufacturer’s instructions. Before drying samples using speedvac, 30μg of total protein was stored at -20°C for proteome measurements. Phosphopeptides were enriched using Fe-NTA Phosphopeptide Enrichment Kit with immobilized metal affinity chromatography colums according to manufacturer’s instructions (Thermo Fisher Scientific, Waltham, MA, USA), dried using speedvac and resuspended in 0,1% formic acid. Peptides were analysed as previously described using an LTQ Orbitrap Discovery mass spectrometer (Thermo Fisher Scientific, Waltham, MA, USA) coupled to a Proxeon EASY-nLC II nano-LC system (Proxeon/Thermo Fisher Scientific, Waltham, MA, USA) with a flowrate of 250nl/min over 150 minutes.60 MS1 survey scan was acquired from 300-2000 m/z at a resolution of 70000. The 10 most intense peptides were isolated within a 2 Da window and fragmented by higher-energy collisional dissociation fragmentation as previously described.67 Four biological replicates were used per experimental group.
Seahorse studies
Cellular oxygen consumption rate (OCR) were quantified using a Seahorse XFp Analyzer (Agilent Technologies, Santa Clara, CA, USA). Mitochondrial oxidative phosphorylation (OXPHOS) was assessed using the Seahorse Mito Stress Test Kit, according to the manufacturer’s instructions. Briefly, 40,000 cells per well were seeded in XFp 96-well cell culture plates and allowed to differentiate for ten days. On the day of analysis, culture medium was replaced with Seahorse DMEM (Agilent, #103575) and supplemented with 10 mM glucose, 2 mM glutamate and 1 mM sodium pyruvate. Cells were incubated at 37°C for 45 minutes prior to the assay. During analysis 1 μM oligomycin, 2 μM FCCP, and 1 μM rotenone/antimycin A were sequentially injected into each well. All measurements were normalized to total protein content, determined by BCA Protein Assay (Thermo Fisher Scientific, Waltham, MA, USA). Data analysis and visualization were performed using Agilent Wave software. For statistical analysis, technical replicates (17-33 wells per condition) were averaged for each independent biological experiment (n = 3).
Quantification and statistical analysis
All statistical details of experiments, including the statistical tests used, the exact value of n, what n represents (e.g., number of animals or independent biological replicates) and dispersion measures (mean ± SEM) are reported in the respective figure legends.
Bioinformatic analysis (nLC-MS/MS)
Raw files were analysed using MaxQuant Suite 1.5.0.1 algorithms with LFQ and match between runs enabled and searched against mouse uniprot reference database. Mass accuracy was 20ppm with deisotoping option enabled while mass tolerance was 0,5 Da. Fixed modifications were carbamidomethylation of cystines, variable modifications were phosphorylation on S, T, Y and oxidation of methionine with a maximum of four modificatons allowed. Protein, peptide and site false discovery rate was set to be 0.1 by default. LFQ and phosphorylation site intensities were logarithmized, potential contaminants removed and normalized by substraction of the mean. Using Perseus 1.5, GO Terms were annotated and categorical 1D enrichment analysis by a Fisher’s exact test was performed.
Visualization and statistical analysis
Adobe Photoshop, Adobe Illustrator and GraphPad Prism 9 were used for visualization. Results are expressed as means ± SEM. Statistical analyses were performed using GraphPad Prism 9. For experiments involving multiple groups, ordinary one-way ANOVA was performed followed by Tukey’s multiple comparison test, assessing all pairwise comparisons between groups. Only statistically significant differences are indicated in the figures by asterisks and non-significant comparisons are not labelled in the graphs for clarity. For comparisons involving two groups, statistical significance was assessed using an unpaired two-tailed Student’s t-test. Significance levels are defined as follows: ∗P < 0.05; ∗∗P < 0.01; ∗∗∗P < 0.001; ∗∗∗∗P < 0.0001; for (phospho)proteome studies ∗ FDR < 0.3. No randomization or blinding was performed for in vitro experiments.
The reference list from the paper itself. Each links out to its DOI / PubMed record.
- 1Fogo A.B.Harris R.C.Crosstalk between glomeruli and tubules Nat. Rev. Nephrol.21202518919910.1038/s 41581-024-00907-039643696 · doi ↗ · pubmed ↗
- 2Brinkkoetter P.T.Bork T.Salou S.Liang W.Mizi A.Özel C.Koehler S.Hagmann H.H.Ising C.Kuczkowski A.Anaerobic Glycolysis Maintains the Glomerular Filtration Barrier Independent of Mitochondrial Metabolism and Dynamics Cell Rep.27201915511566.e 510.1016/j.celrep.2019.04.01231042480 PMC 6506687 · doi ↗ · pubmed ↗
- 3Brinkkoetter P.T.Ising C.Benzing T.The role of the podocyte in albumin filtration Nat. Rev. Nephrol.9201332833610.1038/nrneph.2013.7823609563 · doi ↗ · pubmed ↗
- 4Rosenberg A.Z.Kopp J.B.Focal Segmental Glomerulosclerosis Clin. J. Am. Soc. Nephrol.12201750251710.2215/CJN.0596061628242845 PMC 5338705 · doi ↗ · pubmed ↗
- 5Reiser J.Altintas M.M.Podocytes F 1000 Res.5201610.12688/f 1000 research.7255.1F 1000 Faculty Rev-114PMC 475540126918173 · doi ↗ · pubmed ↗
- 6Ernster L.Schatz G.Mitochondria: a historical review J. Cell Biol.911981227 s 255s 10.1083/jcb.91.3.227s 7033239 PMC 2112799 · doi ↗ · pubmed ↗
- 7Butow R.A.Avadhani N.G.Mitochondrial signaling: the retrograde response Mol. Cell 14200411510.1016/s 1097-2765(04)00179-015068799 · doi ↗ · pubmed ↗
- 8Hamanaka R.B.Chandel N.S.Mitochondrial reactive oxygen species regulate cellular signaling and dictate biological outcomes Trends Biochem. Sci.35201050551310.1016/j.tibs.2010.04.00220430626 PMC 2933303 · doi ↗ · pubmed ↗