Financial Toxicity of Hematologic Malignancy Therapies, Including Cellular Therapy and Its Impact on Access to Care: Prospective Pilot Study
Lemchukwu Amaeshi, Lauren Laufer, Kateryna Fedorov, Alex Sisto, David Levitz, Rosmi Mathew, Karen Wright, Dennis Cooper, Mendel Goldfinger, Ioannis Mantzaris, R Alejandro Sica, Kira Gritsman, Marina Konopleva, Ridhi Gupta, Noah Kornblum, Chenxin Zhang, Mimi Kim, Amit Verma

TL;DR
This study explores how expensive cancer treatments, especially for blood cancers, create financial stress for patients, particularly among African American and Hispanic communities.
Contribution
The study is the first to specifically examine financial toxicity in hematologic malignancy patients in a socioeconomically underserved U.S. population.
Findings
75% of participants experienced financial toxicity, with worsening financial burden over time in cellular therapy patients.
African American and Hispanic patients reported higher financial toxicity compared to non-Hispanic White patients.
Over half of participants struggled to afford basic necessities and faced transportation challenges.
Abstract
Patients with cancer often face significant financial challenges, known as financial toxicity (FT), which is associated with reduced quality of life. Patients with hematologic malignancies (HMs) are especially vulnerable due to intensive and prolonged treatments, frequent hospital visits, and a high risk of complications. While FT affects many in the general population, it is particularly severe among racial and ethnic minorities, especially those below the poverty line. To our knowledge, no studies have specifically examined FT in this vulnerable group in the United States. This study aimed to evaluate the severity of FT in patients receiving treatment for HMs in a socioeconomically underserved population, explore sociodemographic factors that may predict the severity of FT, and evaluate the subjective experiences of these patients as they relate to FT. We conducted a prospective,…
Genes, proteins, chemicals, diseases, species, mutations and cell lines named across the full text — each resolved to its canonical identifier and authoritative record.
Click any figure to enlarge with its caption.
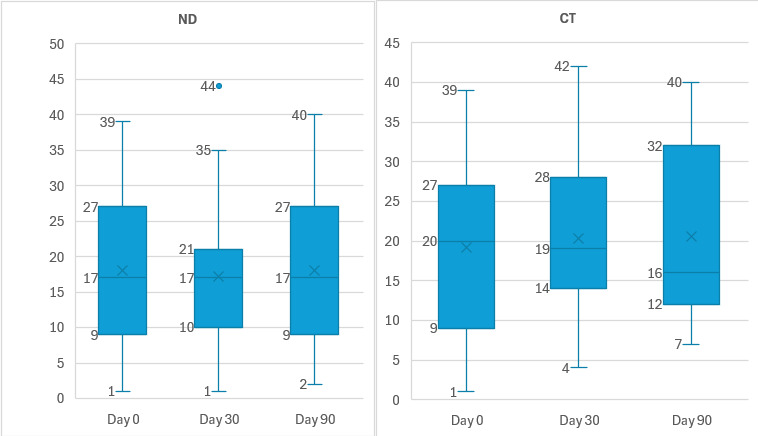 Figure 1
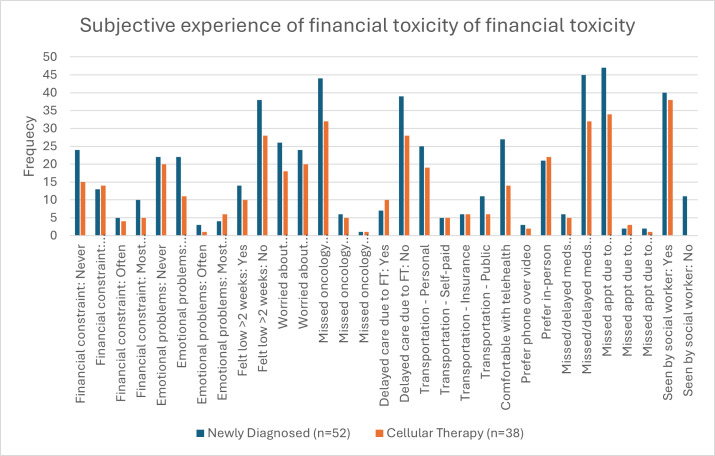 Figure 2
| Sociodemographic characteristics | Newly diagnosed group | Cellular therapy group | Total |
|---|---|---|---|
| Age, median (IQR) | 59 (42.5‐66.0) | 58 (50.0‐67.0) | 59 (43.5‐66.0) |
| Sex, n (%) | |||
| Male | 31 (60) | 25 (66) | 56 (62) |
| Female | 21 (40) | 13 (34) | 34 (38) |
| Race, n (%) | |||
| African American | 15 (29) | 8 (22) | 24 (27) |
| Non-Hispanic White | 6 (11) | 8 (22) | 14 (16) |
| Others | 31 (60) | 22 (56) | 51 (57) |
| Ethnicity, n (%) | |||
| Hispanic | 28 (54) | 20 (57) | 48 (55) |
| Non-Hispanic | 24 (46) | 15 (43) | 40 (45) |
| Employment status, n (%) | |||
| Employed | 21 (41) | 11 (31) | 32 (37) |
| Retired | 13 (25) | 9 (25) | 22 (25) |
| On disability | 9 (18) | 8 (22) | 17 (20) |
| Unemployed | 8 (16) | 8 (22) | 16 (18) |
| Health insurance, n (%) | |||
| Private | 22 (43) | 16 (42) | 38 (43) |
| Medicare | 10 (20) | 8 (21) | 18 (20) |
| Medicaid | 19 (37) | 14 (37) | 33 (37) |
| Type of hematologic malignancy, n (%) | |||
| Leukemias | 21 (41) | 10 (27) | 31 (34) |
| Lymphomas | 16 (31) | 9 (24) | 26 (29) |
| Plasma cell dyscrasias | 14 (28) | 18 (49) | 33 (37) |
| Financial toxicity | Day 0 | Day 30 | Day 90 | |
|---|---|---|---|---|
| Newly diagnosed group | ||||
| Number of patients, n | 50 | 39 | 32 | |
| Median FT | 16.5 (8.9-27.5) | 17.0 (9.5-21.0) | 17.5 (9.0-27.0) | .85 |
| Grade category n (%) | ||||
| No toxicity | 11 (22) | 7 (18) | 9 (28) | |
| Mild toxicity | 17 (34) | 18 (46) | 10 (31) | |
| Moderate toxicity | 21 (42) | 14 (36) | 13 (41) | |
| Severe toxicity | 1 (2) | 0 (0) | 0 (0) | |
| Cellular therapy group | ||||
| Number of patients, n | 36 | 29 | 16 | |
| Median FT (IQR) | 19.9 (9.0-27.0) | 19.0 (13.8-28.0) | 15.5 (12.3-32.3) | .02 |
| Grade category n (%) | ||||
| No toxicity | 10 (28) | 8 (28) | 5 (31) | |
| Mild toxicity | 11 (31) | 14 (48) | 4 (25) | |
| Moderate toxicity | 15 (42) | 7 (24) | 5 (31) | |
| Severe toxicity | 0 (0) | 0 (0) | 0 (0) | |
| Total population | ||||
| Number of patients, n | 88 | 69 | 48 | |
| Median FT (IQR) | 19.4 (8.9-27.0) | 18 (10.0-25.0) | 17 (10.0-17.5) | .31 |
| Grade category n (%) | ||||
| No toxicity | 21 (24) | 15 (22) | 14 (30) | |
| Mild toxicity | 29 (33) | 33 (48) | 14 (30) | |
| Moderate toxicity | 36 (41) | 21 (30) | 18 (39) | |
| Severe toxicity | 2 (2) | 0 (0) | 0 (0) | |
| Days | ND | CT | |
|---|---|---|---|
| Day 0 | |||
| Number of patients, n | 50 | 37 | |
| Median FT | 16.5 (8.9-27.5) | 19.9 (9.0-27.0) | .88 |
| Day 30 | |||
| Number of patients | 36 | 32 | |
| Median FT (IQR) | 17.0 (9.5-21.0) | 19.0 (13.8-28.0) | .54 |
| Day 90 | |||
| Number of patients | 31 | 15 | |
| Median FT (IQR) | 17.5 (9.0-27.0) | 15.5 (12.3-32.3) | .75 |
| Financial toxicity, median (IQR) | |||
|---|---|---|---|
| Sociodemographics | Day 0 | Day 30 | Day 90 |
| Total cohort | |||
| Race | |||
| African American | 16.5 (8.8-25.2) | 18.0 (10.0-25.8) | 13.5 (6.0-26.0) |
| White | 27.0 (22.0-36.0) | 20.6 (17.0-30.8) | 37.0 (19.0-41.0) |
| Other | 14.0 (8.9-24.1) | 16.8 (10.5-21.2) | 15.0 (10.0-27.5) |
| | .08 | .38 | .06 |
| Ethnicity | |||
| Hispanic | 13.5 (8.9-24.8) | 15.5 (8.9-21.2) | 14.5 (9.8-28.0) |
| Non-Hispanic | 20.0 (8.5-27.5) | 18.0 (14.0-26.5) | 19.0 (7.8-31.5) |
| | .45 | .17 | .49 |
| Diagnosis | |||
| Leukemia | 19.4 (10.3-24.5) | 18.0 (17.0-22.0) | 17.0 (8.8-25.8) |
| Lymphoma | 10.0 (8.0-28.0) | 14.4 (8.4-17.6) | 15.0 (4.5-27.8) |
| Plasma cell dyscrasias | 20.0 (8.8-28.0) | 19.5 (9.8-28.2) | 18.0 (10.0-30.0) |
| | .75 | .11 | .77 |
| Employment status | |||
| Employed | 12.0 (8.0-24.0) | 19.0 (17.0-22.0) | 17.0 (8.0-23.0) |
| Unemployed | 15.0 (10.0-28.0) | 18.0 (10.0-28.0) | 15.0 (9.0-28.0) |
| | .13 | .67 | .94 |
| Newly diagnosed cohort | |||
| Race | |||
| African American | 15.4 (8.2-20.4) | 18.0 (9.0-22.5) | 13.5 (6.0-22.0) |
| White | 33.5 (26.7-36.0) | 19.8 (18.4-31.9) | 22.0 (16.0-40.0) |
| Other | 14.0 (8.8-24.2) | 16.5 (9.0-20.0) | 19.0 (10.0-28.0) |
| | .04 | .46 | .16 |
| Ethnicity | |||
| Hispanic | 14.0 (9.0-28.0) | 15.0 (9.0-20.0) | 21.5 (10.0-28.0) |
| Non-Hispanic | 16.5 (7.9-25.5) | 18.0 (15.5-23.8) | 18.0 (9.0-24.0) |
| | >.99 | .29 | .38 |
| Diagnosis | |||
| Leukemia | 17.0 (8.0-23.0) | 18.0 (15.8-20.0) | 19.5 (8.5-27.3) |
| Lymphoma | 9.8 (9.0-27.5) | 12.0 (8.9-17.3) | 11.0 (4.0-27.0) |
| Plasma cell dyscrasias | 22.0 (9.1-28.0) | 19.4 (8.0-28.8) | 19.0 (10.0-28.0) |
| | .92 | .29 | .48 |
| Employment status | |||
| Employed | 11.0 (7.25-26.0) | 18.0 (13.3-20.5) | 18.0 (9.0-22.3) |
| Unemployed | 15.0 (9.0-15.0) | 12.0 (8.0-28.0) | 12.0 (6.0-28.0) |
| | .41 | .95 | .71 |
| Cellular therapy cohort | |||
| Race | |||
| African American | 19.5 (8.8-28.3) | 24.0 (14.5-29.2) | 33.0 (7.0-44.0) |
| White | 22.0 (13.8-29.5) | 22.8 (10.9-29.4) | 39.5 (37.0-42) |
| Other | 19.9 (10.0-24.0) | 18.0 (13.9-1.5) | 13.0 (8.75-16.25) |
| | .77 | .55 | <.001 |
| Ethnicity | |||
| Hispanic | 16.0 (8.9-22.5) | 16.0 (11.3-21.5) | 13.0 (8.75-16.3) |
| Non-Hispanic | 24.5 (9.5-31.0) | 22.5 (14.5-30.9) | 37.0 (20.0-43.0) |
| | .29 | .24 | .05 |
| Diagnosis | |||
| Leukemia | 20.0 (13.0-25.0) | 22.0 (19.5-29.5) | 13.5 (8.75-25.5) |
| Lymphoma | 13.0 (8.0-28.0) | 15.0 (10.7-17.0) | N/A |
| Plasma cell dyscrasias | 19.9 (8.7-27.8) | 20.0 (13.5-26.8) | 14.0 (8.25-32.25) |
| | .94 | .21 | .95 |
| Employment status | |||
| Employed | 20.0 (5.0-20.0) | 22.0 (12.0-29.5) | 12.0 (7.5-31.5) |
| Unemployed | 16.5 (10.3-34.0) | 20.5 (15.0-29.0) | 15.5 (13.3-32.8) |
| | .25 | .45 | .66 |
| Predictor | B (95% CI) | SE | β |
| |
|---|---|---|---|---|---|
| Sex | 3.521 (−1.136 to 8.177) | 2.337 | .169 | 1.507 | .14 |
| Race/ethnicity | −3.084 (−6.047 to −0.121) | 1.487 | −.232 | −2.074 | .04 |
| Health insurance | 0.357 (−2.697 to 3.411) | 1.533 | .027 | 0.233 | .82 |
| Type of malignancy | 0.185 (−2.711 to 3.080) | 1.453 | .014 | 0.127 | .90 |
| Employment | 3.724 (−2.711 to 3.080) | 2.511 | .173 | 0.127 | .90 |
| Intercept | 14.317 (−1.272 to 29.906) | 7.824 | — | 1.830 | .07 |
| Day 0 | ||
|---|---|---|
| Economic data | Newly diagnosed (n=52) | Cellular therapy (n=38) |
| Have you felt financially constrained, such as paying for food, heating/cooling in the last 6 months? n (%) | ||
| Never | 24 (46) | 15 (39) |
| Sometimes | 13 (25) | 14 (37) |
| Often | 5 (10) | 4 (11) |
| Most of the time | 10 (19) | 5 (13) |
| During the past 4 wk, have you had any problems with your work or daily life due to any emotional problems, such as feeling depressed, sad, or anxious? n (%) | ||
| Never | 22 (43) | 20 (52) |
| Sometimes | 22 (43) | 11 (29) |
| Often | 3 (6) | 1 (3) |
| Most of the time | 4 (8) | 6 (16) |
| Over the last 6 months, have you felt particularly low for more than 2 wk? n (%) | ||
| Yes | 14 (27) | 10 (26) |
| No | 38 (73) | 28 (74) |
| Are you worried about access and cost of transportation for medical appointments? n (%) | ||
| Yes | 26 (52) | 18 (47) |
| No | 24 (48) | 20 (53) |
| Have you missed an oncology appointment due to lack of transportation? n (%) | ||
| Never | 44 (86) | 32 (84) |
| Sometimes | 6 (12) | 5 (13) |
| Often | 1 (2) | 1 (3) |
| Have you delayed seeking medical care due to financial toxicities? n (%) | ||
| Yes | 7 (15) | 10 (26) |
| No | 39 (85) | 28 (74) |
| Which mode of transportation do you use to come to medical appointments? n (%) | ||
| Personal | 25 (53) | 19 (53) |
| Self-paid transportation | 5 (11) | 5 (14) |
| Insurance transportation | 6 (13) | 6 (17) |
| Public transportation | 11 (23) | 6 (17) |
| Distance from treatment clinic (miles) | ||
| Median (range) | 5.8 (0‐131) | 5.8 (0‐217.1) |
| How do you feel about telephone or video visits in addition to in-person visits? n (%) | ||
| I feel comfortable with phone/video visits | 27 (53) | 14 (40) |
| I prefer phone visits to video visits due to technological challenges | 3 (6) | 2 (3) |
| I always prefer in-person visits | 21 (41) | 22 (57) |
| Have you missed doses or delayed treatments due to not being able to pay for medications? n (%) | ||
| Yes | 6 (12) | 5 (14) |
| No | 45 (88) | 32 (86) |
| Have you missed an oncology appointment due to caregiver issues? n (%) | ||
| Never | 47 (92) | 34 (89) |
| Sometimes | 2 (4) | 3 (8) |
| Often | 2 (4) | 1 (3) |
| Evaluated by a social worker, n (%) | ||
| Yes | 40 (78) | 38 (100) |
| No | 11 (22) | 0 (0) |
Peer Reviews
No public reviews on file for this paper yet. If you reviewed it on a platform where reviews are public (OpenReview, ICLR, NeurIPS, ICML), you can paste yours below so the community can read it here.
Videos
No videos yet. Explain this paper in a talk, walkthrough, or lecture? Add one.
Taxonomy
TopicsEconomic and Financial Impacts of Cancer · Health Systems, Economic Evaluations, Quality of Life · CAR-T cell therapy research
Introduction
Cancer continues to be a significant public health concern in the United States. According to the American Cancer Society, in 2022, there were nearly 2 million new cancer cases and over 600,000 cancer-related deaths in the United States [1]. Receiving a new cancer diagnosis brings untold physical, emotional, and psychological distress to the patient and their caregivers. Although survival rates of patients with cancer have improved over the years due to advances in diagnosis and treatment, the rising cost of cancer care has become a significant challenge for patients and their providers in the US health care system. Financial toxicity (FT) has emerged in oncologic care to describe the psychological, material, and behavioral hardships arising from the economic burden of cancer [2].
Indeed, several studies have reported a close association between FT and reduced quality of life, delays in seeking medical care, nonadherence with treatment, emotional and psychological distress, and reduced overall survival in patients with cancer [3-5]. The impact of FT is particularly pronounced in patients with hematologic malignancies (HMs) as they must deal with the high cost of therapy, especially with the shift from conventional chemotherapy to immunotherapy, multiple infusion visits, prolonged hospitalizations due to life-threatening presentations, long duration of intensive treatment, and treatment-related complications [67]. In 2014, the average cumulative costs of hematologic cancer care in the United States ranged from approximately US 800,000 for acute leukemias within the first 3 years of treatment. In comparison, the cost for lung cancer was around US 150,000 [8].
The severity of FT is also determined by the patient’s sociodemographic and socioeconomic factors. Extremes of age, Black race, lower income level, limited ability to provide basic household needs, unemployment, and insurance status are associated with worse FT [29-11undefinedundefined]. The factors associated with worse FT are predominant in households living below the federal poverty line. This population primarily comprises Native American, Black, and Hispanic individuals [11].
Despite growing attention to FT, most studies were conducted predominantly on the White population, who are often insured. To the best of our knowledge, no similar studies in the United States have specifically targeted racial and ethnic minorities with HM in underserved areas in the United States. This study aims to assess the severity of FT, examine relevant sociodemographic factors influencing FT, and explore the subjective experience of FT among patients with HMs.
This study was conducted in a large academic hospital in the Bronx, where more than 25% of the population lives below the federal poverty line [12].
Methods
Study Design and Setting
This prospective observational study was conducted over 12 months, from October 1, 2022, to October 30, 2023, at Montefiore Medical Center in Bronx, New York. The study took place in both outpatient and inpatient hematologic oncologic units of the Montefiore Cancer Center, a quaternary academic center serving a predominantly low-income, racially and ethnically diverse population.
Participant Eligibility and Recruitment
Eligible participants included adults over 18 years old with a HM (ie, acute or chronic leukemia, Hodgkin lymphoma, non-Hodgkin lymphoma, or multiple myeloma) who either received a new diagnosis or were being evaluated for cellular therapy (CT), such as autologous or allogeneic stem cell transplantation (SCT) or chimeric antigen receptor T-cell (CAR-T) therapy.
Patients were excluded if (1) they were being seen for conditions other than HMs, (2) they were seeking a second opinion after treatment at a different institution, (3) they presented after recurrence ineligible for autologous or allogeneic SCT and CAR-T therapy, (4) they were being evaluated for a second autologous SCT as part of tandem autologous transplantation or for recurrent myeloma, or (5) they lacked capacity or were non-English or non-Spanish speakers.
Recruitment took place during routine clinical visits and on the oncology floors. Eligible patients were identified by treating providers or study personnel and were invited to participate on a rolling basis. Participants were divided into two cohorts: (1) newly diagnosed (ND) and (2) undergoing CT (SCT or CAR-T).
Data Collection and Measurements
Data were collected in person at three time points: baseline (day 0), day 30, and day 90. At each time point, the participants completed two instruments:
Sociodemographic and Subjective Impact Questionnaire: The research team developed an investigator-designed, bilingual (English and Spanish) questionnaire to gather information on demographics (age, sex, race and ethnicity, income, education, employment, and insurance), cancer type, and subjective experience of financial burden, including effects on basic needs and access to care.Comprehensive Score for Financial Toxicity–Functional Assessment of Chronic Illness Therapy: FT was assessed using the validated Comprehensive Score for Financial Toxicity–Functional Assessment of Chronic Illness Therapy (COST-FACIT) tool [13]. It is categorized into grades 0 to 4, based on the level of FT severity, with scores ranging from 0 to 44. A score of 0 represents grade 0 or severe toxicity; 1‐13, grade 2 or moderate toxicity; 14‐25, grade 3 or mild toxicity; and >25, grade 4 or no toxicity. Hence, higher scores indicated less severe FT. The patients were assessed at three different time points: day 0, the initial visit time, day 30, and day 90.
Statistical Analysis
Data analysis was performed using SPSS version 29 (IBM Corp). Descriptive statistics summarized demographic characteristics and COST-FACIT scores. Frequencies and percentages were calculated for categorical variables, while medians and IQRs were used for continuous variables. Comparison of the severity of FT across the timelines was determined using the Friedman test. The Mann-Whitney U test and Kruskal-Wallis H test were used to examine significant differences in FT with respect to sociodemographic groups. Linear regression analysis identified sociodemographic predictors of FT. A two-tailed P value of <.05 was considered statistically significant. No adjustment for multiple comparisons was made due to the exploratory nature of the study.
Ethical Considerations
Study Approval
This study was conducted in accordance with ethical standards and received approval from the IRB at Albert Einstein College of Medicine and Montefiore Medical Center (approval number: IRB 2022‐13798, approval date: 09/13/2022). The research involved human participants and adhered to the principles outlined in the Declaration of Helsinki.
Informed Consent
The provider (MD or nursing practitioner) or study personnel obtained informed consent during the initial visit at the HM clinic or for auto/allo SCT and CAR-T evaluation. All participants gave written informed consent before enrollment. The consent process included explaining the study’s objectives, procedures, risks, and benefits and the fact that participation is voluntary. For patients unable to give written consent, verbal consent was obtained in the presence of a trained research coordinator, per institutional policy.
Privacy and Confidentiality
All collected data were deidentified prior to analysis to protect participant confidentiality. Study data were stored in secure, password-protected databases accessible only to authorized personnel. No identifiable personal health information was used in any publication or presentation.
Compensation
Participants were not financially compensated for their involvement in this study.
Results
Sociodemographic Characteristics
Over a period of 12 months, we recruited 90 patients who met eligibility criteria and consented to the study. The sociodemographic characteristics of these participants are shown in Table 1. Fifty-two of 90 (57%) patients were ND, whereas the rest (n=38, 43%) were either currently receiving or preparing to receive CT. The median age was 59 (IQR 44-66) years. There were more male patients (n=56, 62%), 24 (27%) patients were African American, and more than half (n=48, 55%) were Hispanic. Over 60% (n=55, 63%) of the participants were not employed, and over a third (n=33, 37.1%) were on Medicaid. Regarding HMs, most patients had plasma cell dyscrasias (n=33, 37%) compared to other HMs.
Severity of Financial Toxicity Across Time
Overview
Table 2 and Figure 1 depict the median FT scores at various periods. Over 75% (n=67) of patients experienced some degree of FT, with a median COST score of 19.4 at baseline (day 0). While the median COST score indicates mild FT, many patients experienced moderate FT at the individual level. The CT group demonstrated significant changes in FT scores over time (day 0: 19.9; day 30: 19.0; day 90: 15.5; P=.02). When comparing FT severity between the ND and CT groups, as shown in Table 3, no statistically significant differences were observed at any period (day 0: P=.88; day 30: P=.54; day 90: P=.75).
Box-plot graph comparing COST-FACIT scores across the timelines for both groups. COST-FACIT: Comprehensive Score for Financial Toxicity–Functional Assessment of Chronic Illness Therapy; CT: cellular therapy; FT: financial toxicity; FT 0: FT score day 0; FT 30: FT score day 30; FT 90: FT score day 90; ND: newly diagnosed.
Financial Toxicity and Sociodemographic Factors
Table 4 summarizes the difference in FT by race and ethnicity, diagnosis, and employment status at day 0, day 30, and day 90. We examined the association between FT and sociodemographic factors such as race, ethnicity, type of HM, and employment status (employment status was recategorized as employed vs unemployed for ease of analysis). Differences in FT across racial groups were marginally significant, with White patients experiencing relatively milder FT at day 0 (median FT: 27.0 for White patients, 16.5 for African American patients, and 14.0 for other racial groups; P=.08) and at day 90 (median FT: 37.0 for White patients, 13.5 for African American patients, and 15.0 for other racial groups; P=.06).
Within the ND cohort, White patients had significantly less severe FT than other racial groups at day 0 (median FT: 33.5 for White patients, 15.4 for African American patients, and 14.0 for other racial groups; P=.04). However, the significance was not maintained at day 30 or day 90.
A similar trend was observed in the CT group at day 90 (median FT: 39.5 for White patients, 33.0 for African American patients, and 13.0 for other racial groups; P<.001).
Predictors of Financial Toxicity
A linear regression analysis was performed (Table 5) to identify potential predictors of FT, as measured by the continuous COST-FACIT score. The model incorporated sex, race and ethnicity, insurance status, employment, and type of malignancy as independent variables. Among individual predictors, race and ethnicity were the only statistically significant predictors, which were associated with a 3.08-point lower COST-FACIT score, indicating higher FT in this group (B=−3.08, P=.04, 95% CI −6.047 to −0.121). The other variables—sex, insurance status, employment, and malignancy type—were not significantly correlated with FT.
Subjective Experience of Financial Toxicity
Our social workers evaluated more than 75% of the patients in our survey at the time of diagnosis. Over a third (n=32, 37%) of our patients were employed, while more than 60% were retired, disabled, or unemployed (Table 1). Table 6 and Figure 2 show the results of our investigator-based questionnaire. Most patients reported financial difficulties in carrying out their daily activities, such as paying for food, heating/air-conditioning, or warm clothes over the past 6 months (ND group: n=28, 54%; CT group: n=23, 61%). Additionally, over half of the patients experienced some degree of emotional distress in their daily lives (ND group: n=29, 57%; CT group: n=18, 48%). About 15% in the ND group and 26% in the CT group delayed seeking medical care due to financial constraints, and only about 10% missed appointments due to caregiver issues.
Box-plot graph showing frequencies of parameters assessing subjective experience from financial toxicity by treatment group. CT: cellular therapy; ND: newly diagnosed.
Regarding transportation, the median distance from patients’ homes to the treatment center was 5.8 km in both groups. Although fewer than 20% missed appointments due to lack of transportation, many expressed concerns about the cost and accessibility of transportation to their medical appointments (ND group: 52% on day 0; CT group: 47% on day 0). Interestingly, many patients showed interest in telemedicine alongside in-person visits (ND group: 53% and CT group: 40% at day 0). We examined differences in social factors and subjective experiences of FT by ethnicity, and no statistical difference was found at day 0 in either cohort.
Discussion
Principal Findings
Our pilot study highlights a high prevalence of FT within the study population, affecting over 70% of participants. While no significant differences in FT were observed between patients ND and those undergoing CT, those in the CT group had significantly worse FT at day 90 compared to baseline (day 0). Race and ethnicity emerged as significant predictors of FT, with African American and Hispanic patients experiencing greater FT compared to non-Hispanic White counterparts. Although most patients could attend their oncology appointments and receive treatment, over one-third expressed concerns regarding access to transportation and associated costs.
Comparison to Prior Work
Our findings are consistent with a growing body of literature that identifies FT as a persistent and complex challenge in cancer care [14]. Our patients in the CT group experienced worse FT over time, similar to a previously published study on CAR-T therapy [15]. The study by Maziarz et al [16] on health care costs in patients receiving allogeneic transplants reported that the median cost of health care for a patient receiving a transplant was over US $300,000. Apart from the high cost of SCT and CAR-T, prolonged hospital stays and multiple hospitalizations from treatment-related toxicities add to the burden of FT in these patients [1718].
In addition to direct medical costs, indirect expenses—such as transportation, loss of employment from poor productivity due to illness, or switching to low-income jobs because they are less physically demanding—also add to the burden of FT [1920]. Our study confirms these findings. In our study, although most patients made their oncology appointments, over a third were worried about access and the cost of transportation to attend them. Patients undergoing scheduled chemotherapy infusions need to make multiple visits to the clinic, which can be burdensome, especially for those in the CT group who must travel long distances to a FACT (Foundation for Accreditation of Cellular Therapy)-accredited center. This increases gas and public transportation costs, ultimately increasing the overall treatment cost burden [2122]. Insurance coverage, while protective, may be insufficient to offset the rising costs. Increased deductibles, co-payments, and coinsurance have shifted much of the burden to patients, leading to substantial out-of-pocket expenses for their cancer care. Our study did not assess these out-of-pocket costs directly, nor did it quantify medical debt, areas that merit further investigation.
We found that race and ethnicity are significant predictors of FT, with African American and Hispanic patients experiencing worse FT than non-Hispanic White patients. Our results do not differ from studies on race and cancer-related FT in the literature [23-25]. Most of our patients are essentially racial and ethnic minorities and immigrants, and some are undocumented. They are likely to have lower incomes compared to their White counterparts, to be in the lowest socioeconomic tier, and have access only to public health insurance with limited coverage or even be uninsured [26-28]. Additionally, these patients are likely to have lower health literacy, leading to late disease presentation, increasing the intensity and cost of treatment. These findings underscore the structural inequities that contribute to FT among racial and ethnic minorities and immigrant populations. The convergence of social, economic, and health care–related factors amplifies financial strain and perpetuates disparities in outcomes. Addressing FT in these populations will require more than individual-level solutions; it demands systems-level change.
Beyond the direct effects of FT, it also encompasses the subjective financial distress—the emotional and psychological toll of economic strain [229]. This includes the depletion of household wealth and nonmedical budgets, as well as worries about the effectiveness of coping strategies [30]. In our study, over half of the patients experienced financial difficulty in paying for basic needs such as food, and more than 50% experienced emotional distress in their daily life, aligning with findings from Yu et al [31]. Although our results indicate a substantial emotional burden, further research is needed to determine whether this stems from receiving devastating news of a cancer diagnosis, the financial burden of treatment, or a combination of both. In our study, where over 50% of patients are unemployed, most of them will likely have to adjust their monthly budget and spend less on basic needs to pay for their cancer treatment. As their cancer treatment progresses, which is often prolonged in HM, they may face increasing financial burdens, leading them to adopt coping strategies such as relying on retirement savings, selling valuables, or borrowing from friends, family, or financial institutions [32]. In some cases, patients may resort to maladaptive strategies such as missing hospital appointments, medication nonadherence, or even stopping treatment entirely [33]. In our study, though a few patients missed or delayed treatments due to financial constraints, we see a decrease in the number of patients when followed up on day 30 and day 90. Although only a few patients in our study reported missing or delaying treatment due to financial constraints, we observed a decline in patient follow-up at 30 and 90 days. While the reasons for this attrition are not fully elucidated, the inability to afford ongoing treatment remains a plausible factor. These strategies may temporarily mitigate the financial impact of cancer care but ultimately lead to reduced quality of life, emotional distress, and devastating clinical outcomes.
Limitations
Our study certainly has limitations. First, we had a low sample size, especially at the 90-day time point, as many of our patients were lost to follow-up, deceased, or chose not to continue with the study. Second, although our study was observational, the follow-up period may not have been long enough to detect a significant change in FT across time. Third, we did not collect data on the participants’ monthly income and the number of cycles of chemotherapy received at each survey time. This may have provided additional insights into assessing the severity of FT in our patient population. With our pilot study, we aimed to capture some of the barriers to cancer care in a unique patient population.
Potential Solutions and Future Directions
Mitigating the burden of FT will involve developing and implementing intervention strategies at multiple levels, from the state/national level to the health insurance/payer, hospital, and provider levels [34]. In our study, many patients were worried about the transportation cost to their oncology appointments but were open to telemedicine visits. Therefore, incorporating telemedicine visits as an option in the care of our patient population could offer more flexibility for patients, reducing the travel burden and lost income from missed work [35]. Most of our patients were assessed by a social worker. While they play a role in identifying patients at high risk of financial distress, their assistance may not be sufficient, and they may not have the expertise to provide solutions to mitigate the severity of FT. A dedicated financial navigator, especially in a quaternary academic medical center, is required to help patients understand the economic aspects of their cancer care, budget appropriately, and maximize their employment and disability benefits in the context of ongoing financial commitment [36]. A larger cancer center–wide study is underway to evaluate the social determinants of health and better understand their implications on patient outcomes.
Conclusions
This study highlights the significant and far-reaching impact of FT experienced by patients with cancer, particularly those from socioeconomically disadvantaged and ethnic and racial minority backgrounds. Our findings underscore the need for early FT screening and multilevel interventions to protect vulnerable populations from economic harm during cancer care.
The reference list from the paper itself. Each links out to its DOI / PubMed record.
- 1Siegel RL Miller KD Fuchs HE Jemal A Cancer statistics, 2022 CA Cancer J Clin 012022721733 doi 10.3322/caac.21708 Medline 35020204 · doi ↗ · pubmed ↗
- 2Zafar SY Peppercorn JM Schrag D et al The financial toxicity of cancer treatment: a pilot study assessing out-of-pocket expenses and the insured cancer patient’s experience Oncologist 2013184381390 doi 10.1634/theoncologist.2012-0279 Medline 23442307 PMC 3639525 · doi ↗ · pubmed ↗
- 3Pitis A Diamantopoulou M Panagiotou A Papageorgiou D Tzavella F Financial toxicity and its association with the quality of life of Greek patients with cancer: a cross-sectional study Nurs Rep Feb 13202515267 doi 10.3390/nursrep 15020067 Medline 39997803 PMC 11858100 · doi ↗ · pubmed ↗
- 4Mc Lean L Hong W Mc Lachlan SA Financial toxicity in patients with cancer attending a public Australian tertiary hospital: a pilot study Asia Pac J Clin Oncol Jun 2021173245252 doi 10.1111/ajco.13448 Medline 32894819 · doi ↗ · pubmed ↗
- 5Oshiro NN Nogueira L de A Santos YHD Guimarães PRB Kalinke LP Quality of life and financial toxicity of hematopoietic stem cell transplant recipients in COVID-19Rev Lat Am Enfermagem 202331 e 3995 doi 10.1590/1518-8345.6688.3995 Medline 37729248 PMC 10508220 · doi ↗ · pubmed ↗
- 6Fitch K Ferro C Pittinger S The cost burden of blood cancer care in medicare The Leukemia & Lymphoma Society 2019 UR Lhttps://us.milliman.com/en/insight/the-cost-burden-of-blood-cancer-care-in-medicare Accessed 10-01-2024
- 7Bestvina CM Zullig LL Yousuf Zafar S The implications of out-of-pocket cost of cancer treatment in the USA: a critical appraisal of the literature Future Oncol Nov 2014101421892199 doi 10.2217/fon.14.130Medline 25471033 · doi ↗ · pubmed ↗
- 8Dieguez G Ferro C Rotter D The cost burden of blood cancer care The Leukemia & Lymphoma Society 2018 UR Lhttps://us.milliman.com/en/insight/the-cost-burden-of-blood-cancer-care Accessed 10-01-2024