Study of Platelet Parameters Among Dyslipidaemic Patients
Pavithraa Hariharan, Sri Gayathri Shanmugam, Nagarajan Priyathersini, Muthu Subramanian P S

TL;DR
This study explores how platelet parameters like MPV and P-LCR correlate with lipid levels in dyslipidemic patients, suggesting they could help identify cardiovascular risks.
Contribution
The study establishes specific correlations between individual platelet indices and biochemical lipid parameters in a South Indian cohort.
Findings
Platelet parameters P-LCR and MPV were significantly higher in patients with abnormal lipid profiles.
A significant positive correlation was found between specific platelet indices and individual lipid parameters.
Abstract
Background Platelets play a critical role in thrombotic events. Larger platelets are more enzymatically and metabolically active and therefore have a higher thrombotic potential than smaller platelets. Hyperlipidaemia can lead to various thromboembolic complications, and platelet parameters are useful for assessing this risk. Platelet volume indices are simple, inexpensive, and reliable tools that may be useful for predicting impending acute cardiovascular events. Hyperlipidemia is a major risk factor, and studies generally show increased platelet volume indices among dyslipidemic patients compared to those with a normal lipid profile. However, a significant gap remains, as most existing studies report only a general correlation between platelet volume indices and the presence of dyslipidemia. Few to no studies have specifically correlated individual platelet indices with individual…
Genes, proteins, chemicals, diseases, species, mutations and cell lines named across the full text — each resolved to its canonical identifier and authoritative record.
Click any figure to enlarge with its caption.
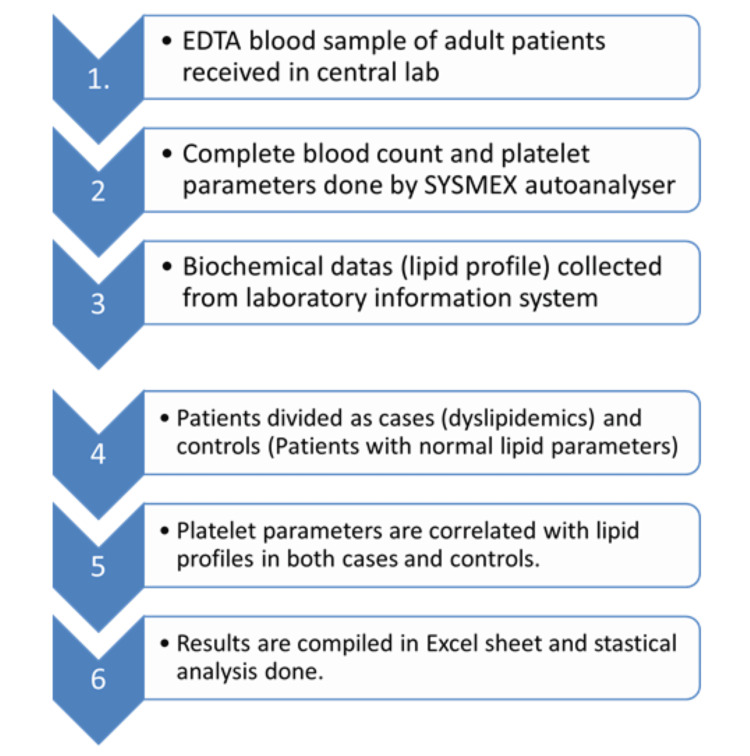 Figure 1
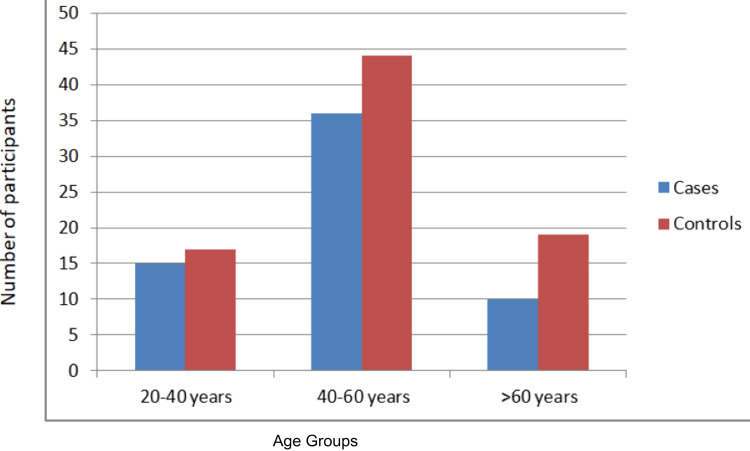 Figure 2
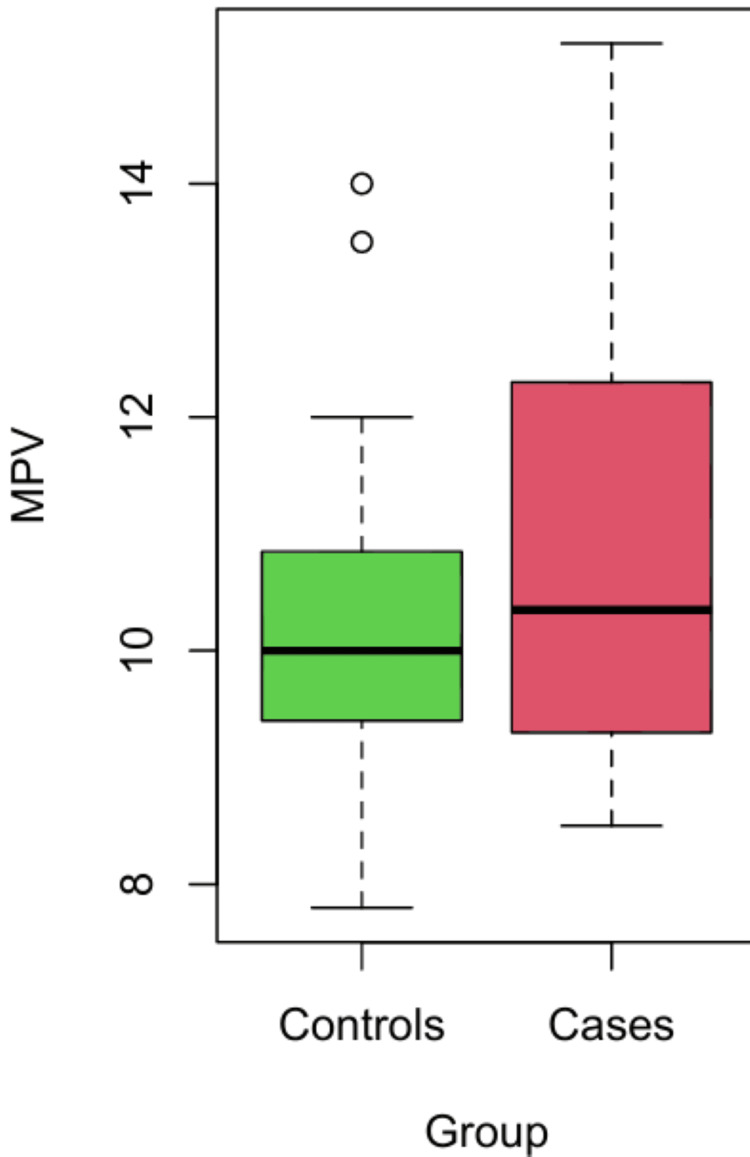 Figure 3
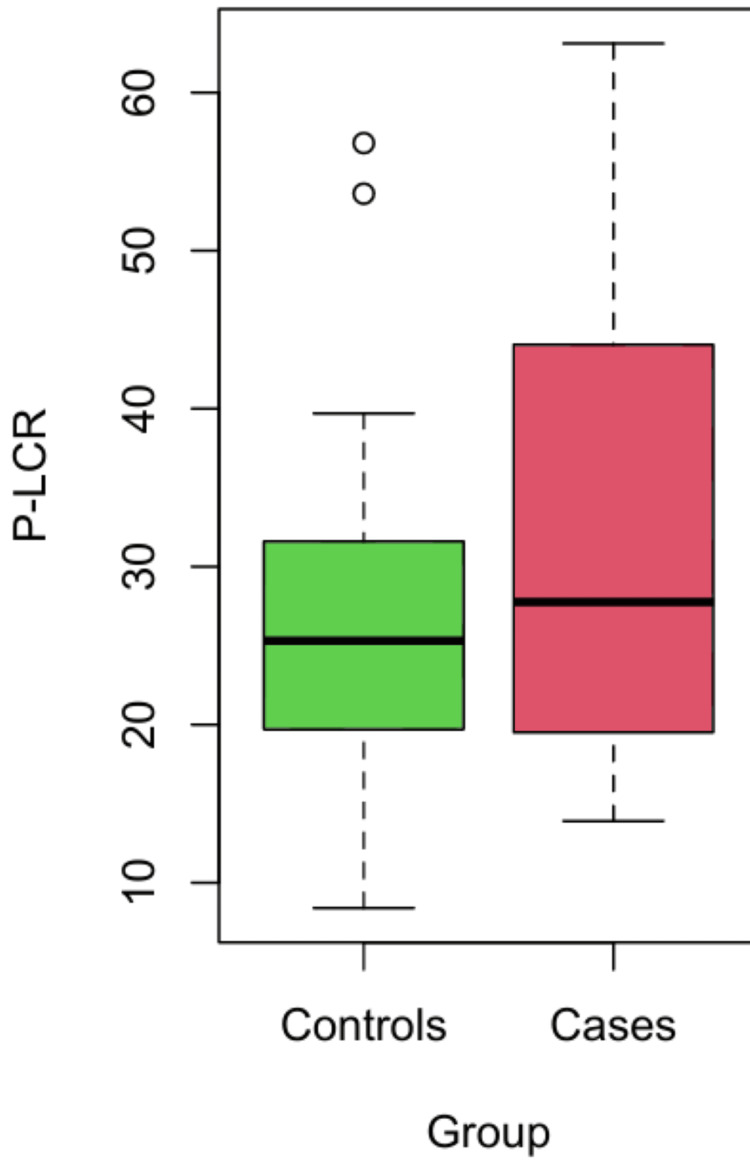 Figure 4
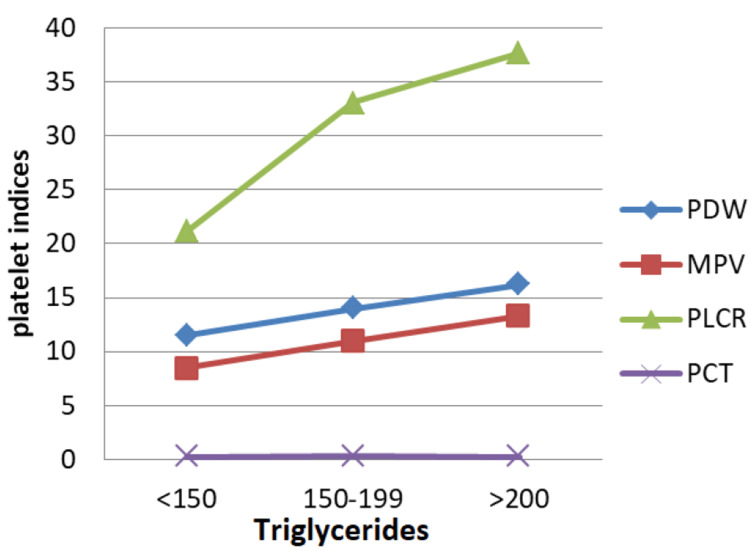 Figure 5
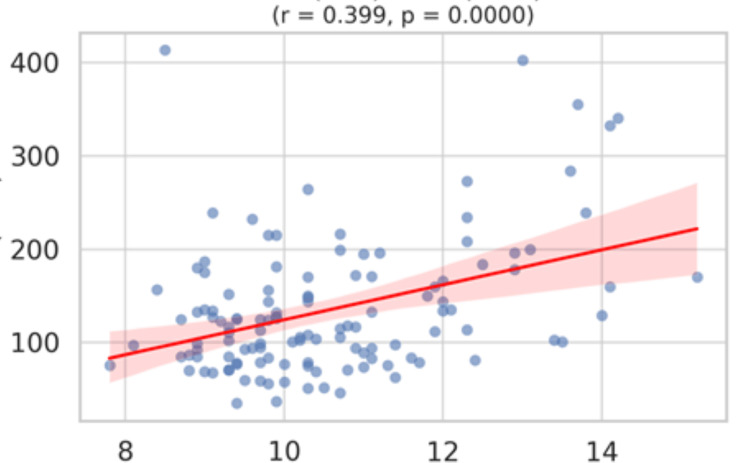 Figure 6
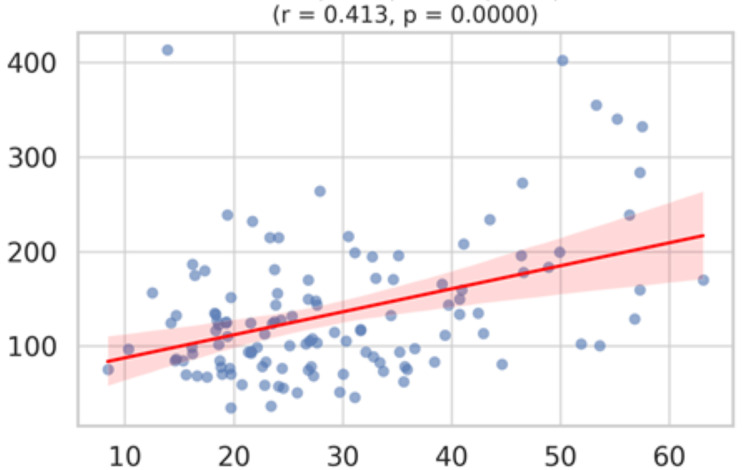 Figure 7
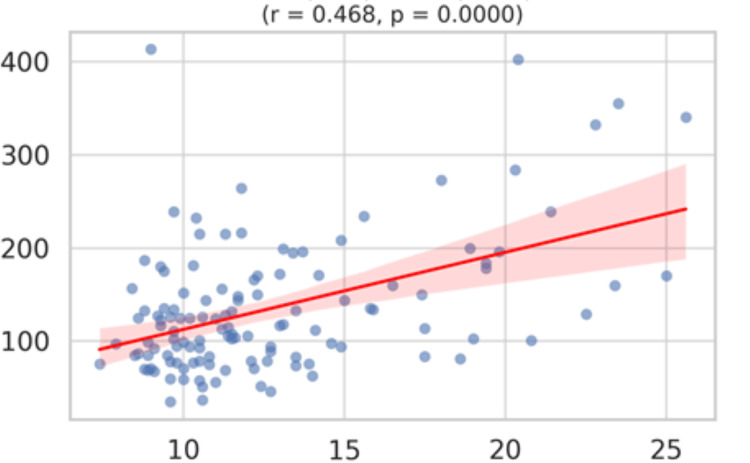 Figure 8
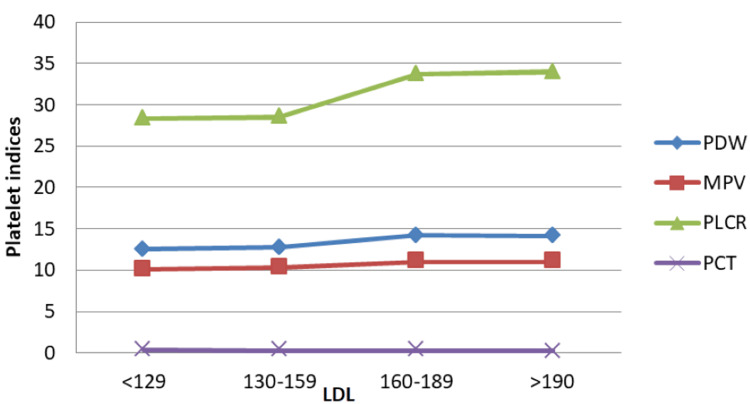 Figure 9
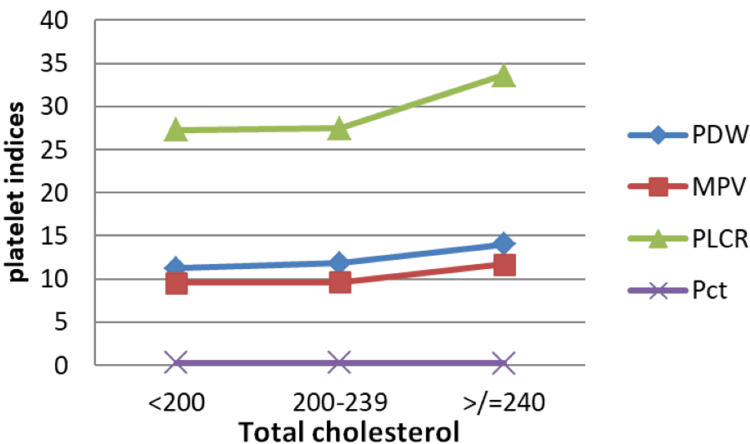 Figure 10
| Parameter | Group | Mean ± SD | Median (IQR) | P-Value |
| MPV (fL) | Cases | 10.97 ± 1.78 | 10.35 (3.00) | 0.003* |
| Controls | 10.16 ± 1.13 | 10.00 (1.45) | ||
| P-LCR (%) | Cases | 32.69 ±14.11 | 27.75 (24.23) | 0.04* |
| Controls | 26.07 ± 9.03 | 25.30 (11.90) |
Peer Reviews
No public reviews on file for this paper yet. If you reviewed it on a platform where reviews are public (OpenReview, ICLR, NeurIPS, ICML), you can paste yours below so the community can read it here.
Videos
No videos yet. Explain this paper in a talk, walkthrough, or lecture? Add one.
Taxonomy
TopicsInflammatory Biomarkers in Disease Prognosis · Antiplatelet Therapy and Cardiovascular Diseases · Probabilistic Statistics in Medicine
Introduction
Dyslipidaemia, characterised by abnormal cholesterol and triglyceride levels, is a major risk factor for cardiovascular disease, which remains the most common cause of morbidity and mortality in India [1-6]. Early diagnosis and regular follow-up are essential.
Platelets are closely related to lipid metabolism in terms of their development, structure, metabolism, and signalling. The platelet lipidome is a complex collection of lipids derived from both exogenous (dietary) and endogenous (de novo) sources. Platelets and megakaryocytes can synthesise lipids de novo, and their lipid composition and function are regulated by the phosphatidylinositol 3-kinase (PI3K) pathway. Upon activation, platelet membrane lipids rearrange with phosphatidylserine signalling, creating a procoagulant surface. Lipids are converted into signalling molecules that influence platelet aggregation, shape change, secretion, and coagulation. Consequently, the lipid profile has a direct impact on platelet activation. Hyperlipidaemia primes platelets and enhances platelet activation, which is a major underlying mechanism in thrombosis [7,8].
Abnormal levels of blood lipids will cause fat deposits in the artery walls, which initiate complications inside the blood vessels. Thereby thrombus occludes a blood vessel and may lead to complications like myocardial infarction. Activated platelets are typically larger, a change that can be reflected in altered platelet volume indices [9-11]. The commonly used hypolipidemic drugs like statins are also found to have some synergistic effects on antiplatelet drugs [12]. The aim of this study was to investigate the association between platelet volume indices and lipid profile.
Materials and methods
This was a cross-sectional comparative study conducted at Sri Ramachandra Institute of Higher Education and Research, Chennai, India, over a four-month period from July 2024 to October 2024. Ethical clearance was obtained from the Institutional Ethics Committee, Sri Ramachandra Institute of Higher Education and Research (CSP-MED/24/AUG/107/265). Informed consent was waived as the data were derived from a laboratory database.
Study population
The sample size of the study was 120. The participants were recruited using a consecutive sampling method. Biochemical data were collected from the laboratory information system database after obtaining
Among 120 patients, those with deranged lipid profiles based on National Cholesterol Education Program (NCEP) guidelines were included in the study group (n = 60), and age- and sex-matched participants with normal lipid profiles served as controls (n = 60).
Samples collected for complete blood count were included in the study and analysed for platelet parameters. Patients below 20 years of age, samples with prolonged storage, known hereditary platelet disorders, thrombocytopenia, previous blood transfusion, history of diabetes, patients receiving hypolipidaemic or antiplatelet medication, and those presenting with any acute inflammatory condition were excluded from the study.
The 120 participants were divided into two groups: (i) Study group comprising patients with abnormal lipid profiles (total cholesterol > 200 mg/dL, fasting triglycerides > 150 mg/dL, low-density lipoproteins > 100 mg/dL), and (ii) Control group comprising patients with normal lipid profiles
Study process
Ethylenediaminetetraacetic acid (EDTA)-anticoagulated whole-blood samples were collected from all participants. Platelet parameters, including mean platelet volume (MPV), platelet large cell ratio (P-LCR), platelet distribution width (PDW), and plateletcrit (Pct), were analysed using the SYSMEX XN-3100 analyser (Sysmex Corporation, Kobe, Hyogo, Japan). Fasting blood samples were collected, and lipid profiling was done by the photoelectric method in cobas® e 602 (Roche Holding AG, Basel, Switzerland), and the data were obtained from the laboratory information system. The method of the study is explained as a flowchart (Figure 1).
Flowchart representing the study processEDTA: ethylenediaminetetraacetic acid
Statistical analysis
The data were compiled in Microsoft Excel (Microsoft Corporation, Redmond, Washington, United States), and normality was analysed statistically using IBM SPSS Statistics for Windows, version 26 (IBM Corp., Armonk, New York, United States). The normality test was done by observing the QQ plot and the Kolmogorov-Smirnov test. A p-value of <0.05 in the Kolmogorov-Smirnov test was considered as non-normal data. As MPV was normally distributed, the mean values of the two groups were compared using the independent t-test. As the variable P-LCR was not normally distributed, the median was compared using the Mann-Whitney U test.
Results
The study included 120 participants divided into cases and controls according to fasting lipid profiles. Patients with deranged lipid parameters, such as elevated total cholesterol, low-density lipoprotein (LDL), or triglycerides, were categorised as cases (n = 60). Participants with normal lipid parameters served as controls (n = 60). Among the study population, 55 were female and 65 were male. All were above 20 years of age, with most between 40 and 60 years (Figure 2).
Age distribution of cases and controls.
Primary analysis
MPV, PDW, P-LCR, and Pct were compared between the case and control groups. As MPV was normally distributed, the mean value of cases and controls was compared using the independent t-test. The mean MPV was higher for cases than for controls, and the difference was statistically significant. As the variable P-LCR was not normally distributed, the median was compared using the Mann-Whitney U test. The median P-LCR value was higher in cases compared to controls, and the difference was statistically significant (p = 0.003 and p = 0.04, respectively) (Table 1, Figures 3, 4).
R-plot distribution of MPVMPV: mean platelet volume
R-plot distribution of P-LCR P-LCR: platelet-large cell ratio
After seeing that, in general, platelet parameters were increased among dyslipidaemic individuals than the control group, each platelet parameter was correlated with the lipid profile.
Correlation analysis
Triglyceride Levels
According to the NCEP Adult Treatment Panel (ATP) III guidelines [13], fasting triglyceride levels are classified as normal (< 150 mg/dL), borderline high (150-499 mg/dL), high (200-499 mg/dL), and very high (> 500 mg/dL). Pct showed no marked change across these categories. However, P-LCR, MPV, and PDW exhibited upward trends, with P-LCR demonstrating a sharp rise when triglycerides exceeded 150 mg/dL (Figure 5).
Correlation between PDW, MPV, P-LCR, and Pct and fasting triglyceride levels.Units: Triglycerides: mg/dL, PDW: fL, MPV: fL, P-LCR: %, and Pct: %PDW: platelet distribution width; MPV: mean platelet volume; P-LCR: platelet-large cell ratio; Pct: plateletcrit
By Pearson's correlation test, triglycerides showed a statistically significant positive correlation with MPV (r = 0.399, p < 0.001), P-LCR (r = 0.413, p < 0.001), and PDW (r = 0.468, p < 0.001). This implies that higher triglyceride levels are associated with larger and more heterogeneous platelets. A moderate positive correlation (r = 0.399, p < 0.001) shows that as triglyceride levels increase, mean platelet volume also tends to rise, indicating possible activation and enlargement of circulating platelets (Figure 6).
A scatterplot matrix (or pairwise correlation chart) for triglycerides vs MPV highlighting the significant correlation.Y axis: Triglycerides in mg/dL; X axis: MPV (mean platelet volume) in fL
Similarly, P-LCR demonstrates a significant positive association (r = 0.413, p < 0.001), confirming a higher proportion of large platelets with elevated triglycerides. (Figure 7).
A scatterplot matrix (or pairwise correlation chart) for triglycerides vs P-LCRX axis: Platelet-large cell ratio (P-LCR) in %; Y axis: Triglycerides in mg/dL
PDW exhibits the strongest relationship (r = 0.468, p < 0.001) among platelet indices, reflecting increased platelet heterogeneity with hypertriglyceridemia (Figure 8).
A scatterplot matrix (or pairwise correlation chart) for triglycerides vs PDWX axis: Platelet distribution width (PDW) in %; Y axis: Triglycerides in mg/dL
LDL Levels
LDL was categorised as above-optimal (100-129 mg/dL), borderline-high (130-159 mg/dL), high (160-189 mg/dL), and very high (> 190 mg/dL), according to NCEP-ATP III criteria. Pct showed a mild downward trend with increasing LDL, while PDW and MPV fluctuated slightly. P-LCR increased progressively and displayed a marked rise at borderline-high LDL levels (Figure 9).
Correlation between PDW, MPV, P-LCR, and Pct and LDL levels.Units: LDL: mg/dL, PDW: fL, MPV: fL, P-LCR: %, Pct: %PDW: platelet distribution width; MPV: mean platelet volume; P-LCR: platelet-large cell ratio; Pct: plateletcrit; LDL: low-density lipoprotein
By Pearson's correlation test, LDL did not show any significant correlation with platelet indices (all p values > 0.05), suggesting limited direct association between cholesterol fractions and platelet morphology.
Total Cholesterol Levels
In line with NCEP guidelines [13], total cholesterol < 200 mg/dL is considered desirable, 200-239 mg/dL borderline-high, and ≥ 240 mg/dL high. Pct demonstrated a decreasing trend, whereas MPV, PDW, and P-LCR rose sharply in individuals with high cholesterol (Figure 10).
Correlation between PDW, MPV, P-LCR, and Pct and total cholesterol levels.Units: Total Cholesterol: mg/dL, PDW: fL, MPV: fL, P-LCR: %; Pct: %PDW: platelet distribution width; MPV: mean platelet volume; P-LCR: platelet-large cell ratio; Pct: plateletcrit
By Pearson's correlation test, total cholesterol did not show any significant correlation with platelet indices (all p values > 0.05), suggesting a limited direct association between cholesterol fractions and platelet morphology. On the whole, Pct remained independent of all lipid parameters, with near-zero correlations in Pearson's correlation test, indicating it behaves as a distinct platelet mass measure.
Discussion
In this study, platelet indices were calculated and compared with lipid parameters, including total cholesterol, LDL, and triglycerides. The lipid parameters were classified according to the NCEP ATP III criteria [13]. The NCEP is a United States National Institutes of Health initiative aimed at reducing cardiovascular disease associated with hypercholesterolemia. The mean values were plotted as linear graphs, which demonstrated a marked increase in platelet indices corresponding to higher lipid levels. Platelet parameters (MPV, P-LCR, and PDW) were significantly higher in a proportion of cases compared with controls [6-12], whereas Pct showed no significant changes with a change in lipid levels. Sharma et al. compared PDW, P-LCR, and MPV and platelet function between patients with normal and abnormal lipid profiles, showing a statistically significant increase in all three indices among cases [14]. Our findings are consistent with those results, demonstrating similar elevations in these parameters. With respect to the association between lipid parameters and platelet indices, increases in MPV and P-LCR were proportionate to the levels of triglycerides and total cholesterol [15]. Several recent studies suggest that dyslipidemia promotes platelet activation and alters platelet indices through mechanisms such as oxidative stress and PI3K signalling. Gautam et al. also reported significant correlations between PDW and both LDL and total cholesterol in their study comparing platelet parameters and lipid profiles [8].
Several studies have reported that PDW and MPV are elevated in patients with valvular diseases and in those with abnormal lipid profiles [5,9]. A clinical study in the general population found that elevated MPV is associated with a higher risk of myocardial infarction, independent of established cardiovascular risk factors [10]. Similarly, Igor Spasic et al. [11] demonstrated that LDL levels are significantly associated with an increased risk of deep vein thrombosis. Statins remain the most commonly used hypolipidaemic agents. Various mechanisms have been proposed through which these drugs exert antiplatelet effects, and they may also act synergistically with other antiplatelet drugs such as clopidogrel [12].
When categorised according to the NCEP ATP III protocol [13], P-LCR exhibited a distinct plateau at borderline-high LDL and very high cholesterol levels. With respect to triglycerides, even minimal increases above the desirable range were associated with an increase in P-LCR, which continued to rise with higher triglyceride levels. Among the lipid parameters, P-LCR showed the most sensitive response to variations in fasting triglyceride concentration.
Limitations and future scope
In this study, most of the confounding factors, including acute inflammation, diabetes, smoking, use of hypolipidemic drugs, and antiplatelet drugs, are eliminated; thus, a real-time comparison can be done in the future with these individual confounding factors. Moreover, the relatively small sample size of our cohort is a critical limitation, restricting the generalizability of our findings to the broader population. Therefore, a larger community-based study is warranted for validation.
Conclusions
The NCEP guidelines emphasise that cardiovascular morbidity risk is proportional to the severity of lipid elevation and recommend monitoring lipid levels to assess cardiovascular risk and to guide treatment initiation and dosage adjustment. Although fasting lipid profile tests are commonly used, they are relatively costly and require a fasting sample. In contrast, platelet parameters, which are inexpensive and readily available as part of a routine complete blood count, appear to be a promising, convenient, and cost-effective tool for monitoring patients with lipid disorders, as they do not require a fasting sample. However, given the preliminary nature of these findings, their definitive role in clinical practice requires validation in larger, population-based studies before they can be adopted as a standard monitoring tool.
The reference list from the paper itself. Each links out to its DOI / PubMed record.
- 1Significance of platelet volume indices and platelet count in ischaemic heart disease J Clin Pathol Ranjith MP Divya R Mehta VK Krishnan MG Kamal Raj R Kavishwar A 8308336220091973448210.1136/jcp.2009.066787 · doi ↗ · pubmed ↗
- 2Platelet volume indices in patients with coronary artery disease and acute myocardial infarction: an Indian scenario J Clin Pathol Khandekar MM Khurana AS Deshmukh SD Kakrani AL Katdare AD Inamdar AK 1461495920061644372810.1136/jcp.2004.025387 PMC 1860313 · doi ↗ · pubmed ↗
- 3Cholesterol in platelet biogenesis and activation Blood Wang N Tall AR 1949195312720162692927310.1182/blood-2016-01-631259 PMC 4841038 · doi ↗ · pubmed ↗
- 4Characteristics of platelet indices and their prognostic significance in selected medical condition - a systematic review Adv Med Sci Pogorzelska K Krętowska A Krawczuk-Rybak M Sawicka-Żukowska M 3103156520203250585610.1016/j.advms.2020.05.002 · doi ↗ · pubmed ↗
- 5Platelet volume parameters as predictors of valvular thrombosis risk in patients with aortic and mitral valve replacement Clin Appl Thromb Hemost Pourbashash B Eftekhar SP Ahmadi P Jalali A Hosseinsabet A Badalabadi RM 107602962413112683120253979133410.1177/10760296241311268 PMC 11719430 · doi ↗ · pubmed ↗
- 6Determination of reference intervals for platelet parameters using Sysmex XN-1000 among south Indian population J Clin Diag Res Gnanadeepam S Selvajothi P Sumathy M Kuzhali S Sujatha A 3640162022 https://doi.org/10.7860/JCDR/2022/54863.16899
- 764th annual conference of Indian Society of Hematology & blood transfusion (ISHBT), November 2023 Indian J Hematol Blood Transfus 1199392023 https://doi.org/10.1007/s 12288-023-01705-7
- 8A study of relationship between platelet parameters and hyperlipidemia Nepalese Med J Gautam D Khadgi R 60260552022 https://doi.org/10.3126/nmj.v 5i 2.52171