Deciphering the role of ThHSF1 in the differential expression regulation of laccase isozymes in the white-rot fungus Trametes hirsuta
Kun Wu, Rong Zhu, Shiwen Zhao, Chenkai Wang, Xinlei Zhang, Shenglong Liu, Zemin Fang, Yazhong Xiao, Juanjuan Liu

TL;DR
This study identifies ThHSF1 as a key regulator of laccase isozyme expression in a white-rot fungus, offering a strategy to boost laccase production for industrial use.
Contribution
The novel contribution is the discovery of ThHSF1 and its interaction with ThHspA1 in regulating specific laccase isozymes in response to copper stress.
Findings
ThHSF1 is a copper-responsive transcription factor that regulates the expression of LacA, LacB, and LacF isozymes.
Silencing Thhsf1 reduces the transcription and activity of LacA, LacB, and LacF but not LacC.
Co-overexpression of ThHSF1 and ThHspA1 increases laccase activity by approximately 1.5-fold.
Abstract
White-rot fungi exhibit responses to Cu2+, leading to a substantial increase in the production of certain laccase isozymes for industry utilization. Currently, studies on the differential expression mechanism of the laccase isozymes in white-rot fungi are limited. Three laccase isozymes, LacA, LacB, and LacF, were significantly induced in Trametes hirsuta AH28-2 when exposed to Cu2+, accompanied by a slight enhancement in the isozyme LacC level. Here, based on transcriptomics and proteomics, a nuclear-localized heat shock transcription factor, ThHSF1, was mined and exhibited as a copper-responsive protein involved in the differential regulation of laccase isozyme expression. A changed colony morphology and curved hyphal morphology were observed in three Thhsf1-silenced T. hirsuta AH28-2 transformants in response to Cu2+ stress. Thhsf1 silencing resulted in downregulated transcriptional…
Genes, proteins, chemicals, diseases, species, mutations and cell lines named across the full text — each resolved to its canonical identifier and authoritative record.
Click any figure to enlarge with its caption.
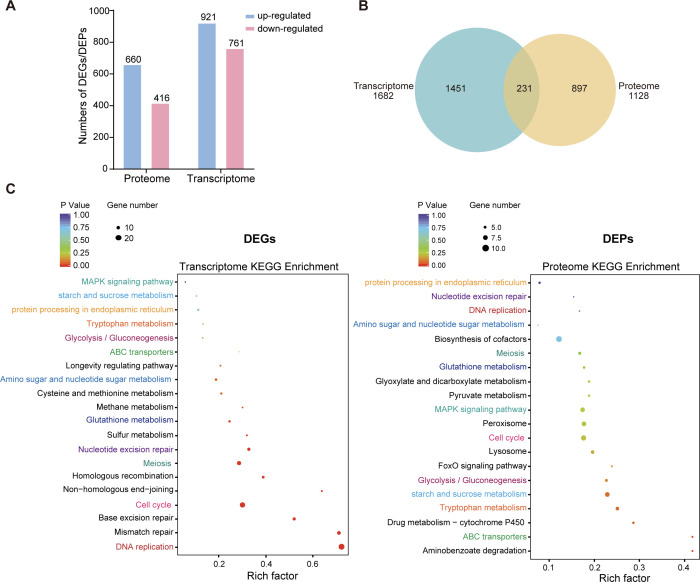 Fig 1
Fig 1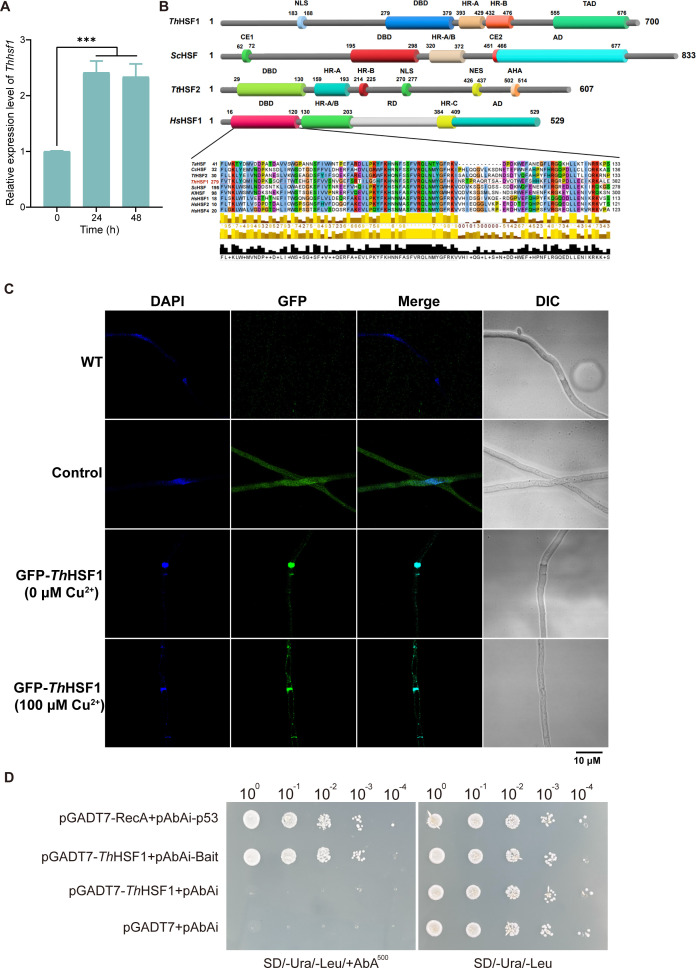 Fig 2
Fig 2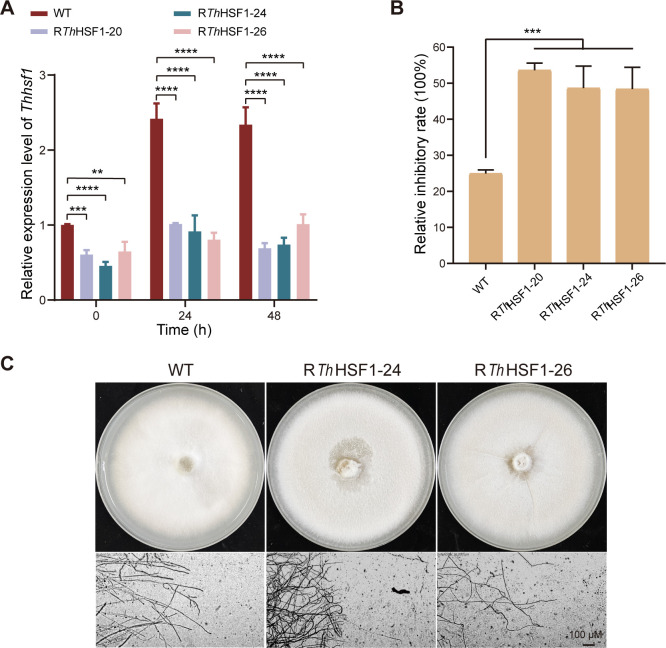 Fig 3
Fig 3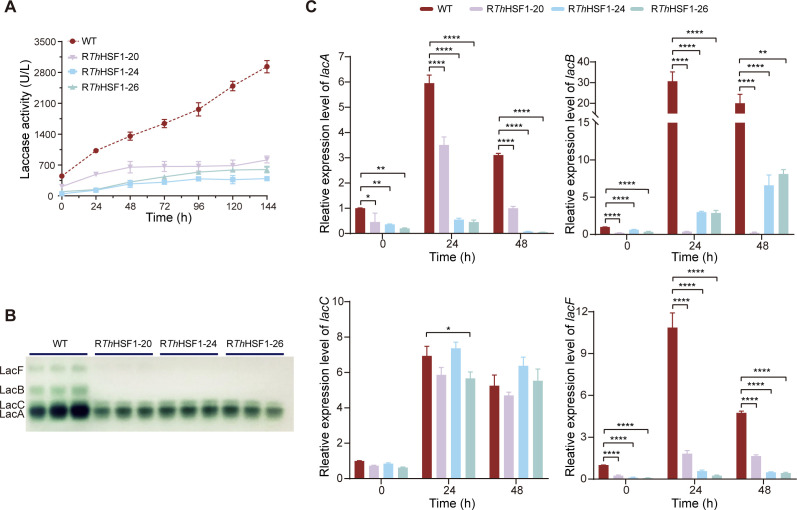 Fig 4
Fig 4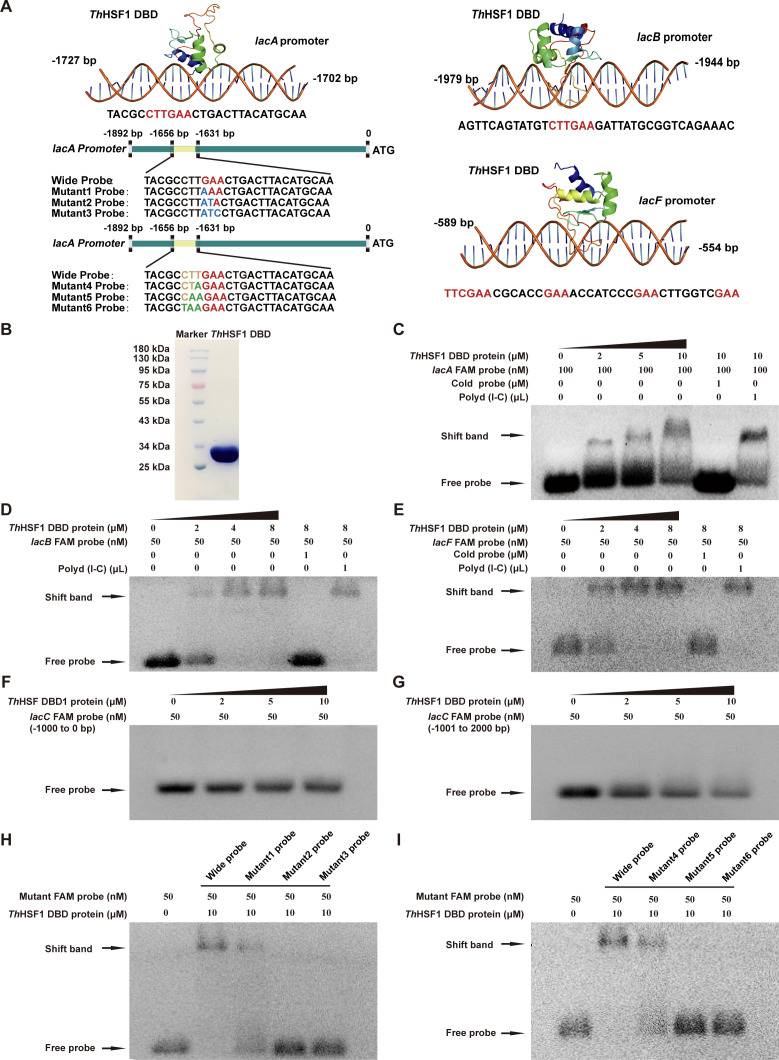 Fig 5
Fig 5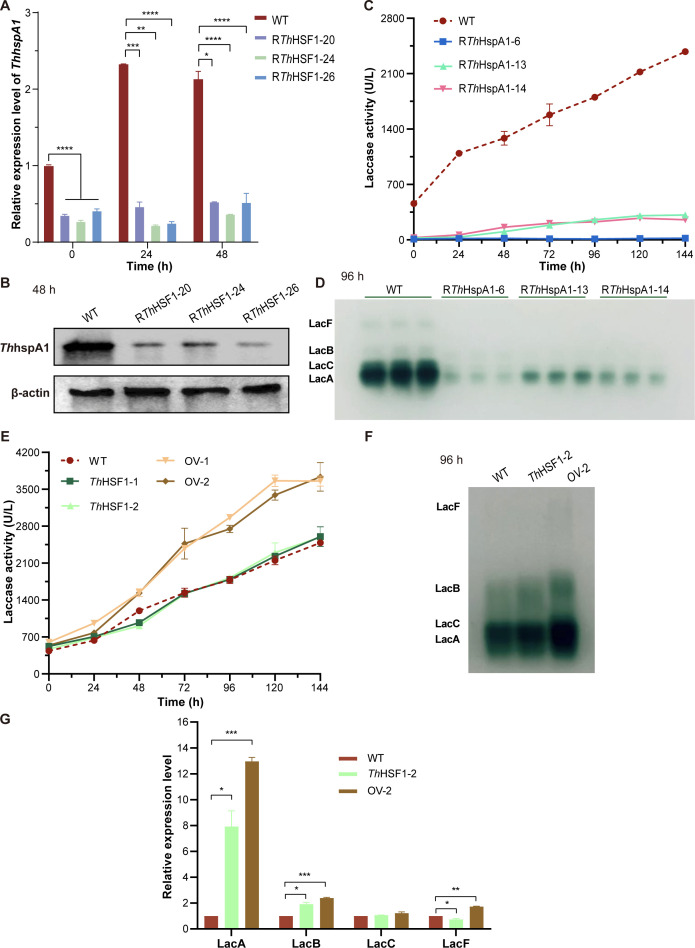 Fig 6
Fig 6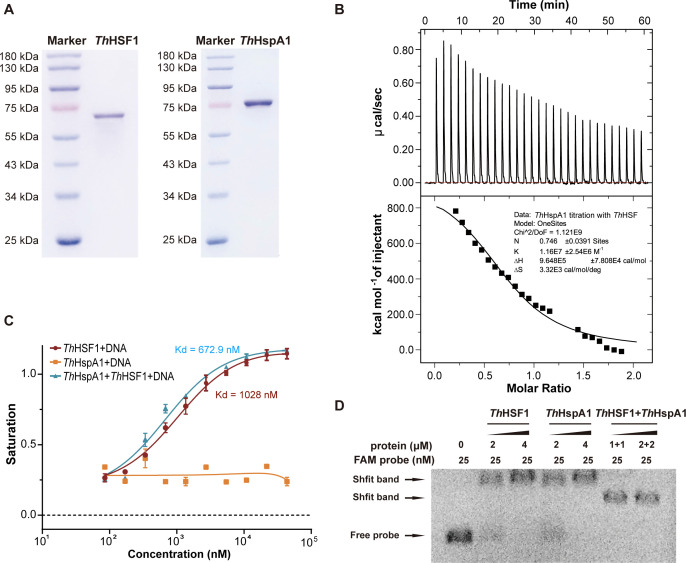 Fig 7
Fig 7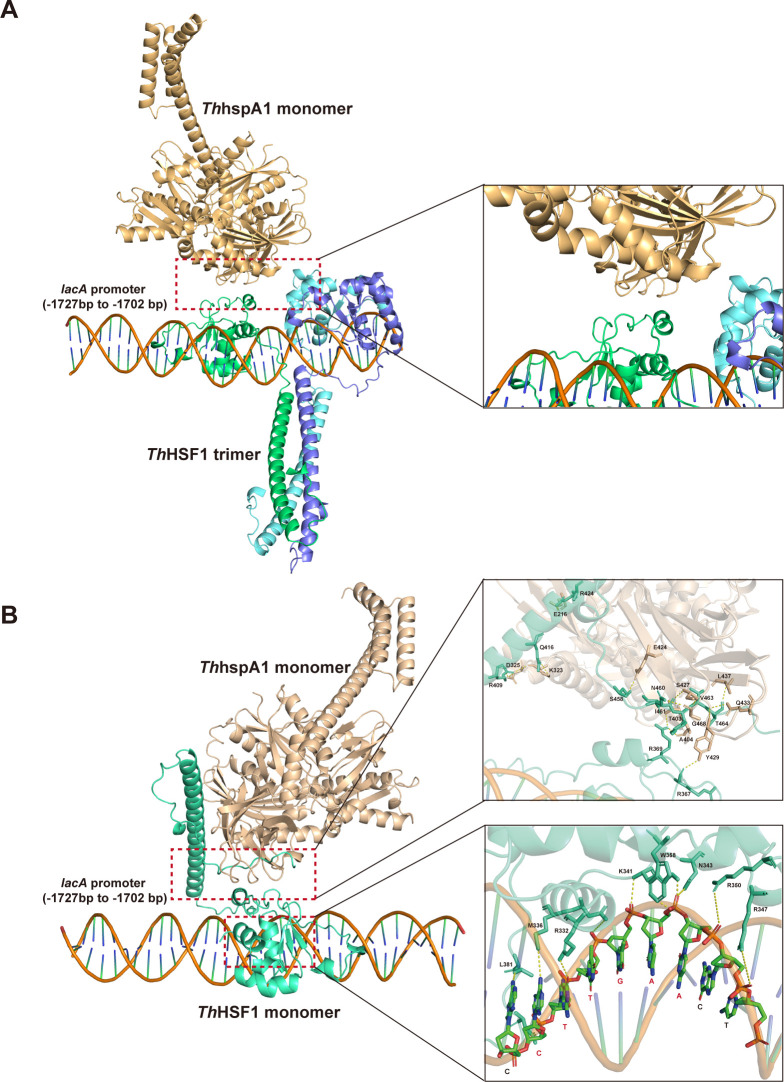 Fig 8
Fig 8| ID | TF name | Fold change (DEGs) | Fold change (DEPs) | ||
|---|---|---|---|---|---|
| GME10088_g | Zinc finger, CCHC-type | 2.107908998 | 7.51263E-07 | 1.57532043 | 0.045406063 |
| GME2510_g | GATA type zinc finger | 1.5869992 | 0.001778069 | 1.575952684 | 0.033066179 |
| GME4340_g | GATA type zinc finger | 1.795357064 | 8.26901E-05 | 1.606574751 | 0.0050983 |
| GME8357_g | C2H2 zinc finger | 1.838851047 | 0.000046861 | 1.699217276 | 0.038145886 |
| GME2432_g | Nucleic acid-binding | 4.158711649 | 3.68075E-06 | 1.792502092 | 0.048178675 |
| GME11621_g | bHLH | 2.019026652 | 0.000276094 | 1.815055236 | 0.038209986 |
| GME1888_g | Nucleic acid-binding | 3.018344695 | 0.003428255 | 1.891711089 | 0.007754755 |
| GME1535_g | Zn2Cys6 | 1.942188908 | 1.84772E-05 | 1.927006421 | 0.009949426 |
| GME1466_g | Zn2Cys6 | 1.663835455 | 0.000561435 | 2.175673245 | 0.007131924 |
| GME4300_g | Zn2Cys6 | 3.446857579 | 0.000112759 | 3.581676361 | 0.042828236 |
| GME11612_g | Bromodomain | 1.401473113 | 0.026117111 | 2.381173829 | 0.00791596 |
| GME1868_g | C2H2 zinc finger | 1.874052153 | 2.17393E-05 | 2.521320205 | 0.018508829 |
| GME6110_g | Nucleic acid-binding | 3.010867141 | 5.3032E-10 | 2.634908185 | 0.017968958 |
| GME10687_g | GATA type zinc finger | 1.808039087 | 0.000046184 | 2.801842872 | 0.000187236 |
| GME5442_g | Winged helix repressor | 3.381799047 | 0.001132513 | 2.985381372 | 0.034732672 |
| GME1417_g | Homeodomain-like | 15.39403547 | 5.17963E-17 | 89.33758714 | 0.012148507 |
| GME4084_g | Heat shock | 1.406437642 | 0.019737603 | 3.578007108 | 0.04777482 |
| GME2780_g | Lambda repressor-like | 0.356524313 | 0.002240857 | 0.31439301 | 0.025876009 |
| GME2836_g | HMG | 0.559144061 | 0.000079104 | 0.32075343 | 0.012164611 |
| GME282_g | Nucleic acid-binding | 0.733516994 | 0.036540703 | 0.355175569 | 0.013484173 |
| GME5687_g | Nucleic acid-binding | 0.687861656 | 0.015040272 | 0.462004093 | 0.01563177 |
| GME7650_g | Nucleic acid-binding | 0.450292964 | 5.50343E-08 | 0.556160881 | 0.001219601 |
| GME851_g | Nucleic acid-binding | 0.475954308 | 1.37765E-06 | 0.600757576 | 0.005478666 |
| GME351_g | Nucleic acid-binding | 0.727044028 | 0.03396102 | 0.630561742 | 0.00850075 |
| GME1542_g | C2H2 zinc finger | 0.270782077 | 3.85336E-18 | 0.674106415 | 0.030503107 |
| GME7020_g | HMG | 0.464816591 | 4.25848E-07 | 0.767384294 | 0.014950677 |
- —National Natural Science Foundation of Chinahttp://dx.doi.org/10.13039/501100001809
- —National Natural Science Foundation of Chinahttp://dx.doi.org/10.13039/501100001809
- —National Natural Science Foundation of Chinahttp://dx.doi.org/10.13039/501100001809
- —National Key Research and Development Program of Chinahttp://dx.doi.org/10.13039/501100012166
- —Natural Science Foundation of Anhui Provincehttp://dx.doi.org/10.13039/501100003995
Peer Reviews
No public reviews on file for this paper yet. If you reviewed it on a platform where reviews are public (OpenReview, ICLR, NeurIPS, ICML), you can paste yours below so the community can read it here.
Videos
No videos yet. Explain this paper in a talk, walkthrough, or lecture? Add one.
Taxonomy
TopicsEnzyme-mediated dye degradation · Fungal and yeast genetics research · melanin and skin pigmentation
INTRODUCTION
Laccase (benzenediol: oxygen oxidoreductases, EC 1.10.3.2) belongs to the family of copper-containing polyphenol oxidases. It serves as a polyphenol oxidase that oxidizes phenolic and aromatic compounds while simultaneously reducing molecular oxygen to water (1). Laccase plays diverse roles in different organisms, participating mainly in processes such as lignification, delignification, fungal morphogenesis, detoxification, plant infection, and oxidative stress (2–5). In the industry, it functions as a green catalyst and is utilized in various applications, including dye decolorization, detoxification of environmental pollutants, and pulp bleaching (6–8).
Laccases are widely distributed in fungi, plants, bacteria, lichens, and insects, particularly abundant in many white-rot fungi (9). Among them, basidiomycetes are the most efficient laccase producers (10), typically harboring multiple laccase isozyme genes in their genomes. These isozymes exhibit varied expression patterns in response to environmental factors, such as interfungal interactions, carbon and nitrogen source concentrations, as well as external inducing substances (metal ions and aromatic compounds from lignin monomer structures) (11). For metal ions, Cu^2+^ is considered the most effective inducer for enhancing laccase activity (12). Many basidiomycetes similarly show differential expression of multiple laccase isozymes under Cu^2+^ exposure, with examples including Pleurotus ostreatus (3 genes) (13), Flammulina velutipes (11 genes) (14), Cerrena unicolor (5 genes) (15), Trametes hirsuta 072 (5 genes) (16), Ganoderma sp. (6 genes) (17), and Peniophora lycii (18). These increment laccase isozymes usually have different properties and display distinct physiological features to not only allow fungi to succeed in a range of environments but also widen their industrial applications.
The prevailing viewpoint suggests that the induction and activation mechanism for fungal laccase transcription involves the interaction of specific transcription factors with upstream promoter regions in the presence of certain inducers (11). This hypothesis has been supported by the reported transcription factors, including Mac1, Ace1 and its homologs Cuf1, Ltf4, and ThSerRS controlling laccase expression upon exposure to Cu^2+^. In Aspergillus fumigatus, the AfMac1-binding motif in ctrC is identified as 5′-TGTGCTCA-3′ (19). Ace1 interacts with the ACE element in laccase gene promoters, as observed in Ceriporiopsis subvermispora binding to the conserved motif (5′-CAGCGAAA-3′) within lcs and Polyporus brumalis ibrc05015 binding to the conserved motif (5‘-CAGCTCTAC-3′) within Pblac1 (20, 21). Deletion of cuf1 in Cryptococcus neoformans leads to a reduction in expression levels and activities of Lac1 (22). Furthermore, a yeast one-hybrid approach has been employed to identify transcription factors, including Ltf4 featuring an HTH DNA-binding domain and binding to DNA fragments containing the metal response element (MRE) within the poxc promoter region of P. ostreatus (23, 24) and ThSerRS showing a noncanonical activity of upregulating lacA transcription through binding to DNA fragments containing the xenobiotic response element (XRE) in T. hirsuta AH28-2 (25). These studies collectively highlight the complex and intricate mechanisms underlying laccase transcription during Cu^2+^ response. However, there is currently a lack of research focusing on elucidating the regulatory mechanisms responsible for the differential expression of fungal laccase isozymes mediated by specific transcription factors.
Heat shock transcription factors (HSFs) are highly conserved proteins across organisms ranging from fungi to humans. They serve as key regulators in multiple physiological processes, including heat stress response, oxidative stress tolerance, membrane lipid biosynthesis, hyphal growth, spore formation, and pathogenic fungal virulence (26–32). In stressful situations, HSFs undergo trimerization and bind to the heat shock elements (HSEs) located within the promoters of stress-inducible genes. This interaction triggers the activation of target proteins, such as molecular chaperones like heat shock protein 70 (Hsp70), along with other stress-related proteins (33, 34). Potential HSEs are highly prevalent within the upstream regulatory regions of numerous laccase genes in white-rot fungi (11). Additionally, since HSF can form a complex with DNA-binding transcription co-activator Ssa1 and interact with the promoter region of lac1 in C. neoformans (35), suppression of Pshsf1 results in a decline in laccase activity and diminished expressions of the isozymes PsLac4 and PsLac5 in Phytophthora sojae (29), and two spliced variants (TtHSF2α and TtHSF2β-I) of TtHSF2 exhibit opposing effects on laccase expression in Trametes trogii (36), HSFs have been identified as crucial regulators governing laccase activity. However, it remains unknown whether HSF is involved in regulating all Cu^2+^-induced laccase isozymes within a species.
The white-rot fungus T. hirsuta AH28-2 was isolated from decaying wood in China (37). It possesses six laccase isozymes, with LacA, LacB, and LacC being overexpressed during Cu^2+^ exposure, as reported previously (38, 39). Recently, a new Cu^2+^-induced isozyme, LacF, was also characterized (40). Here, a nuclear-localized copper-responsive heat shock transcription factor, ThHSF1, was identified through comparative proteomic and transcriptomic analyses of T. hirsuta AH28-2 mycelia treated with Cu^2+^. The gene silencing experiments, quantitative reverse transcription-PCR (qRT-PCR) analysis, electrophoretic mobility shift assay (EMSA), and fluorescence polarization (FP) collectively demonstrated specific and direct regulation of ThHSF1 on lacA, lacB, and lacF while excluding lacC. The DNA-binding transcription factor ThHspA1, previously reported to function in LacA regulation upon aromatic stress (41), was also targeted by ThHSF1 during Cu^2+^ induction. ThHSF1 and ThHspA1 could interact to form a complex and synergistically enhance the expressions of LacA, LacB, and LacF. Co-overexpression of ThHSF1/ThHspA1 provided an efficient strategy for boosting laccase production.
RESULTS
Overview of comparative proteomic and transcriptomic analyses of T. hirsuta AH28-2 exposed to Cu2+
Cu^2+^ is an efficient inducer for the overexpression of laccase isozymes in T. hirsuta AH28-2, such as LacA, LacB, LacC, and LacF (39, 40). To investigate the regulatory mechanism of these laccases, T. hirsuta AH28-2 was first inoculated into liquid XH media supplemented with varying concentrations of CuSO_4_ (100–1,000 µM) to determine the optimal induction conditions. The highest laccase activity was observed at 100 µM Cu^2+^ (Fig. S1A and B). qRT-PCR analysis further revealed a significant increase in transcriptional levels of these four isozymes during the first 48 h of 100 µM Cu^2+^ treatment (Fig. S1C).
Laccase expression in most fungi is regulated strictly at the transcriptional level. The mycelia, exposed to 100 µM Cu^2+^ for 48 h, were collected for proteomic and transcriptomic analyses to identify Cu²^+^-responsive transcription factors or co-regulators. A total of 4,499 proteins and 10,984 genes were detected, of which 1,128 proteins (660 upregulated and 416 downregulated) and 1,682 genes (921 upregulated and 761 downregulated) were identified as differentially expressed genes (DEGs)/differentially expressed proteins (DEPs) (P value < 0.05), respectively (Fig. 1A). After overlapped analysis, 231 DEGs/DEPs were consistent between both omics (Fig. 1B). To evaluate the significance of this overlap against a null model, the DEG and DEP sets were treated as independent samples drawn from all detected transcripts, and a hypergeometric test was applied. The expected overlap under the assumption of independence was 173, whereas the observed overlap of 231 was significantly greater. Both upregulated and downregulated features were included in the overlap analysis, and the 231 DEG–DEP pairs were further stratified by expression directionality, with concordant pairs predominating. A complete list of these pairs, including fold changes and expression directions, is provided in Table S1.
Transcriptomic and proteomic analyses of T. hirsuta AH28-2 upon exposure to 100 µM Cu2+ for 48 h. (A) Numbers of the upregulated and downregulated differentially expressed genes (DEGs) and differentially expressed proteins (DEPs). (B) Venn diagrams. (C) Kyoto Encyclopedia of Genes and Genomes (KEGG) pathway enrichment analysis of DEGs (left panel) and DEPs (right panel) identified in T. hirsuta AH28-2 after 48 h of 100 µM Cu²+ exposure. Each dot represents an enriched KEGG pathway. The X-axis indicates the rich factor (the ratio of the number of DEGs/DEPs in a pathway to the total number of genes annotated in that pathway), the size of the dot indicates the number of genes/proteins involved, and the color reflects the adjusted P value. KEGG pathways that are enriched in both omics data sets are labeled with the same font color on the Y-axis to facilitate comparison.
According to Gene Ontology (GO) analysis, DEGs/DEPs associated with cellular processes and metabolic processes in biological processes; binding, oxidoreductase, and catalytic activities in molecular functions; and membrane and nucleus in cell components were increased (Fig. S2). The Kyoto Encyclopedia of Genes and Genomes (KEGG) analysis revealed enrichment of pathways such as biosynthesis of cofactors, peroxisome, glutathione metabolism, and ABC transporters, all of which are closely related to metal ion homeostasis (Fig. 1C), indicating that T. hirsuta AH28-2 cells can uptake Cu^2+^ and incorporate Cu²^+^ into cellular processes, in accordance with our recent study and other reports (40, 42, 43). Furthermore, similarly to the response to different concentrations of Cu²^+^ (40), 100 µM Cu²^+^ exposure led to notable increases in the expression levels of many antioxidant enzymes, including glutathione peroxidase (GPX), glutathione transferase (GST), catalase (CAT), superoxide dismutase (SOD), laccases, and some cytochrome P450s (CYP450s) (Fig. S3).
A total of 26 differentially expressed genes/proteins (P value < 0.05) were identified as transcription factors (TFs) potentially involved in the response to Cu^2+^ and laccase expression (Table 1). They encompassed a diverse range of types, including zinc finger proteins (CCHC-type, GATA-type, Zn_2_Cys_6_-type, and C_2_H_2_-type), bHLH, bromodomain, winged helix repressor, homeodomain-like, heat shock, lambda repressor-like, and HMG. These findings suggest that Cu²^+^ may function not only as a cofactor but also as a regulator of global transcriptional responses, thereby contributing to the maintenance of cellular homeostasis. Notably, among the 17 upregulated DEPs, an HSF homolog, GME4084, exhibited a 3.6-fold increase in protein abundance upon Cu²^+^ exposure, ranking second among all DEPs—immediately after GME4300 (Th8421), which has been demonstrated to play a critical role in stress defense mechanisms in T. hirsuta AH28-2 (44)—thereby underscoring its potential significance in the cellular response to Cu²^+^. Together with the observed response stress pattern and the documented role of HSF in responding to Cu^2+^ in white-rot fungi (36), GME4084 may act as a central regulator linking metal sensing to downstream gene expression, including laccase regulation.
GME4084 is a nuclear-localized HSF with DNA-binding capacity and transcriptional activation activity responding to Cu2+ exposure
The genome of T. hirsuta AH28-2 harbored four putative heat shock-type TF genes. Among them, only one gene (GME4084, designated as Thhsf1) exhibited significant and consistent upregulation during the initial 48 h of Cu^2+^exposure, showing a 1.4-fold increase in transcript levels as determined by RNA-seq and a 2.3-fold increase confirmed by qRT-PCR validation (Table 1; Fig. 2A; Fig. S4). This gene encoded a 700-amino acid protein. BLASTP analysis in the NCBI database showed that the closest homolog of ThHSF1 was an HSF-type DNA-binding domain-containing protein from Trametes elegans (Sequence ID: KAI0765634.1), with a sequence identity of 87%. This indicates that ThHSF1 is a conserved HSF-like TF among white-rot fungi. Multiple sequence alignment revealed that the DNA-binding domain (DBD) of ThHSF1 shares 50%, 48.57%, 44.76%, and 45.13% sequence identity with the DBDs of T. trogii TtHSF2 (36), Saccharomyces cerevisiae (GeneBank: CAA96777.1), Triticum aestivum (Gene ID: 123114421), and Homo sapiens (Gene ID: 3297) homologs, respectively (Fig. 2B; Fig. S5). Structural modeling, based on templates from T. trogii HSF2 (36), H. sapiens HSF1 (45), and S. cerevisiae HSF1 (46) indicated that ThHSF1 is predicted to contain three additional characteristic domains: HR-A (393 to 429 aa), HR-B (432 to 476 aa), and a C-terminal transactivation domain (TAD) (555 to 676 aa). The nuclear localization signal (NLS) of ThHSF1, predicted using the NucPred website (47), is located at aa position 183–188 (PRKRSY).
*A nuclear-localized transcription factor ThHSF1 exhibits upregulation in T. hirsuta AH28-2 in response to Cu2+. (A) The transcriptional levels of ThHSF1 increased following copper exposure. Data show mean ± SD, n = 3. **P < 0.001. (B) The amino acid alignment and structural prediction of ThHSF1 are compared to homologs from six other species. TaHSF (Gene ID: 123114421) of T. aestivum L., CcHSF (Gene ID: 6017888) of C. cinerea, TtHSF2 of T. trogii, ScHSF1 (GenBank: CAA96777.1) of S. cerevisiae, KlHSF (GenBank: CAA38950.1) of Kluyveromyces lactis, and HsHSF1 (Gene ID: 3297), HsHSF2 (GenBank: AAA36017.1), and HsHSF4 (GenBank: BAA84581.1) of H. sapiens are concluded. (C) GFP-ThHSF1 was localized in the nucleus. The WT strains, control transformants (EGFP overexpression), and gfp-Thhsf1 overexpressed T. hirsuta AH28-2 transformants were grown on microscope slides with XH agar medium, fixed with cold methanol, and then stained with DAPI. GFP-ThHSF1 is shown in green, and DAPI staining of the nucleus is shown in blue. (D) ThHSF1 specifically bound to lacA promoter in yeast. Experiments were repeated at least three times, and representative results are shown. Scale bars = 10 µm.
The overexpression vector of ThHSF1-GFP was constructed by fusing egfp to the full-length cDNA of ThHSF1 at the C-terminus and under the control of the Agaricus bisporus promoter gapdhII and transformed into T. hirsuta AH28-2 to investigate the subcellular localization of ThHSF1. The positive transformants were confirmed by genomic validation and fluorescence screening. Transformants with only EGFP overexpression were used as controls. Intense GFP fluorescence was predominantly accumulated in the nucleus compared to the wild-type (WT) strain and control transformants (Fig. 2C). Hence, ThHSF1 is mainly a nuclear protein.
Using the lacA promoter as an example, the DNA-binding capacity of ThHSF1 was investigated in S. cerevisiae via the yeast one-hybrid system (25). A 150-bp fragment of the lacA promoter (−1,800 to −1,650 bp) was cloned upstream of the aureobasidin A (AbA) resistance gene AUR1-C in the pAbAi vector and served as the bait DNA. Yeast transformants co-expressing the full-length cDNA of ThHSF1 were able to grow on SD/-Ura/-Leu/AbA^500^ plates (Fig. 2D), indicating specific binding activity. Furthermore, the transcriptional activation activity of ThHSF1 was verified by its ability to activate the lacZ reporter gene upon co-transformation with the modified pRS414 plasmid (48) carrying the full-length lacA promoter and the Escherichia coli lacZ coding sequence. The β-galactosidase (LacZ) activity in the pGADT7-ThHSF1 plasmid co-transformation group was 17.6 ± 3.0 U/mL, which was significantly higher than that of the empty pGADT7 vector control group (3.2 ± 1.3 U/mL; P < 0.001).
Silencing Thhsf1 inT. hirsuta AH28-2 leads to heightened sensitivity toward elevated temperatures and increased Cu2+ stress
The Thhsf1-silenced transformants of T. hirsuta AH28-2 were generated to evaluate the role of ThHSF1 during Cu^2+^ exposure. A total of 33 Thhsf1-silenced transformants were obtained, as confirmed by genomic PCR and qRT-PCR analysis (Fig. S6). Three randomly selected transformants, namely, RThHSF1-20, RThHSF1-24, and RThHSF1-26, exhibited a significant reduction in Thhsf1 transcripts, ranging from 57% to 71% compared to the WT strain after exposure to Cu^2+^ for 48 h. (P < 0.0001; Fig. 3A).
*Silencing Thhsf1 in T. hirsuta AH28-2 leads to heightened sensitivity toward elevated temperatures and increased Cu2+ stress. (A) Thhsf1 expression was downregulated in three randomly chosen transformants. The WT and Thhsf1-silenced T. hirsuta AH28-2 were cultivated in liquid XH medium supplemented with 100 µM CuSO4, harvested every 24 h, and subjected to RNA extraction. The transcriptional level of Thhsf1 in WT at 0 h of induction was set as the baseline. (B) The inhibition rates of strains under an elevated temperature of 37°C. The colony diameters were measured and subjected to statistical analysis. Inhibitory rate = (the diameter of 28°C-cultured strain – the diameter of 37°C-cultured strain)/(the diameter of 28°C-cultured strain) ×100%. (C) The ThHSF1-silenced strains showed increased sensitivity to Cu²+ stress compared to the WT. Growth of strains on XH agar plates supplemented with 100 µM Cu²+ is shown. Experiments were repeated at least three times, and representative results are shown. Data show mean ± SD, n = 3. **P < 0.01, **P < 0.001, and P < 0.0001.
The functional validation of ThHSF1 in vivo was initially conducted by exposing these strains to an elevated temperature of 37°C. In contrast to the phenotype observed during normal growth at 28°C for 7 d, the mycelial growth rate of three Thhsf1-silenced transformants showed greater reductions (48%–53%) than that of the WT strain (25%) (Fig. 3B; Fig. S7), indicating a significant role of ThHSF1 in thermal stress adaptation. In contrast, silencing of ThHSF1 did not exhibit a significant impact on fungal growth under the other stress conditions tested. Exposure to H₂O₂, o-toluidine, or Congo Red did not lead to more pronounced growth inhibition in ThHSF1-silenced strains compared to the wild-type strain, and no substantial differences in colony size or morphology were observed under these conditions, suggesting that the growth defect caused by ThHSF1 silencing is not generally amplified by unrelated stressors and that ThHSF1 is unlikely to function as a general stress response regulator (Fig. S7). However, cultivation of these strains on XH agar plates containing 100 µM Cu^2+^ revealed a changed colony morphology and a curved hyphal morphology among Thhsf1-silenced transformants (Fig. 3C). These findings suggest that ThHSF1 plays a role not only in defense against high-temperature stress but also in response to Cu^2+^ stress in T. hirsuta AH28-2.
ThHSF1 regulates the expressions of LacA, LacB, and LacF, but not LacC
The laccase activity and expression profile were measured in WT and Thhsf1-silenced strains. As shown in Fig. 4A, the total laccase activity decreased from 2,900 U/L to a range of 390–820 U/L upon Cu^2+^ induction after silencing Thhsf1. Native-PAGE analysis revealed a notable reduction in the expressions of LacA, LacB, and LacF in these silenced transformants, while the expression of LacC remained unchanged (Fig. 4B). qRT-PCR results further supported the isozyme expression profile as the transcription levels of lacA, lacB, and lacF were much lower in Thhsf1-silenced transformants compared to the WT strain (Fig. 4C). For instance, Thhsf1 silencing led to a reduction in lacA transcripts by 3.1- to 61.7-fold, lacB transcripts by 2.4- to 93.7-fold, and lacF transcripts by 2.8- to 10.9-fold (P < 0.01 or P < 0.0001). In contrast, Thhsf1 silencing resulted in no noticeable change in the transcription levels of lacC. These results indicated that ThHSF1 functioned in the differential regulation of laccase isozyme transcription.
*ThHSF1 positively regulates the expressions of LacA, LacB, and LacF in response to Cu2+, except for LacC. The total laccase activity (A), laccase isozymes detected by native-PAGE (B), and the transcriptional levels of laccase isozymes (C) in WT and Thhsf1-silenced T. hirsuta AH28-2 are shown. Strains were cultivated in liquid XH medium supplemented with 100 µM CuSO4, harvested every 24 h, centrifuged, and subjected to activity detection and RNA extraction. The transcriptional levels of each gene in the WT strain at 0 h of induction were set as the baseline in each subgraph of C. Experiments were repeated at least three times, and representative results are shown. Data show mean ± SD, n = 3. *P < 0.05, **P < 0.01, and ***P < 0.0001.
ThHSF1 directly binds to the lacA, lacB, and lacF promoters
HDOCK was employed to simulate the three-dimensional (3D) models of either the full-length or DBD of ThHSF1 and the promoters of laccase isozymes (lacA, lacB, and lacF). ThHSF1 DBD exhibited a binding affinity for the DNA fragment containing the conserved CTTGAA sequence in both the lacA promoter (−1,727 to −1,702 bp) and lacB promoter (−1,967 to −1,962 bp) (Fig. 5A; Fig. S8). In comparison, ThHSF1 DBD interacted with the lacF promoter region (−589 to −554 bp), which contains conserved nGAAn sequences.
ThHSF1 binds directly to the promoter regions of lacA, lacB, and lacF. (A) Structure modeling of ThHSF1 interacting with lacA, lacB, and lacF promoters using HDOCK software. The simulated DNA fragments involved in interaction are indicated below each model. The probe sequences derived from the lacA promoter used in EMSA were labeled with pre-mutation sequences highlighted in red and brown, while post-mutation sequences were indicated by blue and green. (B) The ThHSF1 DBD was heterologously expressed in E. coli BL21 and purified. (C–E) EMSA assays showed that ThHSF1 directly bound to the lacA promoter (−1,727 to −1,702 bp) (C), the lacB promoter (–1,979 to –1,944 bp) (D), and the lacF promoter (–589 to –554 bp) (E). Lane assignments: lane 1, probe only; lanes 2–4, probe adding with increasing concentrations of ThHSF1 DBD; lane 5, probe adding with ThHSF1 DBD and specific competitor; lane 6, probe adding with ThHSF1 DBD and non-specific competitor. Poly d(I-C) was added as the non-specific competitor, and a 10-fold identical unlabeled DNA probe was added as the specific competitor. (F, G) EMSA assays exhibited no interaction between ThHSF1 and the lacC promoter. The upstream 2,000-bp promoter region of lacC was divided into two segments, and primers labeled with FAM were used to amplify probes of the first 1,000 bp (F) and the last 1,000 bp (G). (H, I) EMSA assays of DNA binding of ThHSF1 to mutant probes. Experiments were repeated at least three times, and representative results are shown.
EMSA and FP assays were further performed to investigate these interactions in vitro. The ThHSF1 DBD was heterologously expressed in E. coli and purified (Fig. 5B). Three DNA fragments, each containing the binding regions, were labeled with 6-carboxyfluorescein (6-FAM) and used as probes. ThHSF1 was observed to form a chemiluminescent complex with each probe. The poly d(I-C) had no effect on the shifted band, while the addition of a 10-fold excess of nonlabeled DNA fragment hindered complex formation (Fig. 5C through E). FP assays revealed dissociation constants (Kd) of approximately 961 nM, 5,464 nM, and 4,826 nM for ThHSF1 binding to lacA, lacB, and lacF DNA probes, respectively (Fig. S9). In contrast, validation of the two 1,000-bp probes, designed from lacC promoter regions and amplified with FAM-labeled primers, showed no binding to ThHSF1 (Fig. 5F and G).
The 26-bp lacA probe was chosen for mutagenesis to validate the specific binding site in docking models. Both EMSA and FP results conclusively indicated that the core conserved sequence CTTGAA within the lacA promoter region was crucial for ThHSF1 binding (Fig. 5H and I; Fig. S8). Specifically, the binding site in the lacB promoter also exhibited the same conserved motif CTTGAA as lacA. These findings suggested that ThHSF1 differentially regulated the expressions of laccase isozymes by directly interacting with their respective promoter regions.
Co-overexpression of ThHSF1 and ThHspA1 in T. hirsuta AH28-2 significantly enhances the expressions of LacA, LacB, and LacF
The expression profile of ThHspA1, a potent downstream target of HSF (49) and known to be involved in lacA transcription upon o-toluidine induction in T. hirsuta AH28-2 (41), was analyzed. After 24 h of Cu^2+^ treatment, ThhspA1 transcripts decreased by 79%, 90%, and 89% in Thhsf1-silenced transformants compared to the WT strain (Fig. 6A). Western blot analysis showed a significant reduction in ThHspA1 expression after silencing Thhsf1 (Fig. 6B), demonstrating a positive regulatory role of ThHSF1 on ThhspA1. Furthermore, ThHspA1 regulated the expressions of the four Cu^2+^-mediated laccase isozymes as the activities of LacA, LacB, LacC, and LacF were all significantly lower in three *ThhspA1-*silenced transformants (41) compared to the WT strain (Fig. 6C and D, P < 0.01 or P < 0.0001).
*The cooperation of ThHSF1 and ThHspA1 is involved in laccase isozyme regulation in T. hirsuta AH28-2 upon Cu2+ induction. (A, B) The transcriptional level (A) and expression of ThhspA1 (B) were downregulated after silencing Thhsf1. The transcriptional level of ThhspA1 in the WT strain at 0 h of induction was set as the baseline. (C, D) The total laccase activity (C) and expression of four laccase isozymes (D) exhibited a reduction in ThhspA1-silenced transformants compared to the WT strain in response to Cu2+. (E–G) Co-overexpression of ThHSF1/ThHspA1 in T. hirsuta AH28-2 enhanced the total laccase activity (E), expressional levels (F), and transcriptional levels (G) of LacA, LacB, and LacF. ThHSF1 overexpression showed no significant effect. The transcriptional levels of each gene in the WT strain at 24 h of induction were set as the baseline in G. Experiments were repeated at least three times, and representative results are shown. Data show mean ± SD, n = 3. *P < 0.05, **P < 0.01, **P < 0.001, and P < 0.0001.
ThHSF1 overexpression and ThHSF1/ThHspA1 co-overexpression were performed in T. hirsuta AH28-2 to study the cooperation of ThHSF1 and ThHspA1 in regulating laccase isozyme activity. The recombinant transformants were chosen for flask cultivation to detect the laccase production. The total laccase activities of both randomly chosen *Thhsf1-*overexpressing transformants, namely, ThHSF1-1 and ThHSF1-2, were comparable to or slightly higher than those of the WT strain throughout the entire culture period, reaching approximately 2,500 U/L at 144 h. However, the co-transformants OV-1 and OV-2 exhibited significantly higher laccase activity, with levels reaching about 3,700 U/L at 144 h (Fig. 6E). The biomass of these strains was similar. Native-PAGE and qRT-PCR analyses were further conducted to compare the WT, ThHSF1-2, and OV-2 strains. The results indicated a significant increase in the expression and transcriptional levels of LacA, LacB, and LacF in OV-2 compared to WT and ThHSF1-2 (Fig. 6F and G; P < 0.05, P < 0.01, or P < 0.0001). However, overexpression of ThHSF1 or co-overexpression of ThHSF1/ThHspA1 almost did not affect LacC. Thus, ThHSF1 collaborated with ThHspA1 to enhance the expressions of LacA, LacB, and LacF in T. hirsuta AH28-2.
ThHSF1 forms a regulatory complex with ThHspA1 to function in laccase transcription
The full-length proteins of ThHSF1 and ThHspA1 were purified (Fig. 7A), and ITC experiments were conducted to verify their potential interaction. As shown in Fig. 7B, a robust interaction was observed between ThHSF1 and ThHspA1, with a Kd value of approximately 105 nM. Dynamic light scattering (DLS) analysis indicated the formation of a complex between ThHSF1 and ThHspA1, whereas ThHSF1 alone existed as a trimer or tetramer, and ThHspA1 alone presented as a hexamer (41) (Fig. S10). The lacA promoter was further selected to investigate the interactions between these two proteins and DNA. FP assays demonstrated the cooperative binding of ThHSF1 and ThHspA1 to the lacA promoter (Fig. 7C). ThHspA1 alone did not bind to the DNA probe (−1,727 to −1,702 bp), while the addition of ThHspA1 facilitated the formation of a DNA-protein complex with full-length ThHSF1, reducing the Kd from about 1,028 nM to 672.9 nM (Fig. 7C). Subsequently, an amplified DNA probe (−1,727 to −205 bp) was utilized in EMSA experiments due to the binding capability of ThHspA1 with the DNA fragment spanning from −551 to −205 bp within the lacA promoter region (41). Each protein could independently bind to this extended probe (Fig. 7D). Interestingly, there was a noticeable increase in the formation of the DNA-protein complex upon the addition of both proteins, accompanied by a faster migration rate.
ThHSF1 and ThHspA1 form a complex to bind to the lacA promoter. (A) The full-length proteins of ThHSF1 and ThHspA1 were heterologously expressed in E. coli BL21 and purified. (B) The ITC experiment between ThHspA1 and ThHSF1 proteins. (C, D) FP (C) and EMSA (D) assays showed a direct interaction between a mixture of ThHSF1 and ThHspA1 to the lacA promoter (−1,727 to −1,702 bp). The affinity between protein and DNA probe is represented by Kd. Experiments were repeated at least three times, and representative results are shown.
The 3D models of trimeric or monomeric ThHSF1 in complex with ThHspA1 and the DNA probe derived from the lacA promoter (−1,727 to −1,702 bp) were generated using AlphaFold 3 to predict the interaction patterns. As shown in Fig. 8, trimeric ThHSF1 bound to the DNA probe without interacting with ThHspA1. In contrast, monomeric ThHSF1 formed a heterodimeric complex with ThHspA1 to interact with the DNA fragment, with ThHSF1 mediating direct binding, consistent with the EMSA results (Fig. 7C). The DNA sequence specifically recognized by ThHSF1 contained the core conserved motif CTTGAA. In addition, the residues in ThHSF1 bound to DNA included R332, M336, K341, N343, R347, R350, W358, and L381. Overall, these results suggested that ThHSF1 and ThHspA1 exhibited a synergistic effect, forming a regulatory complex to participate in the transcription of LacA in T. hirsuta AH28-2 under Cu^2+^ induction.
The 3D models of trimeric (A) or monomeric (B) ThHSF1 in complex with ThHspA1 and the DNA probe. The DNA probe was derived from the lacA promoter (−1,727 to −1,702 bp). A 1:1 ThHSF1–ThHspA1 complex was used in B.
DISCUSSION
The laccase gene family in white-rot fungi typically encodes multiple laccase isozymes, exhibiting notably distinct expression patterns under various environmental pressures (50). Cu^2+^, as an essential micronutrient, plays a crucial role in numerous physiological processes across cell types (51). Increased laccase expression associated with intracellular Cu^2+^ accumulation has been observed in many white-rot fungi (24, 36). However, the mechanisms by which fungi respond to Cu^2+^ stress and transmit intracellular signals to initiate differential expression of laccase isozymes remain unclear. This study revealed a Cu²^+^-responsive regulatory mechanism underlying differential laccase isozyme expression in T. hirsuta.
According to the native-PAGE analysis (Fig. 4B; Fig. S1), laccase isozyme LacF, along with LacA and LacB, was induced for overexpression following copper exposure. Furthermore, unlike the gradually increasing expression patterns of LacA and LacB in response to Cu^2+^ concentration, the expression level of LacC reached its peak at 100 µM Cu^2+^ and remained stable, while that of LacF peaked at 100–200 µM Cu^2+^ before declining (Fig. S1). To further explore the regulatory basis of these differences, we first examined the global transcriptomic and proteomic responses of T. hirsuta to Cu²^+^ stress. Our comparative omics analysis covered 1,682 DEGs and 1,128 DEPs, but only 231 showed consistent changes at both transcript and protein levels (Fig. 1B). This limited overlap indicates a generally weak correlation between the transcriptome and proteome, a pattern commonly observed in fungi and other eukaryotes (52, 53). Such divergence reflects multiple layers of regulation beyond transcription, including differences in mRNA stability, translational efficiency, protein turnover, and stress-induced post-translational modifications. In T. hirsuta, copper exposure may further amplify these discrepancies by selectively enhancing the synthesis or stability of proteins involved in oxidative stress defense, metal binding, and molecular chaperones, which are not necessarily mirrored at the transcriptional level. These findings highlight the importance of integrating transcriptomic and proteomic analyses to fully understand fungal responses to metal stress.
HSF is activated when cells are confronted with some environmental stressors, regulating the expressions of various antioxidant stress genes to protect cells from oxidative damage (54). In T. trogii and P. sojae, HSF is a confirmed key regulator of laccase expression, with overexpression or silencing of TtHSF2 and PsHSF1 resulting in varying effects on laccase production (29, 36). Here, we identified a nuclear-localized homologous protein of HSF in T. hirsuta AH28-2, sharing up to 45% identity in the DBD region with HSFs from different species (Fig. 2). According to the in vivo and in vitro experiments, ThHSF1 functioned as a Cu^2+^-responsive transcription factor regulating the expressions of laccase isozymes LacA, LacB, and LacF, but not LacC. Although LacC responded to Cu^2+^ stress, its regulation might be mediated by other transcription factors rather than HSF. In fact, multiple intricate transcriptional regulators within cells control the expression of genes involved in stress response (45, 55, 56). For instance, many fungi harbor three orthologs containing HSF domains, namely, Hsf1, Sfl1, and Skn7. These proteins exhibit overlapping or opposing roles in activating various families of hsp genes and mediating the differential expression of genes required for development and intracellular homeostasis (57).
HSF typically functions by binding to the HSE element located in the promoters of target genes (58). In eukaryotes, the typical HSE comprises conserved repeats of nGAAn pentanucleotides, which are classified into four types based on the number of repeats and the spacing between them: 4P-type, 3P-type, Gap-type, and Step-type (33). However, the binding sequence in the lacA promoter region deviated from these typical HSF binding models and instead revealed a novel hexanucleotide sequence, CTTGAA. Mutation assays through EMSA and FP experiments demonstrated that single-point or complete mutations in either GAA or CTT significantly weakened or abolished ThHSF1’s binding to the probes (Fig. 5H and I; Fig. S8). Conversely, ThHSF1 bound to the lacF promoter in a manner similar to the Gap-type model. This might also account for the inability of ThHSF1 to bind to the lacC promoter as no matching sequences for any scenario were identified within lacC’s 2,000-bp promoter region. Interestingly, most hypothesized HSE elements found upstream of laccase genes in white-rot fungi do not conform to any of these four typical types (11). Notably though, the HSE element in the laccase gene promoter of P. ostreatus resembles the binding motif CTTGAA that we discovered here (59).
The relationship between HSF and Hsp70 proteins follows a classic upstream-downstream pattern, with HSF initiating the expression of Hsp70. Moreover, the interaction mechanism between these two proteins has also been gradually elucidated (35, 60, 61). In various species, including Arabidopsis, humans, and yeast, Hsp70 acts as a negative feedback regulator by interacting with HSF to inhibit its activity (60, 61). Furthermore, the tight regulation of HSF transcriptional activity is crucial for cellular fitness and maintaining proteostasis. This was demonstrated in yeast, where global dysregulation of hsf1 transcriptional activity occurred upon the removal of Hsp70 regulation (62, 63). In T. hirsuta AH28-2, we confirmed that ThHSF1 and the Hsp70 homolog ThHspA1 could form a regulatory complex involved in the differential transcription of laccase isozymes. ThHspA1 might function as a co-activator as it was capable of binding to the lacA promoter alone; however, when mixed with ThHSF1 at a 1:1 molar ratio and incubated with the DNA, it did not participate in direct DNA interaction. The 3D modeling of the lacA promoter DNA fragment (−1,727 to −205 bp) in complex with ThHSF1 and ThHspA1 generated similar results (Fig. S11). Nevertheless, the precise assembly architecture of the heterocomplex remained uncertain due to the undefined stoichiometry ratio of the two proteins in vivo, which warrants future investigation. The synergistic effects of ThHSF1 and ThHspA1 resembled the coregulation of HSF and Ssa1 observed in C. neoformans (35). These results also explained our previous finding that sole overexpression of ThHspA1 led to no significant enhancement in LacA production (41). Additionally, considering that Hsp70 plays a crucial role as a molecular chaperone in facilitating peptide folding, refolding damaged protein, and responding to stress within cells (64, 65), it is possible that post-translational activities executed by ThHspA1 are involved in regulating laccase expression.
In summary, under Cu^2+^ stress, four upregulated laccase isozymes were observed in T. hirsuta AH28-2, along with the discovery of a Cu^2+^-responsive transcription factor, ThHSF1. ThHSF1 is selectively bound to the upstream promoter regions of the laccase gene family through specific sequences, thereby differentially regulating the expressions of laccase isozymes in response to copper stress. Furthermore, ThHspA1 cooperated with ThHSF1 to function in the differential regulation of laccase transcription, providing an efficient strategy to enhance laccase production through strain engineering.
MATERIALS AND METHODS
Fungal strains and cultivation conditions
T. hirsuta AH28-2 (CCTCC No. AF 2015027, China Center for Type Culture Collection) was sustained on compound potato dextrose agar (CPDA) plates as previously reported (25). The XH medium, with the following composition per liter—15 g cellobiose, 1 g peptone, 1.5 g DL-asparagine, 0.1 g Na_2_HPO_4_, 1 g KH_2_PO_4_, 0.5 g MgSO_4_∙7H_2_O, 0.01 g CaCl_2_, 1 mg FeSO_4_∙7H_2_O, 28 mg adenine, 0.05 mg vitamin B1, and 2 mg CuSO_4_∙7H_2_O—was employed for its liquid cultivation (25). CuSO_4_ was added as necessary at a final concentration of 50, 100, 200, 250, 500, or 1,000 μM.
Liquid cultivation
Six actively growing blocks of T. hirsuta AH28-2 (5 mm in diameter) from the CPDA plates were inoculated into liquid XH medium and maintained with continuous shaking at 120 rpm in the dark for a duration of 96 h. Following homogenization, the primary cultures (5%, vol/vol) were transferred into 100 mL of freshly prepared XH medium. Subsequently, they were pre-cultured with agitation at 120 rpm for 72 h before the addition of different concentrations of CuSO_4_ (41). The addition of CuSO_4_ was designated as the starting point (0 h) for induction. Control cultures were set up without the addition of extra agents. The experiments were conducted thrice, each time with triplicate cultures per test case.
One batch of fresh mycelial cultures of the T. hirsuta AH28-2 WT strain exposed to 100 µM Cu²^+^ was randomly selected, and three independent biological replicates were harvested. Each replicate culture was divided into two aliquots: one aliquot was immediately frozen in liquid nitrogen for total RNA extraction and transcriptomic analysis, and the other was subjected to protein extraction and proteomic analysis.
Transcriptomic analysis
Total RNA was extracted using the TRIzol reagent kit (Tiangen Biotech, Beijing, China). RNA quality and concentration were assessed with a NanoDrop 2000 (NanoDrop Technologies, Inc., Wilmington, DE, USA) and through 1% agarose gel electrophoresis analyzed by the Agilent 2100 Bioanalyzer (Agilent Technologies, Santa Clara, CA, USA). RNA libraries were prepared with poly(A)-selection, cDNA synthesis, adenylation of 3' ends, adapter ligation, DNA fragment enrichment, and purification, followed by sequencing on the Illumina HiSeq 2500 platform at Novogene Bioinformatics Technology Co., Ltd (Beijing, China).
Low-quality reads (quality value ≤20), adapter contamination, and high unknown base content were removed before de novo transcriptome assembly with Trinity (66). Gene expression levels were estimated using HTSeq v0.6.0 and Reads Per Kilobase Million Mapped Reads (RPKM) (67). Differential gene expression was analyzed with DESeq2, identifying genes with an FDR below 0.05, and an absolute fold change ≥1 as DEGs (68). The GO enrichment analysis of DEGs utilized the hypergeometric test, considering a q value < 0.05 as significant. DEGs were annotated in the KEGG database for pathway enrichment analysis, with significantly enriched pathways identified based on a corrected P-value (Q-value) ≤0.05 (69).
Proteomic analysis
Mycelia were collected and lysed with SDT buffer (4% SDS, 100 mM Tris-HCl, 1 mM DTT, pH 7.6). Mycelia without CuSO_4_ were used as the control. The ultrafiltration process was performed using 10 kDa tubes with UA buffer (8 M urea, 150 mM Tris-HCl, pH 8.0) to remove detergent and small molecules effectively. Cysteine residues were alkylated by iodoacetamide in UA buffer, followed by incubation in the dark. The filters were then washed both with UA buffer and NH_4_HCO_3_ buffer. Protein concentration was determined using the BCA assay. For protein digestion, trypsin was used following the filter-aided sample preparation (FASP) protocol (70). Peptides were desalted using C18 cartridges (Empore SPE Cartridges C18, Sigma, USA), concentrated, reconstituted in formic acid, and assessed at a wavelength of 280 nm. Finally, the peptides were separated by SDS-PAGE and visualized with Coomassie Blue.
Samples were analyzed on an EASY-Spray C18 LC column (Thermo Fisher Scientific) and Q Exactive mass spectrometer (Thermo Fisher Scientific). Each sample (10 µL) was separated using a gradient of mobile phases A (water and formic acid) and B (acetonitrile and formic acid) over 126 min. Protein identification and quantification were performed using MaxQuant software (version 1.5.3.17). DEPs were identified with Fisher’s exact test (P-value < 0.05, fold change >2.0 or <0.5). GO annotations were predicted using Blast2GO (https://www.blast2go.com/), biological pathways using the KEGG database (http://www.genome.jp/kegg/), and TFs by comparing UniProt IDs with Fungal TFDB1.2 (http://ftfd.snu.ac.kr/index.php?a=view).
Overlap statistics
Genes and proteins were mapped via one-to-one gene identifiers. Differential features were combined to identify gene–protein pairs with differential regulation in either direction. The expected overlap under independence was computed as μ = n_DEG × n_DEP / N, where N is the total number of detected transcripts (N = 10,984 in this study). Significance was evaluated using a hypergeometric test (two-sided) with a confirmatory Fisher’s exact test. Direction-specific counts (up/up, down/down, up/down, and down/up) are shown in Table S1.
Total laccase enzymatic activity assay and native-PAGE analysis
Laccase activity was assessed by employing guaiacol as the substrate, according to 71. Standard protocol was followed for the analysis of native-PAGE on 10% polyacrylamide gels. The gels were submerged in a solution containing 100 mM citrate-phosphate buffer (pH 4.0) and 15 mM 2,2-azino-bis(3-ethylbenzothiazoline-6-sulfonate) (ABTS) at 25°C for approximately 0.5 h, as described in 72.
qRT-PCR analysis
T. hirsuta AH28-2 strains were cultured continuously in liquid XH media for 0, 24, and 48 h to harvest the mycelia. Subsequently, cDNA synthesis was performed using 1 μg of total RNA as the template, following the protocol provided with the PrimeScript RT kit (Takara). The transcriptional levels of target genes (Thhsf1, ThhspA1, lacA, lacB, lacC, and lacF) were assessed using qRT-PCR with a SYBR green kit (TaKaRa) on a LightCycler 96 real-time PCR system (Roche, Basel, Switzerland). The specific primers for the above target genes are shown in Table S2. The glyceraldehyde-3-phosphate dehydrogenase (gapdh) gene served as a constitutively expressed endogenous control (25), and the 2^-ΔΔCT^ method was applied to calculate the relative expression level (73).
Construction of plasmids and transformation of T. hirsuta AH28-2
The construction of the ThHSF1 silencing vector pYSK7-anThhsf1 (Fig. S6) and overexpression vectors pYSK7-gfp-Thhsf1 and pYSK7-Thhsf1 followed the established protocol using the recombinant plasmid pYSK7, as detailed described by Liu et al (74). The amplification of a 251-bp antisense fragment of Thhsf1 cDNA (from 531 to 781 bp) and a 2,103-bp full-length cDNA of Thhsf1 was performed using the primer pairs listed in Table S2. Moreover, through overlapping extension PCR and linkage with a linker, a segment of the 2,781-\bp gfp-Thhsf1 sequence was successfully amplified for the construction of the pYSK7-gfp-Thhsf1 vector. Either fragment was integrated into the pYSK7 plasmid downstream of the Agaricus bisporus gpdII promoter via homologous recombination in S. cerevisiae Y1H.
The spores of T. hirsuta AH28-2 were harvested, subjected to enzymatic treatment to generate protoplasts, and co-transformed with either of the above three vectors along with the plasmid pCRII-hph using the PEG/CaCl_2_ method (41). For ThHspA1 and ThHSF1 co-overexpression, two vectors, including pYSK7-Thhsf1 and pCRII-hph-ThhspA1 (41), were co-transformed. The positive transformants were screened through resistance to hygromycin B, followed by genomic PCR amplification using primers L22 and L24 (Table S2). Two or three gene-silenced or overexpressed transformants were randomly selected, and their transcription levels of Thhsf1, lacA, lacB, lacC, and lacF were determined by qRT-PCR. Simultaneously, the laccase activity and growth phenotype were also analyzed.
Localization of ThHSF1 inT. hirsuta AH28-2
The mycelia of the positive gfp-Thhsf1-overexpressed transformant were inoculated into an XH solid medium with or without 100 µM CuSO_4_ addition. Following that, the hyphae were treated with cold methanol, stained with 2 mg/mL DAPI for 5 min in darkness, and images were captured using a laser confocal microscope (Olympus, Japan). The experiments were replicated at least three times.
Verification of the DNA-binding capacity and transcriptional activation activity of ThHSF1 in S. cerevisiae
A DNA bait fragment spanning the lacA promoter region (−1,800 to −1,650 bp) was amplified using the primer pair Bait-F and Bait-R (Table S2) and cloned into the pAbAi vector (Clontech), which carries the AbA resistance gene AUR1-C, via SacI and SalI restriction sites to generate the reporter plasmid pAbAi-Bait. This plasmid was subsequently integrated into the S. cerevisiae Y1H genome. As a negative control, the pAbAi plasmid (Takara) was independently incorporated into the Y1H genome to construct the Y1H-pAbAi strain. The pGADT7-ThHSF1 plasmid, containing the full-length cDNA of ThHSF1, was constructed and co-transformed into both the Y1H-Bait reporter strain and the Y1H-pAbAi control strain. Additionally, pGADT7-RecA (Takara) was used as a positive control. Transformation was serially diluted, titrated (5 µL) on SD/-Ura/-Leu or SD/-Ura/-Leu/AbA^500^ plates, and incubated at 30°C for 3 d (25). A null control was included by transforming the empty pGADT7 vector into the Y1H-Bait reporter strain.
The full-length lacA promoter was amplified using the primer pair PlacA-F and PlacA-R (Table S2) and inserted upstream of the Escherichia coli lacZ coding sequence in the modified pRS414 plasmid (48) via fusion extension PCR to generate the plasmid pRS414-P_lacA_. This plasmid was co-transformed with the above pGADT7-ThHSF1 plasmid into yeast strain Y187 to validate the transcriptional activation activity of ThHSF1. As a negative control, the empty pGADT7 vector was co-transformed with pRS414-P_lacA_ under the same conditions. LacZ activity of the transformants was determined by measuring the amount of p-nitrophenol released from the substrate p-nitrophenyl-β-D-cellobioside (pNPG; Merck).
Mycelial morphology and growth inhibition rate assay
The WT strain of T. hirsuta AH28-2 and three positive Thhsf1 silencing transformants were inoculated on CPDA solid medium and cultured in the dark at the optimal temperature of 28°C with or without 100 µM CuSO_4_ addition or under elevated temperature conditions at 37°C for 7 d. Subsequently, all colonies from three parallel agar plates were photographed, and the hyphae of T. hirsuta AH28-2 were then observed under a ZEISS AXIO Scope A1 microscope (ZEISS, Oberkochen, Germany). Images were captured with an Axiocam 506 color digital camera (Zeiss) under bright-field illumination and processed with Adobe Photoshop 7.0 software (Adobe Inc., San Jose, CA).
Molecular docking simulations
The full-length and DBD of ThHSF1 were individually docked with the promoters of lacA, lacB, lacC, or lacF using the HDOCK Server website (http://hdock.phys.hust.edu.cn/). This docking simulation utilized a hybrid algorithm combining template-based modeling and ab initio free docking (75). Protein 3D structures were modeled using AlphaFold 3 via the AlphaFold server: (i) trimeric ThHSF1 bound to the DNA fragment of the lacA promoter (−1,727 to −1,702 bp), with ThHspA1 included to assess steric compatibility, and (ii) a 1:1 ThHSF1–ThHspA1 complex bound to the same DNA fragment. The results were visualized using the Pymol software (version 2.5.2). These fragments were employed for probe synthesis for in vitro experimental validations.
Heterologous expression and purification of full-length ThHSF1 andThHSF1 DBD
Thhsf1 full-length cDNA and Thhsf1 DBD cDNA fragments were amplified with specific primers (Table S2) and inserted into the pET28a (+) and pET28a-SUMO (+) vectors, generating pET28a-Thhsf1 and pET28a-SUMO-Thhsf1-DBD constructs, respectively. Both of the recombinant plasmids were transformed into E. coli BL21 (DE3) for protein expression. Following the induction with isopropyl-β-d-thiogalactopyranoside (IPTG) at a final concentration of 1 mM, the engineered cells were incubated at 16°C for 20—22 h. The cells were lysed using sonication in a cold Tris buffer (40 mM, pH 7.5) supplemented with 500 mM NaCl. The purified recombinant proteins were obtained via affinity chromatography on Ni-NTA Resin (Novagen, Darmstadt, Germany). The SUMO tag was removed through enzymatic cleavage using the ULP enzyme (856087). SDS-PAGE and Bradford analysis were performed to assess the purity and the concentration of the protein, respectively. Additionally, the expression and purification of the full-length ThHspA1 were referenced from 41.
EMSA
All DNA probes, including DNA fragments of the lacA promoter (–1,656 to –1,631 bp; –1,727 to –205 bp), lacB promoter (–1,979 to –1,944 bp), lacC promoter (–2,000 to –1,000 bp; –1,000 to –50 bp), lacF promoter (–589 to –554 bp), and six mutant DNA fragments of the lacA promoter, were synthesized or amplified, and labeled with 6-FAM at the 5' terminus (Sangon Biotech). In a total reaction volume of 20 µL, 100 nM probes were subjected to incubation with varying concentrations of purified ThHSF1 DBD in 5 × binding buffer (pH 6.8) containing 25 mM HEPES, 5 mM MgCl_2_, 150 mM KCl, 1 mM DTT, and 5% glycerol (vol/vol) at 16°C for 30 min. Moreover, to validate specific binding, Polyd(I-C) and a 10-fold concentration of unlabeled DNA without the FAM tag were introduced into the reaction system as a nonspecific competitor and a cold competitive probe, respectively. Following incubation at 37°C for 30 min, the mixtures were separated on 6% native-PAGE (25). The 6-FAM-labeled DNA bands were visualized in the gels using a chemiluminescence imager (Smart Chemi 610; Sagecreation, Beijing, China).
FP assay
Serial dilutions of purified full-length ThHSF1, ThHSF1 DBD, and full-length ThHspA1 were prepared. The reaction mixtures, each comprising 200 µL, consisted of various FAM-labeled DNA fluorescence probes (DNA fragments of lacA, lacB, lacF promoters, and mutant1—mutant6) at a final concentration of 50 nM, different concentrations of the three proteins, and 5 × binding buffer. Incubation was carried out at 37°C for 30 min. Fluorescence data were collected using a SpectraMax M5 instrument (Molecular Devices; San Jose, USA) with excitation and emission wavelengths of 285 nm and 535 nm, respectively. The dissociation constants (Kd) were calculated as previously reported using GraphPad (41).
Western blot
Fresh fungal hyphae were harvested and thoroughly ground using liquid nitrogen. Subsequently, 0.1 g of the powder was added with 200 mL of protein extraction buffer (10 mM Tris-HCl, 0.02% NaN_3_, and 0.001% phenylmethylsulfonyl fluoride, pH 8.0), followed by centrifuging to obtain the supernatant for loading (76). Primary antibodies included anti-ThHspA1 polyclonal antibody (GeneScript, Nanjing, China; dilution at 1:5,000) and anti-β-actin (Abclonal, Wuhan, China; dilution at 1:20,000). The secondary antibody was horseradish peroxidase (HRP) goat anti-rabbit IgG (H + L) (Abclonal) at a dilution of 1:8,000. In the end, a BeyoECL Plus Kit (P0018S; Beyotime) was employed for autoradiography.
Isothermal titration calorimetry (ITC) assay
ITC experiments were conducted to investigate the interactions between ThHSF1 and ThHspA1 using the iTC200 microcalorimetry system (GE Healthcare) at 25°C. These two proteins were diluted in the same Tris buffer (50 mM Tris, 500 mM NaCl, pH 7.5), with a final concentration of 1 µM for ThHSF1 and 5 µM for ThHspA1. ThHspA1 was then titrated against ThHSF1. In each titration, an initial injection of 0.5 µL was followed by successive additions of 2 µL, carried out in 5 second intervals with a total duration of 120 s.
Statistical analyses
GraphPad Prism (v9.0) was used for statistical analysis of experimental data by one-way ANOVA and Student’s t-test, and the significance level was set at 0.05 (P ≤ 0.05, P ≤ 0.01, P ≤ 0.001, or P ≤ 0.0001) among samples.
The reference list from the paper itself. Each links out to its DOI / PubMed record.
- 1Janusz G, Pawlik A, Świderska-Burek U, Polak J, Sulej J, Jarosz-Wilkołazka A, Paszczyński A. 2020. Laccase properties, physiological functions, and evolution. Int J Mol Sci 21:966. doi:10.3390/ijms 2103096632024019 PMC 7036934 · doi ↗ · pubmed ↗
- 2Bai Y, Ali S, Liu S, Zhou J, Tang Y. 2023. Characterization of plant laccase genes and their functions. Gene 852:147060. doi:10.1016/j.gene.2022.14706036423777 · doi ↗ · pubmed ↗
- 3Xiao J, Zhang S, Chen G. 2020. Mechanisms of lignin-degrading enzymes. PPL 27:574–581. doi:10.2174/092986652766619122314175631868142 · doi ↗ · pubmed ↗
- 4Deng W, Zhao W, Yang Y. 2022. Degradation and detoxification of chlorophenols with different structure by LAC-4 laccase purified from white-rot fungus Ganoderma lucidum. IJERPH 19:8150. doi:10.3390/ijerph 1913815035805809 PMC 9266351 · doi ↗ · pubmed ↗
- 5Armas-Tizapantzi A, Martínez y Pérez JL, Fernández FJ, Mata G, Hernández-Cuevas LV, Ortiz Ortiz E, García Nieto E, Tomasini A, Sierra-Palacios E, Marcial-Quino J, Montiel-González AM. 2023. Silencing of the laccase (lacc 2) gene from Pleurotus ostreatus causes important effects on the formation of toxocyst-like structures and fruiting body. IJMS 24:8143. doi:10.3390/ijms 2409814337175859 PMC 10179115 · doi ↗ · pubmed ↗
- 6Su J, Fu J, Wang Q, Silva C, Cavaco-Paulo A. 2018. Laccase: a green catalyst for the biosynthesis of poly-phenols. Crit Rev Biotechnol 38:294–307. doi:10.1080/07388551.2017.135435328738694 · doi ↗ · pubmed ↗
- 7Singh G, Arya SK. 2019. Utility of laccase in pulp and paper industry: a progressive step towards the green technology. Int J Biol Macromol 134:1070–1084. doi:10.1016/j.ijbiomac.2019.05.16831129205 · doi ↗ · pubmed ↗
- 8Dong C-D, Tiwari A, Anisha GS, Chen C-W, Singh A, Haldar D, Patel AK, Singhania RR. 2023. Laccase: a potential biocatalyst for pollutant degradation. Environ Pollut 319:120999. doi:10.1016/j.envpol.2023.12099936608728 · doi ↗ · pubmed ↗