Deciphering strain differences in codY regulation of Clostridioides difficiles sporulation
Marcos P. Monteiro, Adrianne N. Edwards, Michael A. DiCandia, Shonna M. McBride

TL;DR
This study explores how CodY, a nutrient-sensing regulator, affects spore formation in two strains of Clostridioides difficile, revealing strain-specific differences in gene regulation.
Contribution
The study identifies CodY-regulated factors influencing sporulation and highlights differences in CodY regulation between two C. difficile strains.
Findings
CodY suppresses premature spore formation in both 630∆erm and UK1 strains.
CodY-dependent gene expression differs between the 630∆erm and UK1 strains.
CRISPRi knockdowns revealed multiple CodY-regulated factors impacting sporulation.
Abstract
Clostridioides difficile is an anaerobic, spore-forming pathogen that causes diarrhea, colitis, and even death. C. difficile grows and replicates in the intestine as a vegetative bacillus, but must transition into a dormant spore to survive and transmit in the environment. The transformation into a spore is a complex developmental process that is regulated in response to conditions within the host, most notably nutrient limitation. Nutrient availability is sensed by C. difficile through transcriptional regulators, such as CodY. CodY is a global nutritional gene regulator that controls gene expression in response to branched-chain amino acids (BCAAs) and guanosine-triphosphate (GTP). It was previously observed that CodY represses C. difficile sporulation, but the impact of CodY on sporulation has differed considerably by strain. Here, we investigated the effects of CodY on gene…
Genes, proteins, chemicals, diseases, species, mutations and cell lines named across the full text — each resolved to its canonical identifier and authoritative record.
Click any figure to enlarge with its caption.
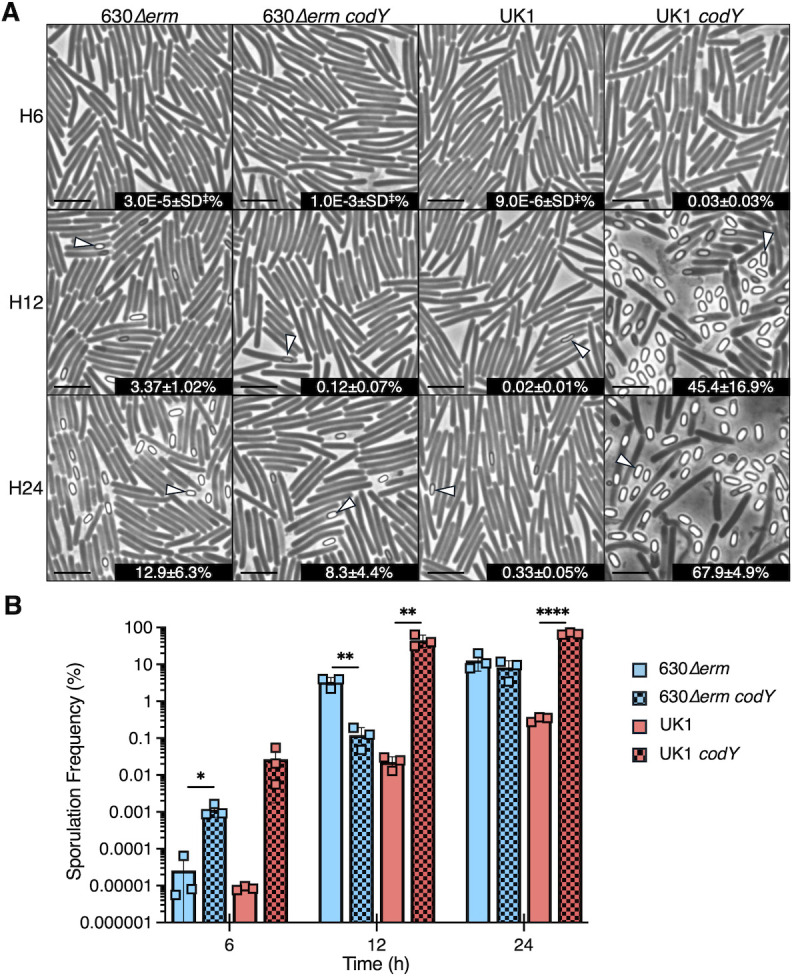 Fig 1
Fig 1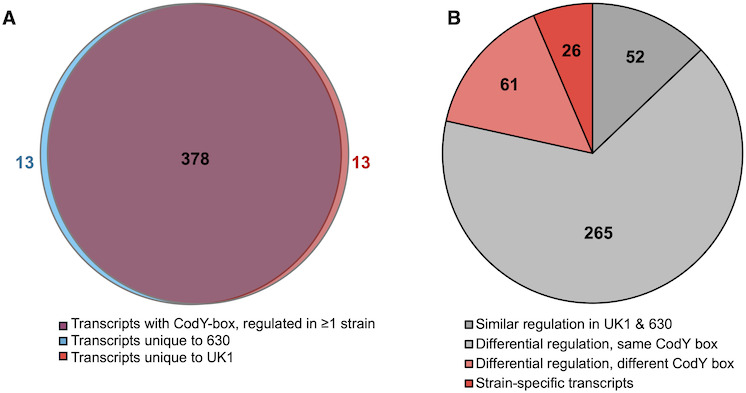 Fig 2
Fig 2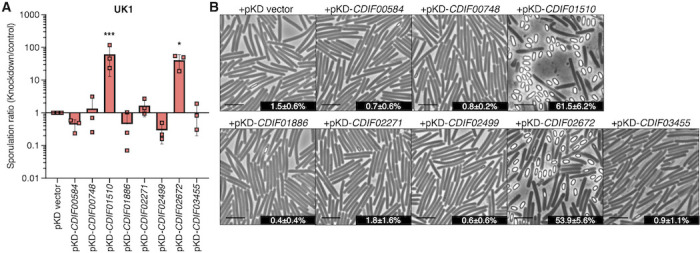 Fig 3
Fig 3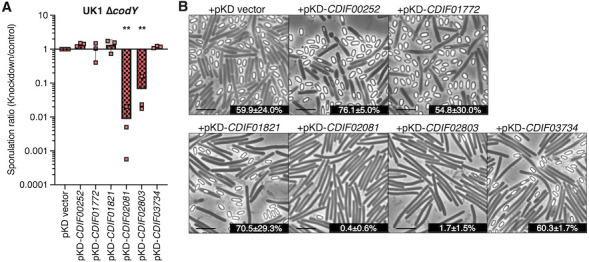 Fig 4
Fig 4| UK1 | 630∆ | ||||||||
|---|---|---|---|---|---|---|---|---|---|
| Genetic region | Predicted CodY box | Predicted CodY target | ∆codY/WT | Genetic region | Predicted CodY box | Predicted CodY target | ∆ | Gene names | Putative function |
| CDIF27147_00336-00337 | CDIF27147_00336-00337 | 16.5–18.3 | CD02130-02140 | CD02130-02140 | 1.43–1.77 | Sporulation | |||
| CDIF27147_00351-00353 |
| CDIF27147_00352-00353 | 0.23–0.28 | CD02260-02280 |
| CD02270-02280 | 1.57–4.41 |
| Motility |
| CDIF27147_00374-00397 | CDIF27147_00382-00397 | 0.39–0.95 | CD02450-02630 | CD02670 | 1.21–4.13 |
| Motility | ||
| CDIF27147_00476-00478 |
| CDIF27147_00478 | 1.30–3.28 | CD03350-03370 |
| CD03370 | 0.59–8.06 | Unknown | |
| CDIF27147_00481-00482 | CDIF27147_00481-00482 | 0.24–0.27 | CD03400-03410 | CD03400-03410 | 1.43–1.62 | Unknown | |||
| CDIF27147_00526-00530 |
| CDIF27147_00526-00530 | 10.05–23.88 | CD04450-04490 |
| CD04450-04490 | 0.93–1.34 |
| Amino acid |
| CDIF27147_00566-00567 | CDIF27147_00566 | 1.12–6.02 | CD04830-04840 | CD04830 | 1.38–1.45 | Transporter | |||
| CDIF27147_00618 | CDIF27147_00618 | 8.64 | CD05500 | CD05500 | 1.08 | Unknown | |||
| CDIF27147_00723-00725 | CDIF27147_00723-00725 | 2.10–4.13 | CD06490-06510 | CD06490-06510 | 1.01–1.10 | Peptidases | |||
| CDIF27147_00734-00738 | CDIF27147_00734-00738 | 49.0–259.4 | CD06590-06630 | CD06590-06630 | 5.02–436.3 |
| Toxin | ||
| CDIF27147_00739 |
| CDIF27147_00739 | 33.2 | CD06640 |
| CD06640 | 5.81 |
| Toxin |
| CDIF27147_00772 |
| CDIF27147_00772 | 10.3 | CD06910 |
| CD06910 | 0.43 | Metabolism | |
| CDIF27147_00939-00943 | CDIF27147_00939-00943 | 0.23–0.53 | CD08530-08560 | CD08530 | 0.58–1.12 |
| Metabolite transporter | ||
| CDIF27147_00947-00949 | CDIF27147_00948-00949 | 1.23–2.12 | CD08610-08630 | CD08620-08630 | 0.27–0.79 | Metabolite transporter | |||
| CDIF27147_00969-00973 | CDIF27147_00969-00973 | 4.92–6.74 | CD08820-08860 | CD08820-08860 | 1.65–2.48 |
| Metabolism | ||
| CDIF27147_01044-01045 | CDIF27147_01044-01045 | 3.67–20.0 | CD10280-10290 | CD10280-10290 | 0.49–1.06 | Signaling | |||
| CDIF27147_01075 | CDIF27147_01075 | 0.23 | CD10540 | CD10540 | 0.5 |
| Metabolism | ||
| CDIF27147_01249 | 0.89 | CD12380 |
| CD12380 | 4.19 | Unknown | |||
| CDIF27147_01280-012820 | CDIF27147_01280-012820 | 0.64–0.80 | CD12660-12680 | CD12660-12670 | 2.04–3.21 | Transporter | |||
| CDIF27147_01285-01288 | CDIF27147_01285-01288 | 3.36–8.81 | CD12710- 12740 | CD1273-12740 | 0.25–1.10 |
| DNA processing | ||
| CDIF27147_01432 | CDIF27147_01432 | 0.29 | CD14120 | CD14120 | 1.16 | Transcription regulation | |||
| CDIF27147_01501 |
| CDIF27147_01501 | 0.28 | CD14750 |
| CD14750 | 0.54 | Unknown | |
| CDIF27147_01665 | 49.8 | CD15670 |
| CD15670 | 1.01 |
| Sporulation | ||
| CDIF27147_01721 | CDIF27147_01721 | 0.30 | CD16160 | CD16160 | 1.29 | Signaling | |||
| CDIF27147_01737 |
| CDIF27147_01737 | 28.1 | CD16310 |
| CD16310 | 0.59 |
| Metabolism |
| CDIF27147_01805-01806 |
| CDIF27147_01805-01806 | 0.88–1.67 | CD16940-16950 | CD16940-16950 | 0.23–0.71 | Unknown | ||
| CDIF27147_01855-01856 |
| CDIF27147_01855-01856 | 6.03–6.48 | CD17400-17410 |
| CD17400-17410 | 0.55 |
| Metabolism |
| CDIF27147_01886 | CDIF27147_01886 | 0.02 | CD17671-17680 | CD17671-17680 | 0.09–0.11 | Unknown | |||
| CDIF27147_01913 |
| CDIF27147_01913 | 4.77 | CD17930 |
| CD17930 | 0.52 | Unknown | |
| CDIF27147_01965 | CDIF27147_01965 | 8.23 | CD18440 | CD18440 | 1.02 | Unknown | |||
| CDIF27147_02022-02023 | CDIF27147_02022-02023 | 4.15–6.48 | CD18620-18630 |
| CD18620-18630 | 0.35–0.58 | Conjugative Transposon | ||
| CDIF27147_02031 |
| CDIF27147_02031 | 0.11 | CD18710 |
| CD18710 | 0.55 | Conjugative transposon | |
| CDIF27147_02062-02067 | CDIF27147_02062-02067 | 16.8–22.8 | CD19120-19170 | CD19120-19170 | 0.18–0.42 |
| Metabolism | ||
| CDIF27147_02068 |
| CDIF27147_02068 | 67.5 | CD19180 |
| CD19180 | 0.31 |
| Metabolism |
| CDIF27147_02170 |
| CDIF27147_02170 | 321.8 | CD20000 | 0.12 |
| Metabolism | ||
| CDIF27147_02368 | CDIF27147_02368 | 33.3 | CD22010 | CD22010 | 7.11 | Transporter | |||
| CDIF27147_02391-02392 |
| CDIF27147_02391-02392 | 2.25–3.91 | CD22310-22330 |
| CD22310-22330 | 0.95–1.35 |
| Redox |
| CDIF27147_02414 | CDIF27147_02414 | 0.64 | CD22520 | CD22520 | 5.93 |
| Metabolism | ||
| CDIF27147_02424 | CDIF27147_02424 | 0.06 | CD22630 | CD22630 | 1.89 |
| Metabolism | ||
| CDIF27147_02479-02480 |
| CDIF27147_02479-02480 | 0.63–0.75 | CD23260-23270 |
| CD23260-23270 | 3.89–4.50 |
| Metabolism |
| CDIF27147_02545-02546 | CDIF27147_02545-02546 | 0.37–0.36 | CD23880-23900 | CD23880-23890 | 1.18–3.24 |
| Antimicrobial resistance | ||
| CDIF27147_02668 | CDIF27147_02668 | 2.13 | CD25020 | CD25020 | 6.81 | Cofactor synthesis | |||
| CDIF27147_02763 | 48.6 | CD25990 |
| CD25990 | 0.50 | Transcriptional regulator | |||
| CDIF27147_02961 |
| CDIF27147_02961 | 0.32 | CD27870 |
| CD27870 | 0.82 |
| Cell surface |
| CDIF27147_02971 | CDIF27147_02971 | 0.33 | CD27970 | CD27970 | 3.54 | Cell surface | |||
| CDIF27147_02995 | CDIF27147_02995 | 10.2 | CD28181 (partial) |
| CD28181 | 1.09 | Unknown | ||
| CDIF27147_03022 | CDIF27147_03022 | 78.5 | CD28370 | CD28370 | 5.47 | Unknown | |||
| CDIF27147_03138 | CDIF27147_03138 | 0.51 | CD30040 | CD30040 | 4.40 |
| Metabolite transport | ||
| CDIF27147_03140 | CDIF27147_03140 | 0.41 | CD30060 | CD30060 | 4.60 | Metabolism | |||
| CDIF27147_03156-03157 | CDIF27147_03156-03157 | 101.4–174.3 | CD30230-30240 | CD30230-30240 | 0.21–0.37 | Unknown | |||
| CDIF27147_03165 | CDIF27147_03165 | 37.1 | CD30320 | CD30320 | 0.93 | Cofactor synthesis | |||
| CDIF27147_03235-03236 |
| CDIF27147_03235-03236 | 1.50–2.46 | CD30970-30980 |
| CD30970-30980 | 5.28–6.89 |
| Metabolite transport |
| CDIF27147_03313-03314 |
| CDIF27147_03313 | 2.36–9.10 | CD31510- 31521 |
| CD31510 | 0.61–1.26 | Prophage transcription regulation | |
| CDIF27147_03355 |
| CDIF27147_03355 | 14.3 | CD31840 |
| CD31840 | 0.82 |
| Metabolism |
| CDIF27147_03396 |
| CDIF27147_03396 | 3.83 | CD32190 |
| CD32190 | 0.93 |
| Stress response |
| CDIF27147_03439-03442 |
| CDIF27147_03439-03442 | 5.71–10.1 | CD32600-32630 | CD32600-32630 | 0.45–1.00 |
| Transporter, transcription regulation | |
| CDIF27147_03542 | CDIF27147_03542 | 0.26 | CD33690 | CD33690 | 5.63 | Unknown | |||
| Genetic region | Predicted CodY box | Predicted CodY target | Gene names | Putative function | |
|---|---|---|---|---|---|
| 630 | |||||
| CD02110-02120 |
| CD02110-02120 | 2.08–3.89 |
| Metabolism |
| CD02410-02440 |
| CD02410-02440 | 4.31–8.55 | Motility | |
| CD03790-CD03810 |
| CD03790-03810 | 0.34–0.60 | Conjugative transposon | |
| CD04090-04120 |
| CD04090-04120 | 0.33–1.11 | Conjugative transposon | |
| CD04230 |
| CD04230 | 0.32 | DNA replication | |
| CD04352 |
| CD04352 | 0.27 | Conjugative transposon | |
| CD10921-10940 |
| CD10921-10940 | 0.23–0.27 | Conjugative transposon, | |
| CD11030 |
| CD11030 | 0.32 | Conjugative transposon | |
| CD18510-18550 |
| CD18510-18550 | 0.30–0.68 | Conjugative transposon | |
| CD18840 |
| CD18840 | 0.07 | Unknown | |
| CD18860 |
| CD18860 | 4.47 | Transcription regulator | |
| CD26170 |
| CD26170 | 5.33 | Unknown | |
| CD31360-31380 |
| CD31360-31380 | 2.95–5.86 |
| Metabolism |
| UK1 | |||||
| CDIF27147_00347-00350 |
| CDIF27147_00350 | 0.23–0.59 |
| Metabolism |
| CDIF27147_ |
| CDIF27147_00657-00658 | 9.18 | Signaling | |
| CDIF27147_00757 |
| CDIF27147_00757 | 24.0 | Amino acid metabolism | |
| CDIF27147_ |
| CDIF27147_01972 | 1.49–7.30 | Conjugative transposon | |
| CDIF27147_ |
| CDIF27147_02077-02078 | 1.08–3.09 | Metabolism | |
| CDIF27147_03267 |
| CDIF27147_03267 | 1.56–3.34 | Metabolism | |
| CDIF27147_ | CDIF27147_03305-03309 | 0.29–0.50 | CRISPR | ||
| CDIF27147_03444-03445 |
| CDIF27147_03444-03445 | 4.54–5.27 | Transporter | |
| CDIF27147_03612 | CDIF27147_03612 | 0.29 | Unknown | ||
| CDIF27147_03617 |
| CDIF27147_03617 | 4.00 | Unknown | |
| CDIF27147_03628 | CDIF27147_03628 | 7.05 | Unknown | ||
| CDIF27147_03629 | CDIF27147_03629 | 10.8 | Transposase | ||
| CDIF27147_03815-03818 |
| CDIF27147_03818 | 2.31–6.48 | Transposon | |
| Direct CodY-induced targets | ||||
|---|---|---|---|---|
| Predicted CodY target | Predicted CodY Box | ∆ | Name | Putative function |
| CDIF27147_01886 | 0.02 | Unknown | ||
| CDIF27147_01510 |
| 0.022 | Unknown | |
| CDIF27147_02271 |
| 0.04–0.04 | Transcription regulation | |
| CDIF27147_02499 |
| 0.12 | Transcription regulator | |
| CDIF27147_00584 | 0.18 | Transcription antiterminator | ||
| CDIF27147_00748 |
| 0.19 |
| Transcription regulator |
| CDIF27147_03455 | 0.22–0.24 |
| Sporulation initiation | |
| CDIF27147_02672 |
| 0.24–0.30 |
| Transcription regulator |
| Direct CodY-repressed targets | ||||
| CDIF27147_02081 |
| 248.6–376.2 | Unknown | |
| CDIF27147_00252 |
| 267.7 | Unknown | |
| CDIF27147_01772 |
| 65.9 | Unknown | |
| CDIF27147_02803 |
| 47.4 | Unknown | |
| CDIF27147_01821 |
| 42.3 | Metabolism | |
| CDIF27147_03734 | 41.4 | Unknown | ||
| Plasmid or strain | Relevant genotype or features | Source, construction, or reference |
|---|---|---|
| Strains | ||
|
| ||
| DH5α max efficiency | F− Φ80 | Invitrogen |
| HB101 | F-
| Dupuy |
|
| ||
| 630Δ | ErmS derivative of strain 630, ribotype 012 | Minton ( |
| UK1 | Epidemic isolate, ribotype 027 | ( |
| LB-CD16 | UK1 | ( |
| MC310 | 630Δ | ( |
| MC364 | 630Δ | ( |
| MC855 | 630Δ | ( |
| MC2186 | UK1 pMC1123 | ( |
| MC2187 | UK1 pMC1170 | This study |
| MC2188 | UK1 pMC1171 | This study |
| MC2189 | UK1 pMC1172 | This study |
| MC2190 | UK1 pMC1173 | This study |
| MC2191 | UK1 pMC1174 | This study |
| MC2192 | UK1 pMC1175 | This study |
| MC2194 | UK1 pMC1177 | This study |
| MC2195 | UK1 | This study |
| MC2196 | UK1 | This study |
| MC2197 | UK1 | This study |
| MC2216 | UK1 | This study |
| MC2218 | UK1 | This study |
| MC2219 | UK1 | This study |
| MC2220 | UK1 | This study |
| MC2263 | UK1 pMC1178 | ( |
| MC3087 | UK1 pMC1156 | This study |
| MC3088 | UK1 pMC1162 | This study |
| Plasmids | ||
| pRK24 | Tra+, Mob+; | ( |
| pIA33 | P | ( |
| pMC123 | ( | |
| pMC404 | pMC123 with | ( |
| pMC1123 | P | ( |
| pMC1156 | P | This study |
| pMC1158 | P | This study |
| pMC1160 | P | This study |
| pMC1162 | P | This study |
| pMC1163 | P | This study |
| pMC1164 | P | This study |
| pMC1170 | P | This study |
| pMC1171 | P | This study |
| pMC1172 | P | This study |
| pMC1173 | P | This study |
| pMC1174 | P | This study |
| pMC1175 | P | This study |
| pMC1177 | P | This study |
| pMC1178 | P | ( |
| Primer | Sequence (5′→3′) | Use/locus tag/reference |
|---|---|---|
| oMC44 |
| Forward primer for |
| oMC45 |
| Reverse primer for |
| oMC2618 |
| Forward primer for |
| oMC2619 |
| Reverse primer for |
| oMC2362 |
| Forward primer for |
| oMC2363 |
| Reverse primer for |
| oMC3088 |
| Forward primer to Gibson assemble CRISPRi sgRNAs into pMC1123 ( |
| oMC3089 |
| Reverse primer to Gibson assemble CRISPRi sgRNAs into pMC1123 ( |
| oMC3101 |
| Forward primer for sgRNA- |
| oMC3103 |
| Forward primer for sgRNA- |
| oMC3105 |
| Forward primer for sgRNA- |
| oMC3108 |
| Forward primer for sgRNA- |
| oMC3109 |
| Forward primer for sgRNA- |
| oMC3110 |
| Forward primer for sgRNA- |
| oMC3131 |
| Forward primer for sgRNA- |
| oMC3132 |
| Forward primer for sgRNA- |
| oMC3133 |
| Forward primer for sgRNA- |
| oMC3134 |
| Forward primer for sgRNA- |
| oMC3135 |
| Forward primer for sgRNA- |
| oMC3136 |
| Forward primer for sgRNA- |
| oMC3138 |
| Forward primer for sgRNA- |
| oMC3139 |
| Forward primer for sgRNA- |
| oMC3235 |
| Forward primer for |
| oMC3236 |
| Reverse primer for |
| oMC3237 |
| Forward primer for |
| oMC3238 |
| Reverse primer for |
| oMC3239 |
| Forward primer for |
| oMC3240 |
| Reverse primer for |
| oMC3241 |
| Forward primer for |
| oMC3242 |
| Reverse primer for |
| oMC3243 |
| Forward primer for |
| oMC3244 |
| Reverse primer for |
| oMC3245 |
| Forward primer for |
| oMC3246 |
| Reverse primer for |
| oMC3249 |
| Forward primer for |
| oMC3250 |
| Reverse primer for |
| oMC3251 |
| Forward primer for |
| oMC3252 |
| Reverse primer for |
| oMC3394 |
| Forward primer for |
| oMC3395 |
| Reverse primer for |
| oMC3396 |
| Forward primer for |
| oMC3397 |
| Reverse primer for |
| oMC3398 |
| Forward primer for |
| oMC3399 |
| Reverse primer for |
| oMC3488 |
| Forward primer for |
| oMC3489 |
| Reverse primer for |
| 4084 |
| Reverse primer for sgRNAs with NotI site for cloning into pIA33 ( |
- —National Institute of Allergy and Infectious Diseaseshttp://dx.doi.org/10.13039/100000060
- —National Institute of Allergy and Infectious Diseaseshttp://dx.doi.org/10.13039/100000060
- —National Institute of Allergy and Infectious Diseaseshttp://dx.doi.org/10.13039/100000060
Peer Reviews
No public reviews on file for this paper yet. If you reviewed it on a platform where reviews are public (OpenReview, ICLR, NeurIPS, ICML), you can paste yours below so the community can read it here.
Videos
No videos yet. Explain this paper in a talk, walkthrough, or lecture? Add one.
Taxonomy
TopicsClostridium difficile and Clostridium perfringens research · Bacterial Genetics and Biotechnology · Bacillus and Francisella bacterial research
INTRODUCTION
Clostridioides difficile is an anaerobic and spore-forming nosocomial pathogen that causes severe diarrhea, colitis, and even death (1–3). Transmission of C. difficile is only possible through spores, which survive environmental threats, such as atmospheric oxygen and disinfectants (4). After a host ingests C. difficile spores, they transit through the gastrointestinal tract, reaching the intestines, where they sense bile salts and germinate into vegetative cells (5–7). C. difficile vegetative cells colonize the host colon, where nutrient availability is limited, leading to toxin production and spore formation (8–14). Nutrient availability is fundamental for determining whether C. difficile grows as a vegetative cell or becomes a spore. Under nutrient-limited conditions, C. difficile responds by increasing the expression of factors for nutrient acquisition and biosynthesis of necessary metabolites; when these mechanisms fail to provide for sustained vegetative growth, spore formation is initiated (15–17).
To sense and control metabolism, C. difficile encodes nutritional regulators, such as the global nutrient transcriptional regulator, CodY (11, 13, 14, 18). CodY was first identified in Bacillus subtilis and is present in many gram-positive bacteria with low G-C genomes (19–26). In a nutrient-rich environment, C. difficile senses branched-chain amino acids (BCAAs) and guanosine triphosphate (GTP) through their interactions with CodY (11, 13, 14, 27, 28). CodY undergoes a conformational change when it binds to BCAAs and GTP, which increases its binding affinity to specific CodY-DNA binding sites, leading to the differential regulation of hundreds of genes (11, 13, 14, 29). When the intracellular concentrations of BCAAs and GTP decrease, the binding affinity of CodY to DNA is altered, changing gene expression to adapt to nutrient scarcity, including the derepression of toxin production and the initiation of sporulation (11, 13, 14, 29–31). While the regulation of specific metabolic genes and toxins by CodY is well-documented, the mechanisms by which CodY affects C. difficile sporulation are less clear (29, 32). CodY has varied effects on sporulation in strains 630 (ribotype 012) and UK1 (ribotype 027), as evidenced by a modest increase in sporulation in a 630 codY mutant and robust hypersporulation in a UK1 codY mutant (13, 29). The CodY proteins encoded by these strains are identical and similarly expressed, leading us to ask how CodY differentially regulates sporulation outcomes in these strains.
In this study, we examined CodY-dependent gene regulation in the 630 and UK1 backgrounds to identify strain-specific differences in sporulation outcomes. Through transcriptional analysis and mapping of CodY-binding sites, we identified CodY-regulated factors that are differentially expressed in 630*∆erm* and UK1 and contain a CodY-binding site in at least one strain. In addition, we demonstrated that transcriptional repression of several direct CodY-regulated factors in UK1 or UK1 codY impacts sporulation. These results illustrate how CodY regulation differs between the 630*∆erm* and UK1 strains and demonstrate that many CodY-regulated factors can impact sporulation.
RESULTS
The impact of CodY regulation on sporulation is strain-dependent
In a previous work, we demonstrated that CodY represses the initiation of sporulation and that CodY regulation of sporulation varies by strain (13). In the commonly studied strain 630*∆erm* (a 630 derivative), CodY was found to modestly repress sporulation, resulting in a twofold increase in sporulation frequency for the codY mutant in sporulation broth cultures. In contrast, the epidemic 027 isolate, the UK1 codY mutant, demonstrated more than 1,000-fold greater sporulation frequency than the parent strain. To better understand how CodY regulates sporulation dissimilarly in 630*∆erm* and UK1, we evaluated sporulation in these strains over time on sporulation agar, which induces more robust sporulation than liquid medium (33, 34). Strains UK1, 630*∆erm*, and their respective codY mutants were grown on 70:30 sporulation agar, and the formation of ethanol-resistant spores was assessed after 6 (logarithmic phase), 12 (stationary phase), and 24 h of growth to compare the dynamics of spore production. As shown in Fig. 1, at log phase, the 630*∆erm codY* mutant sporulated ~43-fold more than its parent strain (1.0E−3 ± 4.3E−4 vs 2.6E−5 ± 3.3E−5%). In comparison, at log phase, the UK1 codY mutant sporulated ~3,150-fold more than its parent strain, UK1. These results support the prior evidence that CodY represses premature sporulation initiation and that CodY repression of sporulation in UK1 is more robust than in 630*∆erm* (13). By stationary phase (12 h), the 630 codY mutant sporulated ~28-fold less than the parent strain (0.12 ± 0.07 vs 3.37 ± 1.02%), while after 24 h of growth, the 630 codY mutant and parent displayed similar sporulation frequencies (Fig. 1). These results suggest that CodY suppresses early initiation of sporulation in 630 and that this strain requires CodY to control the timing of sporulation. In contrast, at stationary phase, the UK1 codY mutant sporulation frequency was ~2,000-fold higher than its parent strain (45.4 ± 16.9 vs 0.02 ± 0.01%) and continued at greater frequency than the parent at 24 h (67.9 ± 4.9 vs 0.33 ± 0.05). Thus, the UK1 strain CodY represses sporulation at all growth stages. These data suggest there are differences in CodY-dependent gene regulation in U K1 and 630 that result in dissimilar sporulation outcomes.
*CodY repression on sporulation is strain-dependent. (A) Phase-contrast micrographs of strains 630∆erm, 630∆erm codY (MC364), UK1, and UK1 codY (LB-CD16) grown on sporulation agar for 6, 12, or 24 h. White arrowheads indicate bright spores. Scale bar = 5 µm. ‡SD: standard deviation <0.0001. (B) Ethanol-resistant spore formation for the cultures above. The means and individual values for three biological replicates are shown. Data were analyzed using unpaired Student’s t-tests comparing the mutants to their respective parent strain. P < 0.05, ** P < 0.01, and **** P < 0.0001.
Identifying strain-specific differences in CodY regulation
To understand how CodY regulates sporulation differently in the UK1 and 630 backgrounds, we examined gene expression during growth on sporulation agar in these strains and their codY mutants. Since CodY activity is controlled by the availability of BCAA and GTP, we investigated expression at log phase when nutrients are most abundant, and CodY repression is greatest (11, 13, 14, 19, 27–29, 35, 36). Following 6 h of growth on 70:30 agar, samples were processed for RNA-seq analysis to assess the ratio of gene expression in the codY mutants relative to their respective parent strain (codY/WT) (Tables S1 and S2). Transcription was extensively altered in the codY mutants of both strains, resulting in 867 genes differentially expressed more than threefold in the UK1 codY mutant and 449 genes in the 630 codY mutant.
Transcripts that were differentially regulated in the UK1 codY and 630 codY mutants include factors that are directly and indirectly regulated by CodY. To discern which genes may be directly controlled by CodY to influence sporulation, we sought to define genes with CodY-binding motifs (CodY boxes). Using the CodY binding sites previously identified in C. difficile (13, 14, 37) and potential CodY boxes identified based on the classical gram-positive CodY consensus (AATTTTCWGAAAATT) (38, 39), we narrowed the list of differentially regulated genes to those most likely to be directly regulated by CodY. The resulting list included 404 transcripts with prospective CodY-binding sites within the promoter or coding sequence that were threefold differentially expressed in at least one of the codY mutant strains relative to the parental control (Fig. 2; Table S3).
Representation of CodY-regulated transcripts with putative CodY boxes in strains UK1 and 630. (A) Venn diagram illustration of CodY-regulated genes and operons from RNA-seq data of strains UK1 and 630 that contain predicted CodY-box regulatory elements. A total of 404 transcripts that were differentially regulated ≥3-fold in UK1 ∆codY, 630∆erm ∆codY, relative to their parent strains, are represented. (B) Representation of CodY-regulated transcripts from A categorized by regulation characteristics.
Of the genes and operons listed in Table S3, 52 were similarly regulated by CodY in the UK1 and 630∆erm strains, which limits their likelihood for strain-specific, CodY-dependent impacts. While some of these factors may differ in protein similarity or function that results in differences in sporulation outcomes, such differences were outside the scope of this study. Of the 352 transcripts in Table S3 that were dissimilarly CodY regulated between UK1 and 630∆erm, 265 had identical CodY boxes, which suggests that the differences in expression observed were not due to variation in the inherent ability of CodY to bind to these target sequences. We focused further on the 87 CodY-regulated transcripts with significant differences in expression between the UK1 and 630∆erm strains (Fig. 2B and [Tables 1 and 2](#T1 T2)). Table 1 includes CodY-regulated genes with associated CodY boxes that differ in expression at least twofold between strains, while Table 2 contains CodY-regulated genes that are unique to the genome of either strain. As expected from the sporulation phenotypes of the codY mutants, sporulation-specific transcripts comprised many of the genes differentially expressed in the UK1 codY mutant (Table S3 ~10%) (33, 40), many of which were late-stage sporulation or germination factors. Unfortunately, increased late sporulation gene expression in UK1 codY is not helpful for understanding how CodY differentially regulates the initiation of sporulation, which is controlled by the activation of the master sporulation regulator, Spo0A (33, 41). One factor that is directly involved in Spo0A activity and demonstrated reduced expression in UK1 codY is spo0E. Spo0E interacts with Spo0A to limit Spo0A activation, which prevents sporulation initiation in C. difficile (42). However, the putative CodY boxes that potentially impact spo0E were identical in UK1 and 630, implying that the CodY-dependent effect on spo0E transcription in the UK1 codY mutant was not due to strain-specificity in CodY binding. In addition, a large proportion (20%, Table S3) of the CodY-regulated transcripts in both strains are genes of unknown function, which limits our understanding of their contribution to CodY-dependent phenotypes.
Though few sporulation initiation-associated genes were identified in these data that would clearly explain the increased Spore formation found in the UK1 codY mutant, there were notable differences in the expression of genes indirectly associated with greater sporulation. The transcriptional analyses revealed significant changes in CodY regulation between strains, including increased relative expression of dozens of metabolic genes in UK1 codY that are not observed in 630 codY. Furthermore, several of the metabolism loci that are upregulated in UK1 codY contain differences in their putative CodY boxes compared to 630 codY (Table 1), while some are only encoded by one strain (Table 2). The extensive differences in UK1 codY and 630 codY metabolic gene expression suggest that these strains have altered responses to nutrient limitation, which may affect the ability to initiate or complete spore formation.
Repression of multiple direct CodY-regulated factors impacts sporulation in strain UK1
Given the limited information available on the function of many CodY-regulated factors, we selected an assortment of genes present in both strains that were greatly induced or repressed by CodY for further investigation of their impacts on sporulation (Table 3). To determine which directly regulated CodY-dependent transcripts may impact spore formation, we employed a CRISPR interference (CRISPRi) approach to suppress transcription of target genes (43). The UK1 and UK1 codY strains were used for these experiments due to the robust CodY-regulated sporulation phenotype in this background. The UK1 strain was used to evaluate the effects of repressing eight CodY-induced factors, while the UK1 codY mutant was used to examine repression of six CodY-repressed factors. Strains were transformed with plasmids containing each CRISPRi sgRNA target expressed from a nisin-inducible promoter and grown on 70:30 agar with 1 µg/mL nisin to assess the impact of transcript repression on sporulation (44, 45). The repression of target genes was examined by qRT-PCR during active growth, which confirmed that the targeted transcripts were reduced in all the strains tested (Fig. S1). The sporulation frequencies of strains carrying each sgRNA target were determined after 24 h, as previously noted, and normalized to the respective parent carrying the vector control (pKD). As shown in Fig. 3, suppression of two of the eight CodY-induced transcripts in strain UK1 resulted in significant increases in sporulation relative to the control. The repression of CDIF27147_01510, a gene of unknown function, resulted in a ~40-fold increase in sporulation in strain UK1. The expression of CDIF27147_01510 was reduced approximately 50-fold in the UK1 codY mutant and 20-fold in the 630 codY mutant (annotated CD630_14850 in 630) under sporulation conditions (Table S3). The CD630_14850 gene is controlled by the iron-responsive regulator, Fur, and induced by cysteine, suggesting it is involved in metabolism (46, 47). Similarly, knockdown of the CDIF27147_02672 transcript led to ~35-fold greater sporulation in UK1 (Fig. 3). Expression of CDIF27147_02672 was decreased fourfold in the UK1 codY mutant and approximately threefold in the 630 codY mutant during sporulation (Table S3). CDIF27147_02672 is part of a dicistronic operon encoding a pH-dependent transcriptional regulator and transporter we recently characterized (smrRT; CD630_25050-25060) that contributes to macrolide and lincosamide resistance (48). SmrR represses expression of the smrT transporter, which reduces sporulation and toxin production (48). Expression of SmrRT and CDIF27147_01510 does not appear to directly link to Spo0A activity based on known interactions (42) but more likely support cellular homeostasis through pH or nutritional adaptations, respectively.
*Repression of specific direct CodY-induced factors increases sporulation in UK1. (A) Ratio of ethanol-resistant spore formation of strain UK1 expressing CRISPRi knockdown constructs relative to a vector control. UK1 carrying pKD-CDIF01886 (MC2187), pKD-CDIF01510 (MC2188), pKD-CDIF02271 (MC2189), pKD-CDIF02499 (MC2190), pKD-CDIF00584 (MC2191), pKD-CDIF00748 (MC2192), pKD-CDIF03455 (MC2194), pKD-CDIF02672 (MC2263), and the pKD vector (MC2186) were assessed for spore formation after 24 h growth on sporulation agar (70:30 with 2 µg/mL thiamphenicol, 1 µg/mL nisin). The means, individual values, and standard deviations of ratios (knockdown/control) for at least three biological replicates are shown. (B) Phase-contrast micrographs of the strains in A with sporulation frequencies. Scale bar = 5 µm. The mean, standard deviations, and SEM are shown for three biological replicates. Data were analyzed using a one-way ANOVA, followed by Fisher’s LSD. P < 0.05 and *** P < 0.001.
The UK1 codY mutant was used to assess repression of six CodY-repressed factors by CRISPRi and examine their effects on sporulation, as outlined above. Of the six genes assessed in UK1 codY, suppression of CDIF27147_02081 and CDIF27147_02803 dramatically reduced spore formation (Fig. 4). Repression of CDIF27147_02081 led to a ~150-fold decrease in sporulation, while knockdown of CDIF27147_02803 resulted in ~35-fold lower spore formation than the control. CDIF27147_02081 and CDIF27147_02803 both encode predicted membrane proteins of unknown function that are expressed during sporulation (33, 49–51). CDIF27147_02081 expression increased 248-fold in the UK1 codY mutant during sporulation, but was down 14-fold in the 630 codY mutant (CD630_19280) (Table S3). Similarly, CDIF27147_02803 expression increased 47-fold in UK1 codY and decreased threefold in 630 codY (CD630_26360) during sporulation. To determine if the impacts of these transcripts on sporulation are specific to the codY mutant, we expressed both knockdown constructs in the wild-type UK1 strain and assessed their effects on sporulation (Fig. S3). We found that repression of either CDIF27147_02081 or CDIF27147_02803 led to comparable reduction in sporulation as observed in the codY mutant, suggesting that both transcripts are important for spore formation. These results and the contrasting expression profiles for these genes in the UK1 codY and 630 codY mutants suggest that both factors support robust spore formation, but further investigation is needed to understand their roles in sporulation.
*Repression of specific direct CodY-repressed factors reduces sporulation in the UK1 codY mutant. (A) Ratio of ethanol-resistant spore formation of strain UK1 ∆codY mutant expressing CRISPRi knockdown constructs relative to a vector control. UK1 ∆codY carrying pKD-vector (MC2195), pKD-CDIF00252 (MC2196), pKD-CDIF01772 (MC2197), pKD-CDIF01821 (MC2219), pKD-CDIF02081 (MC2216), pKD-CDIF02803 (MC2218), and pKD-CDIF03734 (MC2220) were assessed for spore formation after 24 h growth on sporulation agar (70:30 with 2 µg/mL thiamphenicol, 1 µg/mL nisin). The means, individual values, and standard deviations of ratios (knockdown/control) for at least three biological replicates are shown. (B) Phase-contrast micrographs of the strains in A with sporulation frequencies. Scale bar = 5 µm. The mean, standard deviations, and SEM are shown for three biological replicates. Data were analyzed using a one-way ANOVA, followed by Fisher’s LSD. *P < 0.01.
DISCUSSION
While 630 and UK1 encode identical CodY proteins that can bind to the same target sites, the activity of CodY in these backgrounds may be influenced by many factors that cannot be easily measured. CodY regulation is contingent on the availability of the cofactors GTP and BCAA, which trigger conformational changes in CodY that are necessary for DNA binding (11, 13, 14, 27–29). The availability of GTP and BCAA signals amino acid and energy levels in the cell, which can vary in strains based on their ability to take up nutrients or their capacity to utilize nutrient sources. The UK1 and other 027 isolates grow more poorly than the 630 strain in complete defined minimal media (CDMM), and 027 ribotype isolates demonstrate a narrower metabolic repertoire than 630 and many other strains (52–57). The metabolic range of the 027 isolates relative to other strains may contribute to differences in CodY activity. For example, if BCAA are available to bind CodY, even if other growth-limiting nutrients are unavailable, CodY-DNA binding could persist, restricting adaptation to nutrient limitation and decreasing spore formation (Fig. 1, UK1 24 h). Thus, deletion of codY in UK1 could expand metabolite availability through nutrient gene derepression to support sporulation. Our data suggest that at least some of the CodY-regulated genes in UK1 repress sporulation, as indicated by the hypersporulation of the UK1 codY mutant, while in the 630∆erm strain, only the timing of sporulation is advanced in the absence of codY (Fig. 1). Overall, the evidence suggests that nutrient availability differs in these strains, leading to differential CodY regulation of sporulation and metabolic processes.
Our data show that the CodY regulons of the 630*∆erm* and UK1 strains are considerably different (Tables S1 through S3). Additionally, we identified several CodY-dependent genes with putative CodY boxes that differ in these strains (Table 1) and unique CodY-regulated factors present only in one strain (Table 2). Though we were able to identify several factors that are differentially regulated by CodY that have potential CodY-binding sites, further investigation is needed to determine if CodY is the major regulator of these factors and if CodY binds to these boxes. It is also important to note that by limiting our analysis to factors that were differentially expressed in the codY mutants by more than threefold, we may have missed some direct CodY-regulated factors that impact sporulation.
Our work demonstrates that multiple factors regulated by CodY can influence sporulation, as illustrated by the phenotypes observed from repression of CodY-regulated factors ([Fig. 3 and 4](#F3 F4)). As CodY regulates hundreds of genes, innumerable effects of global changes in gene expression in the absence of codY may contribute to the different sporulation phenotypes in the UK1 and 630∆erm strains. The effects of CodY on sporulation may be an indirect result of altering the nutrients available or cellular functions that are necessary for adapting to post-exponential growth. Many of the CodY-dependent factors that are differentially regulated have no identified function in C. difficile, and their roles in sporulation are not known. Further characterization of these CodY-regulated factors, especially those that affect sporulation when repressed, could provide targets for preventing spore formation.
MATERIALS AND METHODS
Bacterial strains and growth conditions
C. difficile strains were cultivated in a Coy anaerobic chamber at 37°C with an atmosphere of 10% H_2_, 5% CO_2_, and 85% N_2_ as previously described (58). C. difficile strains grew in BHIS broth with addition of 0.1% of taurocholic acid (TA, Sigma-Aldrich) to induce germination and 0.2% of fructose (D-fructose, Fisher Chemical) to prevent sporulation (59) To maintain plasmids in C. difficile strains, 2–10 μg/mL of thiamphenicol was added to cultures. For CRISPRi induction, 1 µg/mL of nisin was added, as needed. Escherichia coli strains were cultivated aerobically at 37°C in LB medium (Lennox) with 20 µg/mL of chloramphenicol and/or 100 µg/mL ampicillin (Sigma-Aldrich) for plasmid maintenance. Agar was added at 1.5% for all solid media. E. coli was counter-selected post-conjugation with 100 µg/mL of kanamycin.
Strain and plasmid construction
All plasmids and strains are listed in Table 4. The C. difficile strain R20291 027 ribotype genome (GenBank accession no. CP_029423.1) was used as a template for primer construction, and UK1 genomic DNA was used for PCR amplification. To generate sgRNAs, the Benchling CRISPR Guide RNA Design tool was used. sgRNAs were amplified by PCR and cloned into pMC1123 (43, 60). Design details of vector constructions are provided in the supplemental material (Fig. S2).
Sporulation assays
Sporulation assays were carried out as previously described (66, 67). In short, C. difficile cultures at mid-exponential phase (OD_600_ ~0.5) were plated on 70:30 agar supplemented with 2 μg/mL of thiamphenicol and 1 μg/mL of nisin as needed. After 6 (H_6_), 12 (H_12_), and 24 h (H_24_) of growth, ethanol-resistant sporulation assays were performed as previously described (67). Sporulation frequencies were calculated by dividing the number of spores by the total quantity of cells (spores + vegetative). A spo0A mutant was used as a negative sporulation control. For statistical analysis, GraphPad Prism v10.4.1 was used as stated in the figure legends.
Phase-contrast microscopy
Phase-contrast microscopy was performed at H_6_, H_12_, and H_24_ as specified in the figure legends using cells grown on 70:30 sporulation agar, as previously described (60).
RNA sequencing (RNA-seq) analysis
C. difficile strains were grown on 70:30 agar for 6 h, and cells were scraped, suspended into 1:1:2 ethanol-acetone-water solution, and stored at −70°C prior to processing. RNA was extracted and treated with DNase I (Ambion), as previously described (14, 36). RNA libraries were prepared and processed by the Microbial Genomics Sequencing Center (MiGS; Pittsburgh, PA), as previously described. RNA-seq reads were mapped to the respective reference genome (630; NC_009089.1 and R20291; CP_029423.1) using Geneious Prime v2022.2.2. Expression levels of transcripts were calculated and compared using DESeq2 (68) RNA-seq raw sequence reads were deposited to the NCBI Sequence Read Archive (SRA) as BioProject PRJNA1263881.
Identification of CodY boxes
Potential CodY boxes were found in the 630 and R20291 genomes from previously published sites, in addition to in silico identification (14, 37). The C. difficile strain 630 and R20291 genomes (630, NC_009089.1; R20291, CP_029423.1) were screened for the global CodY AATTTTCWGAAAATT consensus sequence containing up to four mismatches using a combination of FIMO MEME and Benchling software (14, 38).
Quantitative reverse transcription PCR analysis (qRT-PCR)
C. difficile strains were grown on 70:30 agar for 6 h, suspended in 1:1:2 ethanol-acetone-water solution, and stored at −70°C. RNA extraction, treatment with DNase I (Ambion), and cDNA synthesis using random hexamers (Bioline) were performed as previously described (14, 36). qRT-PCR was conducted on a Roche LightCycler 96 instrument from 50 ng of cDNA in technical triplicates using Bioline SensiFast SYBR & Fluorescein Mix, with primers shown in Table 5. Expression was normalized to the internal control transcript, rpoC, and analyzed using the ∆∆C_t_ method for relative quantification (69). GraphPad Prism v10.4.1 was used as mentioned in the figure legends for statistical analysis.
Supplementary Material
Reviewer comments
The reference list from the paper itself. Each links out to its DOI / PubMed record.
- 1CDC. 2019. Antibiotic resistance threats in the United States.
- 2CDC. 2023. Emerging infections program healthcare-associated infections–community interface report Clostridioides difficile infection surveillance.
- 3CDC. 2013. Antibiotic resistance threats in the United States.25162160 · pubmed ↗
- 4Sandhu BK, Mc Bride SM. 2018. Clostridioides difficile. Trends Microbiol 26:1049–1050. doi:10.1016/j.tim.2018.09.00430297117 PMC 6637408 · doi ↗ · pubmed ↗
- 5Wilson KH. 1983. Efficiency of various bile salt preparations for stimulation of Clostridium difficile spore germination. J Clin Microbiol 18:1017–1019. doi:10.1128/jcm.18.4.1017-1019.19836630458 PMC 270959 · doi ↗ · pubmed ↗
- 6Sorg JA, Sonenshein AL. 2008. Bile salts and glycine as cogerminants for Clostridium difficile spores. J Bacteriol 190:2505–2512. doi:10.1128/JB.01765-0718245298 PMC 2293200 · doi ↗ · pubmed ↗
- 7Lee CD, Rizvi A, Carter ZA, Edwards AN, Mc Bride SM. 2025. The Pxp Complex Detoxifies 5-Oxoproline and Promotes the Growth of Clostridioides difficile. Molecular Microbiology,. doi: 10.1111/mmi.1537310.1111/mmi.15373 PMC 1224557440342073 · doi ↗ · pubmed ↗
- 8Donnelly ML, Shrestha S, Ribis JW, Kuhn P, Krasilnikov M, Alves Feliciano C, Shen A. 2022. Development of a dual-fluorescent-reporter system in Clostridioides difficile reveals a division of labor between virulence and transmission gene expression. m Sphere 7:e 0013222. doi:10.1128/msphere.00132-2235638354 PMC 9241537 · doi ↗ · pubmed ↗