An effective DNA extraction protocol optimized for tropical swamp peat samples
Júlia Brandão Gontijo, Gabriel Valverde Firmino, Jéssica Adriele Mandro, André Luiz Miranda Reis, Wanderlei Bieluczyk, Júlio César Feitosa Fernandes, Plínio Barbosa de Camargo, Jorge Luiz Mazza Rodrigues, Siu Mui Tsai, Pablo Vidal-Torrado

TL;DR
This paper introduces a new DNA extraction method for tropical peat soils, improving DNA quality and microbial analysis for climate research.
Contribution
An optimized DNA extraction protocol for tropical peat soils that enhances yield, purity, and reproducibility.
Findings
The optimized protocol increased DNA concentration fourfold and improved purity compared to conventional methods.
The protocol enabled better detection of microbial marker genes like 16S rRNA and mcrA, with lower variability among samples.
RNA co-extraction was observed, suggesting potential for multi-omic studies in tropical peatlands.
Abstract
Peatlands are waterlogged ecosystems that store large amounts of carbon, harbor highly specialized endemic biodiversity, and play a crucial role in climate regulation. However, the microbial communities of tropical peatlands, particularly in the Atlantic Forest, remain largely unexplored. Molecular tools are essential for characterizing these communities, yet conventional DNA extraction kits are often ineffective for peat soils, likely due to their high organic matter content, low pH, and the presence of PCR inhibitors. This study aimed to optimize a conventional soil DNA extraction protocol to enhance DNA yield and purity from tropical peat soils, ensuring more reliable molecular analyses. The optimized protocol resulted in a four-times increase in DNA concentration compared to the conventional protocol and improved DNA purity. Agarose gel electrophoresis confirmed higher DNA integrity…
Genes, proteins, chemicals, diseases, species, mutations and cell lines named across the full text — each resolved to its canonical identifier and authoritative record.
Click any figure to enlarge with its caption.
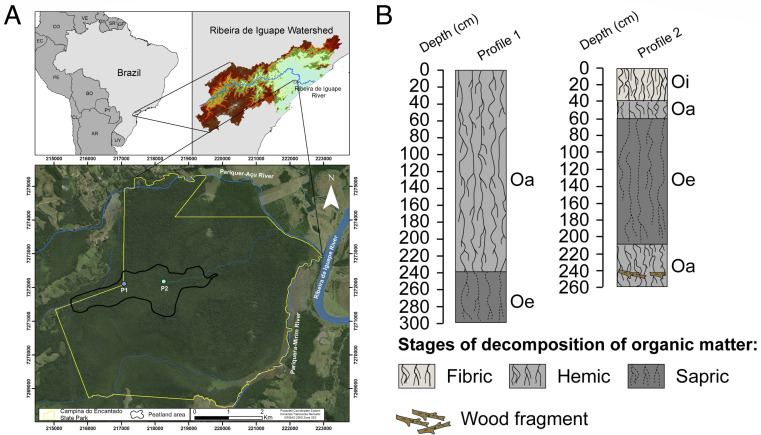 Fig 1
Fig 1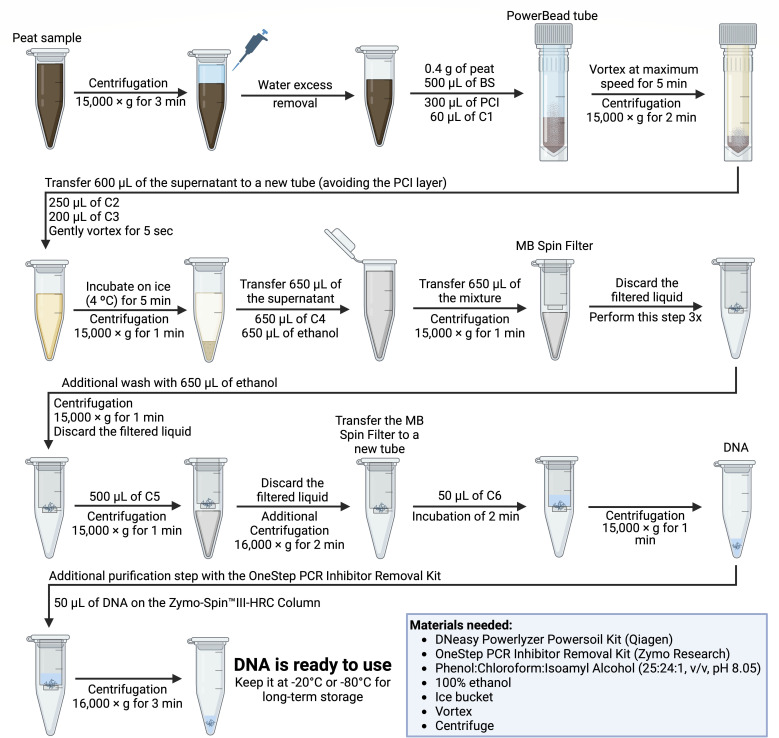 Fig 2
Fig 2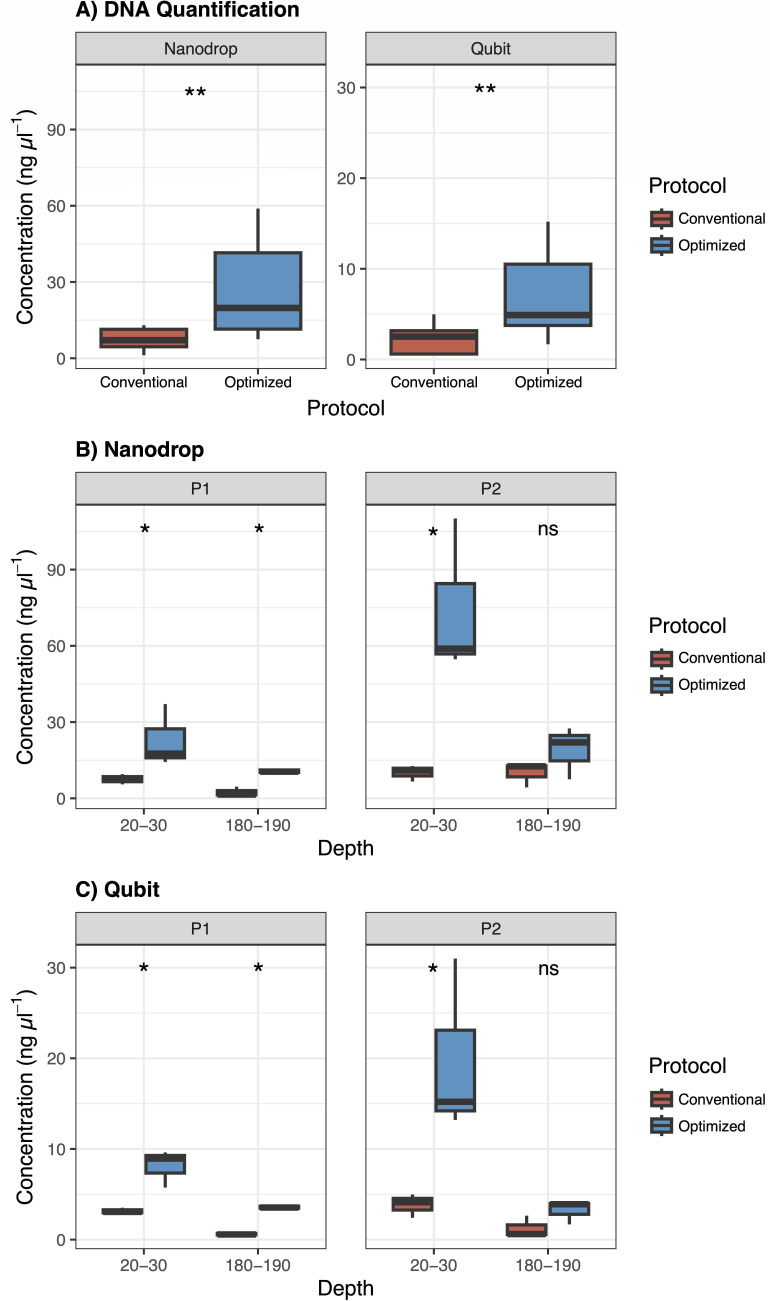 Fig 3
Fig 3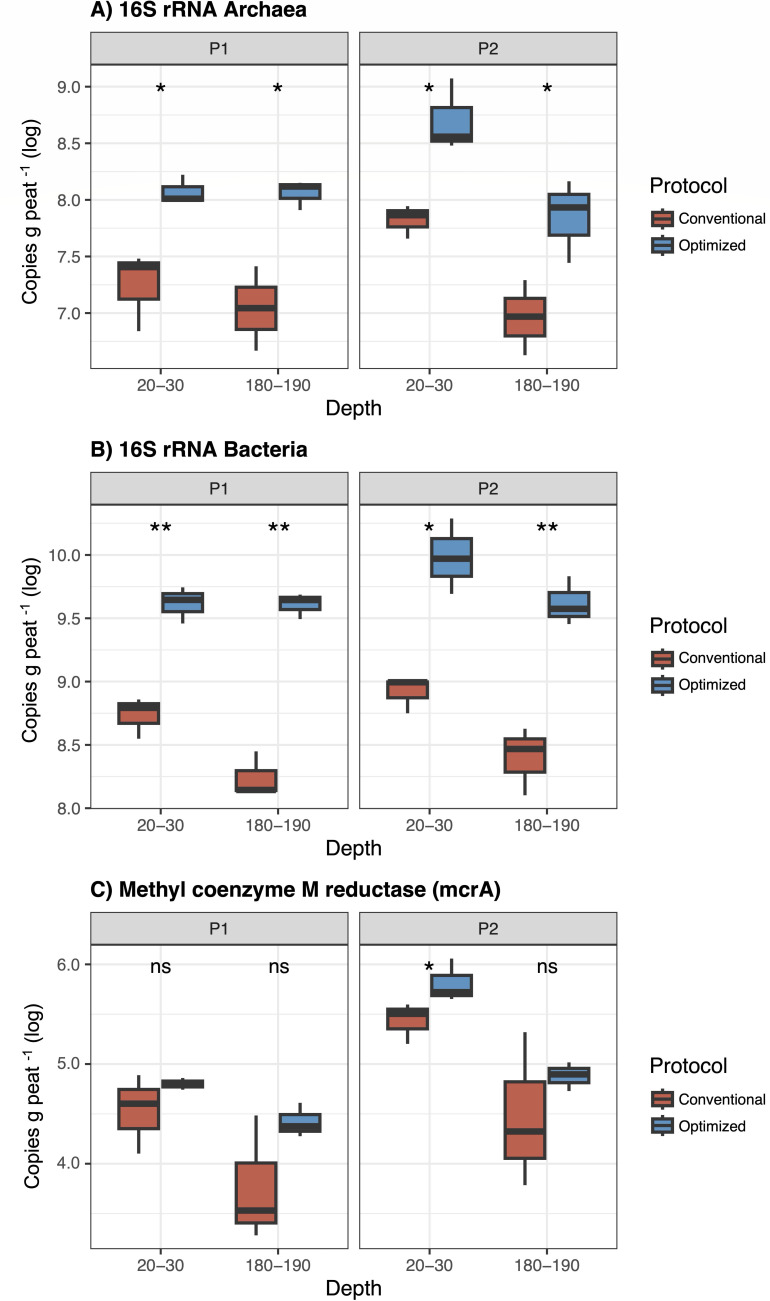 Fig 4
Fig 4| Gene | Primer | Sequence (5′-3′) | Reference | PCR conditions |
|---|---|---|---|---|
| 16S rRNA | 519F |
| ( | 95°C for 10 min; 40 cycles: 95°C for 30 s, 53°C for 40 s, 72°C for 40 s; melting curve: 95°C for 10 s, 53°C for 1 min, 95°C for 15 s |
| 915R | ( | |||
| 16S rRNA | Eub338F |
| ( | 95°C for 10 min; 40 cycles: 94°C for 15 s, 56°C for 30 s and 72°C for 45 s; melting curve: 95°C for 15 s, 56°C for 1 min, 95°C for 15 s |
| Eub518R |
| |||
| mlas-F | GGYGGTGTMGGDTTCACMCARTA | ( | 95°C for 10 min; 45 cycles: 95°C for 30 s, 60°C for 45 s and 72°C for 30 s; melting curve: 95°C for 15 s, 60°C for 1 min and 95°C for 15 s | |
| mcrA-R | CGTTCATBGCGTAGTTVGGRTAGTT | ( |
| Profile | Depth (cm) | Protocol | Qubit (ng µL−1) | NanoDrop (ng µL−1) | 260/280 |
|---|---|---|---|---|---|
| P1 | 20–30 | Conventional | 3.14 ± 0.34 | 7.53 ± 2.00 | 1.52 ± 0.18 |
| Optimized | 8.1 ± 2.07 | 23 ± 12.32 | 1.60 ± 0.20 | ||
| 180–190 | Conventional | 0.62 ± 0.18 | 2.43 ± 1.88 | 2.48 ± 0.78 | |
| Optimized | 3.59 ± 0.21 | 10.77 ± 0.93 | 1.82 ± 0.15 | ||
| P2 | 20–30 | Conventional | 3.83 ± 1.31 | 10.1 ± 3.15 | 1.52 ± 0.20 |
| Optimized | 19.8 ± 9.75 | 74.57 ± 30.84 | 1.51 ± 0.18 | ||
| 180–190 | Conventional | 1.25 ± 1.20 | 9.97 ± 4.91 | 1.44 ± 0.02 | |
| Optimized | 3.21 ± 1.33 | 19 ± 10.33 | 1.57 ± 0.08 |
- —Fundação de Amparo à Pesquisa do Estado de São Paulohttp://dx.doi.org/10.13039/501100001807
- —Fundação de Amparo à Pesquisa do Estado de São Paulohttp://dx.doi.org/10.13039/501100001807
- —Fundação de Amparo à Pesquisa do Estado de São Paulohttp://dx.doi.org/10.13039/501100001807
- —Fundação de Amparo à Pesquisa do Estado de São Paulohttp://dx.doi.org/10.13039/501100001807
- —Fundação de Amparo à Pesquisa do Estado de São Paulohttp://dx.doi.org/10.13039/501100001807
- —Coordenação de Aperfeiçoamento de Pessoal de Nível Superiorhttp://dx.doi.org/10.13039/501100002322
Peer Reviews
No public reviews on file for this paper yet. If you reviewed it on a platform where reviews are public (OpenReview, ICLR, NeurIPS, ICML), you can paste yours below so the community can read it here.
Videos
No videos yet. Explain this paper in a talk, walkthrough, or lecture? Add one.
Taxonomy
TopicsPeatlands and Wetlands Ecology · Genomics and Phylogenetic Studies · Environmental DNA in Biodiversity Studies
INTRODUCTION
Peatlands are wetland ecosystems that cover approximately 2.84% of the Earth’s surface and are composed primarily of peat, a unique soil layer formed from partially to highly decomposed organic matter. These ecosystems store vast carbon reserves, serving as critical carbon sinks by sequestering between 142 and 288 gigatons of carbon in thick, plant-derived layers (1, 2). For instance, carbon storage per area in tropical peatlands is exceptionally higher than in well-drained soils, averaging 2,000 tons per hectare for global estimates (3). Therefore, while these ecosystems play a pivotal role in global climate regulation (4, 5), their degradation could release massive amounts of greenhouse gases, particularly methane (CH_4_) and carbon dioxide (CO_2_), significantly contributing to global warming and climate change (2).
The formation of peat is driven by the continuous accumulation of plant detritus under conditions that markedly slow down decomposition. High water saturation and low oxygen concentrations inhibit most of the aerobic microbial activity, allowing the emergence of microbes adapted to anaerobiosis and favoring organic material to build up over time (4). Beyond their capacity for carbon sequestration, tropical swamp peatlands offer a range of essential ecosystem services, such as regulating hydrological cycles, maintaining water quality, and providing habitats for diverse endemic plant and animal species (1, 2). These multifaceted functions highlight the importance of studying and preserving these unique ecosystems, particularly given their role in mitigating climate change and supporting biodiversity.
A key feature of peatlands is their complex soil microbiota, which plays a fundamental role in driving biogeochemical cycles, especially the CH_4_ cycle (6). The shifting or permanent waterlogged conditions suppress aerobic microbes that generate CO_2_, while promoting anaerobic decomposition of the organic matter, particularly activating biogeochemical pathways of CH_4_ production (7, 8). Therefore, specific microorganisms, such as methanogenic archaea responsible for CH_4_ production, thrive in these environments (9). Considering that CH_4_ is the second most significant greenhouse gas, with a warming potential up to 28 times that of CO_2_ (10), understanding these microbial dynamics is crucial for assessing both ecosystem health and the broader impacts on climate.
Molecular tools, particularly quantitative PCR (qPCR), have become indispensable for investigating the above-mentioned microbial communities. Because the majority of soil microorganisms are difficult to culture, molecular markers are widely used to infer community structure and function. Markers, such as the mcrA gene, which encodes a subunit of the methyl-coenzyme M reductase enzyme found exclusively in methanogens (11), and the 16S rRNA gene, widely used for prokaryotic taxonomy (12), are essential for these analyses. To ensure reliable downstream analysis results, high-quality DNA is required, with purity commonly assessed through the 260/280 ratio, thereby minimizing the influence of PCR inhibitors (13).
Despite Brazil holding approximately 18%–20% of the world’s tropical peatlands, covering an estimated 611,000 hectares (14), molecular studies on their belowground microbial communities remain scarce. Many of these peatlands occur in the Atlantic Forest, a biome where natural vegetation cover is reduced to 36% of its original extent due to extensive degradation (15). The unique biogeochemical features of tropical peats, including a high content of humic substances, low pH, water saturation, and dense fibrous organic matter, challenge standard DNA extraction protocols, which were mostly designed for well-drained soils or aquatic environments with lower organic matter (16).
Given the ecological relevance of tropical peatlands and the importance of their microbiota as indicators of environmental change, we hypothesize that specific adjustments to commercial DNA extraction protocols can improve both the quantity and quality of DNA retrieved from these challenging substrates. To test this, we developed and applied tailored modifications to the DNeasy PowerLyzer Powersoil kit (Qiagen, Hilden, North Rhine-Westphalia, Germany) on peat samples collected from surface (20–30 cm) and deep (180–190 cm) layers in the Parque Estadual Campina do Encantado, Southeastern Brazil.
MATERIALS AND METHODS
Studied site
The Campina do Encantado State Park is located in the municipality of Pariquera-Açu, São Paulo, Brazil, covering an area of 3,000 hectares (Fig. 1A). Park headquarters lies west of the preservation area (24°38′52.48″ S, 47°48′44.72″ W; 16 m a.s.l.). According to the Köppen climate classification, the climate of the study area is Cfa (Humid Subtropical Climate, with hot summers and abundant, well-distributed rainfall throughout the year) (17). The area has altitudes below 10 m and is approximately 25 km from the coastline (18). The vegetation is characteristic of the Atlantic Forest biome, encompassing the Alluvial Dense Ombrophilous Forest (19–21), also known as swamp forest. This environment is dominated by tree species and features a high concentration of bromeliads in the lower stratum, close to the soil. Photos of the site are provided in Fig. S1 (supplemental material is found at https://doi.org/10.6084/m9.figshare.30535631).
(A) Location of the study area within the Campina do Encantado State Park, located on the southern coast of São Paulo State, Brazil, indicating the locations of sampling sites P1 (24°38′17.90″ S, 47°47′22.93″ W) and P2 (24°38′17.87″ S, 47°46′56.99″ W). (B) Profiles of histosols, illustrating the different stages of organic matter decomposition. Horizon designations are based on Schoeneberger et al. (22) and Soil Survey Staff (23): Oa (sapric—highly decomposed), Oe (hemic—moderately decomposed), and Oi (fibric—slightly decomposed).
Peat sampling
We analyzed available satellite imagery and systematically cored the area using a peat corer to survey and verify peat thickness. Based on these previous steps, we selected two locations in a transect across the swamp forest, extracting two representative peat layers (20–30 and 180–190 cm), to be used in our laboratory experiment. Using a peat corer, two histosol profiles were sampled in an identified peat bog (see Fig. 1A). Profile 1 (P1) was sampled 1,000 m from the nearest forest edge at 24°38′17.90″ S, 47°47′22.93″ W, and Profile 2 (P2) at 1,700 m along the same transect at 24°38′17.87″ S, 47°46′56.99″ W. Both profiles were characterized following international guidelines for describing and classifying soil horizons (22, 23). This characterization is illustrated in Fig. 1B.
The sampled layers, 20–30 cm and 180–190 cm, were selected to represent a near-surface condition with predominantly fibric material and a deeper environment characterized by hemic/sapric features within the peat profile, thereby capturing contrasting stages of peat decomposition and organic matter composition. The average peat pH was approximately 3 at both sites and depths. The carbon content in layers 20–30 cm and 180–190 cm was 48.3% and 40.5% in P1, and 55.8% and 51.2% in P2, respectively. Immediately after sampling, the peat was transported to the laboratory under temperature conditions mimicking those of the field to preserve sample integrity. In the laboratory, the samples were promptly transferred to 2 mL microtubes in triplicate and stored at −80°C for subsequent analysis.
Laboratory experiment design
From each layer in both profiles, three samples were collected, adding up to a total of 12 samples. The samples were destined for DNA extraction using two different protocols, aiming to compare the efficiency of each of them for concentration and purity of DNA, followed by molecular analysis.
DNA extraction and quantification
We evaluated the efficiency of two DNA extraction protocols using the DNeasy PowerLyzer PowerSoil DNA Isolation Kit (Qiagen, Hilden, North Rhine-Westphalia, Germany). Initially, peat samples were processed using the manufacturer’s standard protocol (conventional protocol, CP). We then optimized the procedure (optimized protocol, OP), adapting an alternative protocol previously suggested by MoBio that incorporated phenol:chloroform:isoamyl alcohol in the lysis step and an additional ethanol wash, as described by Mantri et al. (24). Building on this framework, we introduced further modifications to improve DNA yield and purity. First, the 2 mL microtubes containing the peat samples were thawed and centrifuged at 15,000 × g for 3 min, and excess water was removed using a micropipette. To enhance DNA yield, the sample amount was increased from 0.25 to 0.4 g in the PowerBead tubes. Next, 500 µL of Power Bead Solution was added together with 300 µL of UltraPure phenol:chloroform:isoamyl alcohol (25:24:1, vol/vol), pH 8.05 (Invitrogen, Carlsbad, USA), and 60 µL of the C1 solution. The mixture was vortexed at maximum speed for 5 min and then centrifuged at 15,000 × g for 2 min. Subsequently, 600 µL of the supernatant was transferred to a new collection tube, and 250 µL of the C2 and 200 µL of the C3 solutions were added simultaneously; the mixture was vortexed for 5 s, incubated on ice for 5 min, and then centrifuged for 1 min at 15,000 × g. Thereafter, 650 µL of the resulting supernatant was transferred to a new tube and mixed with an equal volume of the C4 solution and 100% ethanol. During the DNA binding and cleaning steps using the MB Spin Filter, the samples were centrifuged for 1 min at 15,000 × g; this step was repeated three times. An additional cleaning step was performed by adding 650 µL of 100% ethanol, followed by centrifugation for 1 min at 15,000 × g. Then, 500 µL of the C5 solution was added and centrifuged under the same conditions. The MB Spin columns were subsequently centrifuged for 2 min at 16,000 × g. Finally, the MB Spin columns were transferred to new tubes, and the DNA was eluted in 50 µL of the C6 solution, allowing an incubation of 2 min to ensure efficient elution from the membrane, followed by a final centrifugation at 15,000 × g for 1 min. Upon completion of the extraction, an additional purification step was carried out using the OneStep PCR Inhibitor Removal Kit (Zymo Research, Murphy Ave, Irvine, California), following the manufacturer’s standard protocol. DNA must be kept at −20°C or −80°C for long-term storage. The complete, step-by-step, optimized protocol for extracting DNA from swamp peat samples has been provided in Fig. 2, and the full protocol is available in the Supplementary Information (supplemental material is found at https://doi.org/10.6084/m9.figshare.30535631). The total time required to complete the protocol for 12 samples is approximately 60 min.
Step-by-step workflow of the optimized DNA extraction protocol for swamp peat samples. Figure created with BioRender.
Following DNA extraction with both protocols, we assessed DNA concentration and purity using three methods: electrophoresis on a 1% agarose gel, spectrophotometric analysis with a NanoDrop 2000c (260/280 ratio) (Thermo Fisher Scientific, Inc., Waltham, MA, USA), and fluorometric quantification with a Qubit Q32857 fluorometer using the dsDNA BR Assay Kit (Thermo Fisher Scientific, Inc., Waltham, MA, USA).
qPCR of the 16S rRNA genes of Archaea and Bacteria and the mcrA gene
To compare the efficiency of the conventional (CP) and optimized (OP) protocols, real-time PCR (qPCR) was used to quantify the copy number of archaeal and bacterial 16S rRNA genes, using the primer pairs 519F/915R for Archaea, Eub338F/Eub518R for Bacteria, and mlas-F/mcrA-R for mcrA. The primers’ references, sequences, and amplification conditions are available in Table 1. For each gene, a standard curve was created, containing from 10 to 10^10^ copies of the gene of interest, obtained previously using the conventional PCR in environmental samples, using a Gene Amp PCR System 9700 thermal cycler (Thermo Fisher Scientific, Inc., Waltham, MA, USA). For both genes, the qPCR for each sample was performed in the StepOnePlus instrument (Thermo Fisher Scientific, Inc., Waltham, MA, USA), with a final volume of 10 µL, containing 5 µL of SYBR Green ROX qPCR Master Mix (Thermo Fisher Scientific, Inc., Waltham, MA, USA), 1 µL of each primer (5 pmol), 0.2 µL of bovine serum albumin (BSA) (20 mg mL^−1^) (Thermo Fisher Scientific, Inc., Waltham, MA, USA), 1.8 µL of DNAse and RNAse-free water, and 1 µL of DNA. The samples were standardized to 10 ng/µL, while those with lower concentrations were kept at their original values. These values were used in the gene abundance calculations. The results of the qPCR quantification were analyzed using StepOne Software v2.3 (Thermo Fisher Scientific, Inc., Waltham, MA, USA), later exported as spreadsheets, and converted to the number of copies per gram of soil.
Data analysis
Statistical analyses and graphical visualizations were performed using RStudio 4.2.2. The results include DNA quantification using NanoDrop and Qubit, as well as qPCR analysis of 16S rRNA genes for total archaeal and bacterial communities and mcrA for methanogens. Data normality was assessed using the Shapiro-Wilk test, and the Kruskal-Wallis test was applied to compare protocols within each Depth and Site, with Bonferroni correction for multiple comparisons. All statistical analyses were conducted using the ggpubr package (version 0.6.0 [30]), while plots were generated with ggplot2 (version 3.0.0 [31]).
RESULTS AND DISCUSSION
Tropical peatlands play a crucial role in global biogeochemical cycles, particularly C and CH₄ dynamics (32). However, their microbial communities remain poorly understood, preventing our ability to fully comprehend their ecological functions and responses to environmental changes. Environmental DNA extraction from tropical peatlands presents significant challenges due to their high organic matter content, low pH, and the presence of PCR inhibitors, such as complex organic compounds commonly referred to as humic substances (16). Although commercial kits are designed for soil samples, they are not specifically adapted to the complex composition of tropical peat. These limitations often result in low DNA yield and compromised purity, underscoring the need for optimized extraction protocols tailored to these challenging conditions.
In the face of these demanding conditions, an optimized DNA extraction protocol (OP) was developed, resulting in a four times increase in DNA concentration compared to the conventional protocol (CP), as quantified by NanoDrop and Qubit measurements (Fig. 3; Table 2). On average, across all treatments, the total DNA yield increased from 750.8 to 1,591.7 ng (NanoDrop) and from 221.2 to 433.75 ng (Qubit). This improvement is attributed to key adaptations, including the initial peat sample weight (from 0.25 to 0.4 g) that increased the total amount of DNA being recovered (33), and the use of a phenol-chloroform-isoamyl alcohol solution, which enhanced protein solubilization and the removal of organic contaminants (34). Additionally, the sequential incorporation of solutions C2 and C3, both targeting similar organic and inorganic inhibitors, combined with an incubation step on ice, enhanced the precipitation of contaminants, thereby improving DNA purity and saving processing time. Furthermore, the additional ethanol wash contributed to improved DNA precipitation and more effective removal of impurities, as it prevents the dissolution of DNA that remains bound to the membrane while other sample components are washed away (35).
*(A) DNA quantification comparing the conventional (CP) and optimized (OP) protocols, measured using NanoDrop and Qubit across all samples. (B) NanoDrop and (C) Qubit quantifications considering the effects of the CP and OP on DNA yield, with comparisons across different profiles (P1 and P2) and depths (20–30 cm and 180–190 cm). Asterisks indicate statistically significant differences between treatments, determined by Kruskal-Wallis tests with Bonferroni correction (*P < 0.05, *P < 0.01, ns = not significant).
A final purification step using the OneStep PCR Inhibitor Removal Kit (Zymo Research, Murphy Ave, Irvine, California) was included to increase DNA purity. Accordingly, the 260/280 ratio obtained from NanoDrop, the optimal range of 1.8 ± 0.2, is expected to be an indicator of DNA purity (36). Although challenging, the OP improved DNA quality by increasing the number of samples within this range (Table 2). Additionally, agarose gel electrophoresis confirmed the higher yield and high quality of the extracted DNA, while also indicating the presence of RNA in OP samples (Fig. S2 [supplemental material is found at https://doi.org/10.6084/m9.figshare.30535631]). Although RNA extraction was not the primary objective, its co-extraction suggests that this protocol may be useful for future studies investigating active microbial communities in tropical peatlands. The co-extraction of DNA and RNA allows for a more comprehensive analysis of microbial composition and activity, crucial for understanding ecosystem dynamics (37). However, additional precautions should be taken to ensure RNA integrity for such applications, such as proper sample preservation for RNA integrity, strict RNase-free handling, immediate stabilization of RNA, and the use of DNase treatment to separate RNA from DNA (38).
Since the choice of DNA extraction method directly influences the purity and yield of nucleic acids, which in turn affects the accuracy of downstream molecular analyses (39), we evaluated the suitability of DNA extracted using the conventional and optimized protocols for qPCR-based quantifications. qPCR assays targeted bacterial and archaeal 16S rRNA genes. Furthermore, the mcrA gene was included in the analysis due to the high CH_4_ emissions characteristic of the study profiles, especially in P2 (Table S1 [supplemental material is found at https://doi.org/10.6084/m9.figshare.30535631]), which suggests a high abundance of methanogenic archaea in the samples. To mitigate potential PCR inhibition, BSA was added to the qPCR reactions. BSA is a transport protein that can interact with lipids and organic molecules, effectively minimizing different types of PCR inhibitors (40) and enhancing amplification efficiency in samples with inhibitory compounds (41). The assays exhibited high linearity (R^2^ > 0.94) with efficiencies ranging from 92% to 101%, confirming the reliability of the results. Figure 4 presents the quantification of the studied genes on a logarithmic scale, expressed as copies per gram of peat, while Table S2 (supplemental material is found at https://doi.org/10.6084/m9.figshare.30535631) provides the average of the gene quantification per treatment.
*qPCR analysis of (A) archaeal 16S rRNA, (B) bacterial 16S rRNA, and (C) mcrA genes, evaluating the effects of the conventional (CP) and optimized (OP) protocols on the gene’s quantification. Comparisons were performed across different profiles (P1 and P2) and depths (20–30 cm and 180–190 cm). Data are presented on a logarithmic scale (log). Asterisks indicate statistically significant differences between treatments, determined by Kruskal-Wallis tests with Bonferroni correction (*P < 0.05, *P < 0.01, ns = not significant).
The abundances of archaeal and bacterial 16S rRNA genes were significantly higher in OP (averaging 2.3 × 10^8^ and 6.0 × 10^9^ copies per g peat^−1^, for Archaea and Bacteria, respectively) compared to CP (2.9 × 10^7^ and 4.7 × 10^8^ copies per g peat^−1^, respectively) (Fig. 4A and B), with statistically significant differences across both profiles and depths (P < 0.05). Although mcrA gene abundance tended to be higher in OP (1.1 × 10^5^ in CP versus 2.2 × 10^5^ in OP), statistical significance was only observed at the 20–30 cm depth in P2 (Fig. 4C). Furthermore, qPCR results from OP exhibited a lower variation coefficient for the three studied genes among samples compared to CP (0.041 in CP versus 0.034 in OP for 16S rRNA Archaea, 0.022 in CP versus 0.019 in OP for 16S rRNA Bacteria, and 0.117 in CP versus 0.029 in OP for mcrA). Therefore, in addition to increasing DNA yield and quality, OP also enhanced reproducibility in downstream DNA analyses. This stability is particularly important for comparing microbial communities across treatments and environmental conditions, as it strengthens the reliability of observed trends and ecological interpretations (33). Importantly, Thermo Scientific (36) emphasizes that the most reliable indicator of DNA extraction quality is its performance in downstream applications. In this sense, the high-quality DNA extracted through OP is well-suited for metagenomic studies, enabling a broader exploration of microbial diversity and functional potential. Future metagenomic research using this optimized DNA extraction method can further investigate the role of microbial communities in biogeochemical cycles, particularly in relation to climate change.
Concluding remarks
The efficiency of the optimized protocol demonstrates its suitability for extracting high-quality DNA from tropical peat soils, overcoming common limitations associated with commercial extraction kits. While qPCR was used in this study to validate DNA quality, the extracted DNA is also suitable for high-throughput applications, such as metagenomics, expanding its potential for microbial community profiling. Additionally, the protocol showed promise for simultaneous DNA and RNA extraction, which is particularly valuable for studying both taxonomic composition and gene expression in microbial communities; however, further optimization of the co-extraction process will be necessary in future applications. The ability to obtain high-quality nucleic acids from tropical peatlands is crucial for advancing reliable research on microbial-driven biogeochemical processes, particularly in the context of climate change. Future investigations utilizing this optimized protocol can further explore the role of peatland microbiomes in ecosystem services, contributing to a better understanding of their ecological resilience and response to environmental disturbances.
The reference list from the paper itself. Each links out to its DOI / PubMed record.
- 1Bonn A, Allott T, Evans M, Joosten H, Stoneman R. 2016. Peatland restoration and ecosystem services: an introduction, p 1–16. In Peatland restoration and ecosystem services: science, policy and practice. Routledge, London, UK.
- 2Ribeiro K, Pacheco FS, Ferreira JW, de Sousa‐Neto ER, Hastie A, Krieger Filho GC, Alvalá PC, Forti MC, Ometto JP. 2021. Tropical peatlands and their contribution to the global carbon cycle and climate change. Glob Chang Biol 27:489–505. doi:10.1111/gcb.1540833070397 · doi ↗ · pubmed ↗
- 3Leifeld J, Menichetti L. 2018. The underappreciated potential of peatlands in global climate change mitigation strategies. Nat Commun 9:1071. doi:10.1038/s 41467-018-03406-629540695 PMC 5851997 · doi ↗ · pubmed ↗
- 4Clymo RS, Turunen J, Tolonen K. 1998. Carbon accumulation in peatland. Oikos 81:368. doi:10.2307/3547057 · doi ↗
- 5Xu J, Morris PJ, Liu J, Holden J. 2018. PEATMAP: Refining estimates of global peatland distribution based on a meta-analysis. Catena 160:134–140. doi:10.1016/j.catena.2017.09.010 · doi ↗
- 6Perryman CR, Bowen JC, Shahan J, Silviani P A B D, Dayanti E, Andriyani Y, Asyhari A, Gangga A, Novita N, Anshari GZ, Hoyt AM. 2024. Fate of methane in canals draining tropical peatlands. Nat Commun 15:9766. doi:10.1038/s 41467-024-54063-x 39528506 PMC 11555057 · doi ↗ · pubmed ↗
- 7Conrad R. 2020. Methane production in soil environments – anaerobic biogeochemistry and microbial life between flooding and desiccation. Microorganisms 8:881. doi:10.3390/microorganisms 806088132545191 PMC 7357154 · doi ↗ · pubmed ↗
- 8Wilmoth JL, Schaefer JK, Schlesinger DR, Roth SW, Hatcher PG, Shoemaker JK, Zhang X. 2021. The role of oxygen in stimulating methane production in wetlands. Glob Chang Biol 27:5831–5847. doi:10.1111/gcb.1583134409684 PMC 9291790 · doi ↗ · pubmed ↗