Exploring Biomarkers in Type 2 Diabetes Mellitus versus Normoglycemia Identified through High-Throughput Proteomics: A Systematic Review and Meta-Analysis
Julia García-Currás, Raquel Pérez-Lois, Guillermo L. Taboada, María P. Pata

TL;DR
This study reviews proteomic data from people with type 2 diabetes and healthy individuals to identify potential protein biomarkers and metabolic patterns linked to the disease.
Contribution
The study provides a systematic review and meta-analysis of proteomic biomarkers in T2D, identifying seven promising candidates and offering an interactive web tool for further exploration.
Findings
Eighty-five proteins were recurrently reported across multiple studies, involved in immune response, lipid metabolism, and coagulation pathways.
Seven protein biomarkers were identified through meta-analysis, linked to glucose/lipid metabolism, cell adhesion, and mitochondrial function.
Three biomarkers (ORM1, HP, AZGP1) showed consistent results across studies despite variability in effect sizes.
Abstract
Recent advances in proteomics have enabled the identification of early protein biomarkers and metabolic disturbances associated with type 2 diabetes (T2D), a major global health challenge. This systematic review and meta-analysis synthesize evidence from 27 studies comparing proteomic profiles of individuals with T2D and normoglycemic controls, selected from 2,422 initial records. The QUADOMICS assessment showed good methodological reporting for sample handling and proteomic analysis (>70% of studies), but over 60% lacked information on confounding clinical factors and biomarker validation. A qualitative synthesis focused on 85 recurrently reported proteins (≥8 studies), which showed strong interconnectivity and were involved in immune response, lipid–protein organization, detoxification, proteolysis, and coagulation, key pathways implicated in T2D. An omics-based meta-analysis…
Genes, proteins, chemicals, diseases, species, mutations and cell lines named across the full text — each resolved to its canonical identifier and authoritative record.
Click any figure to enlarge with its caption.
 1
1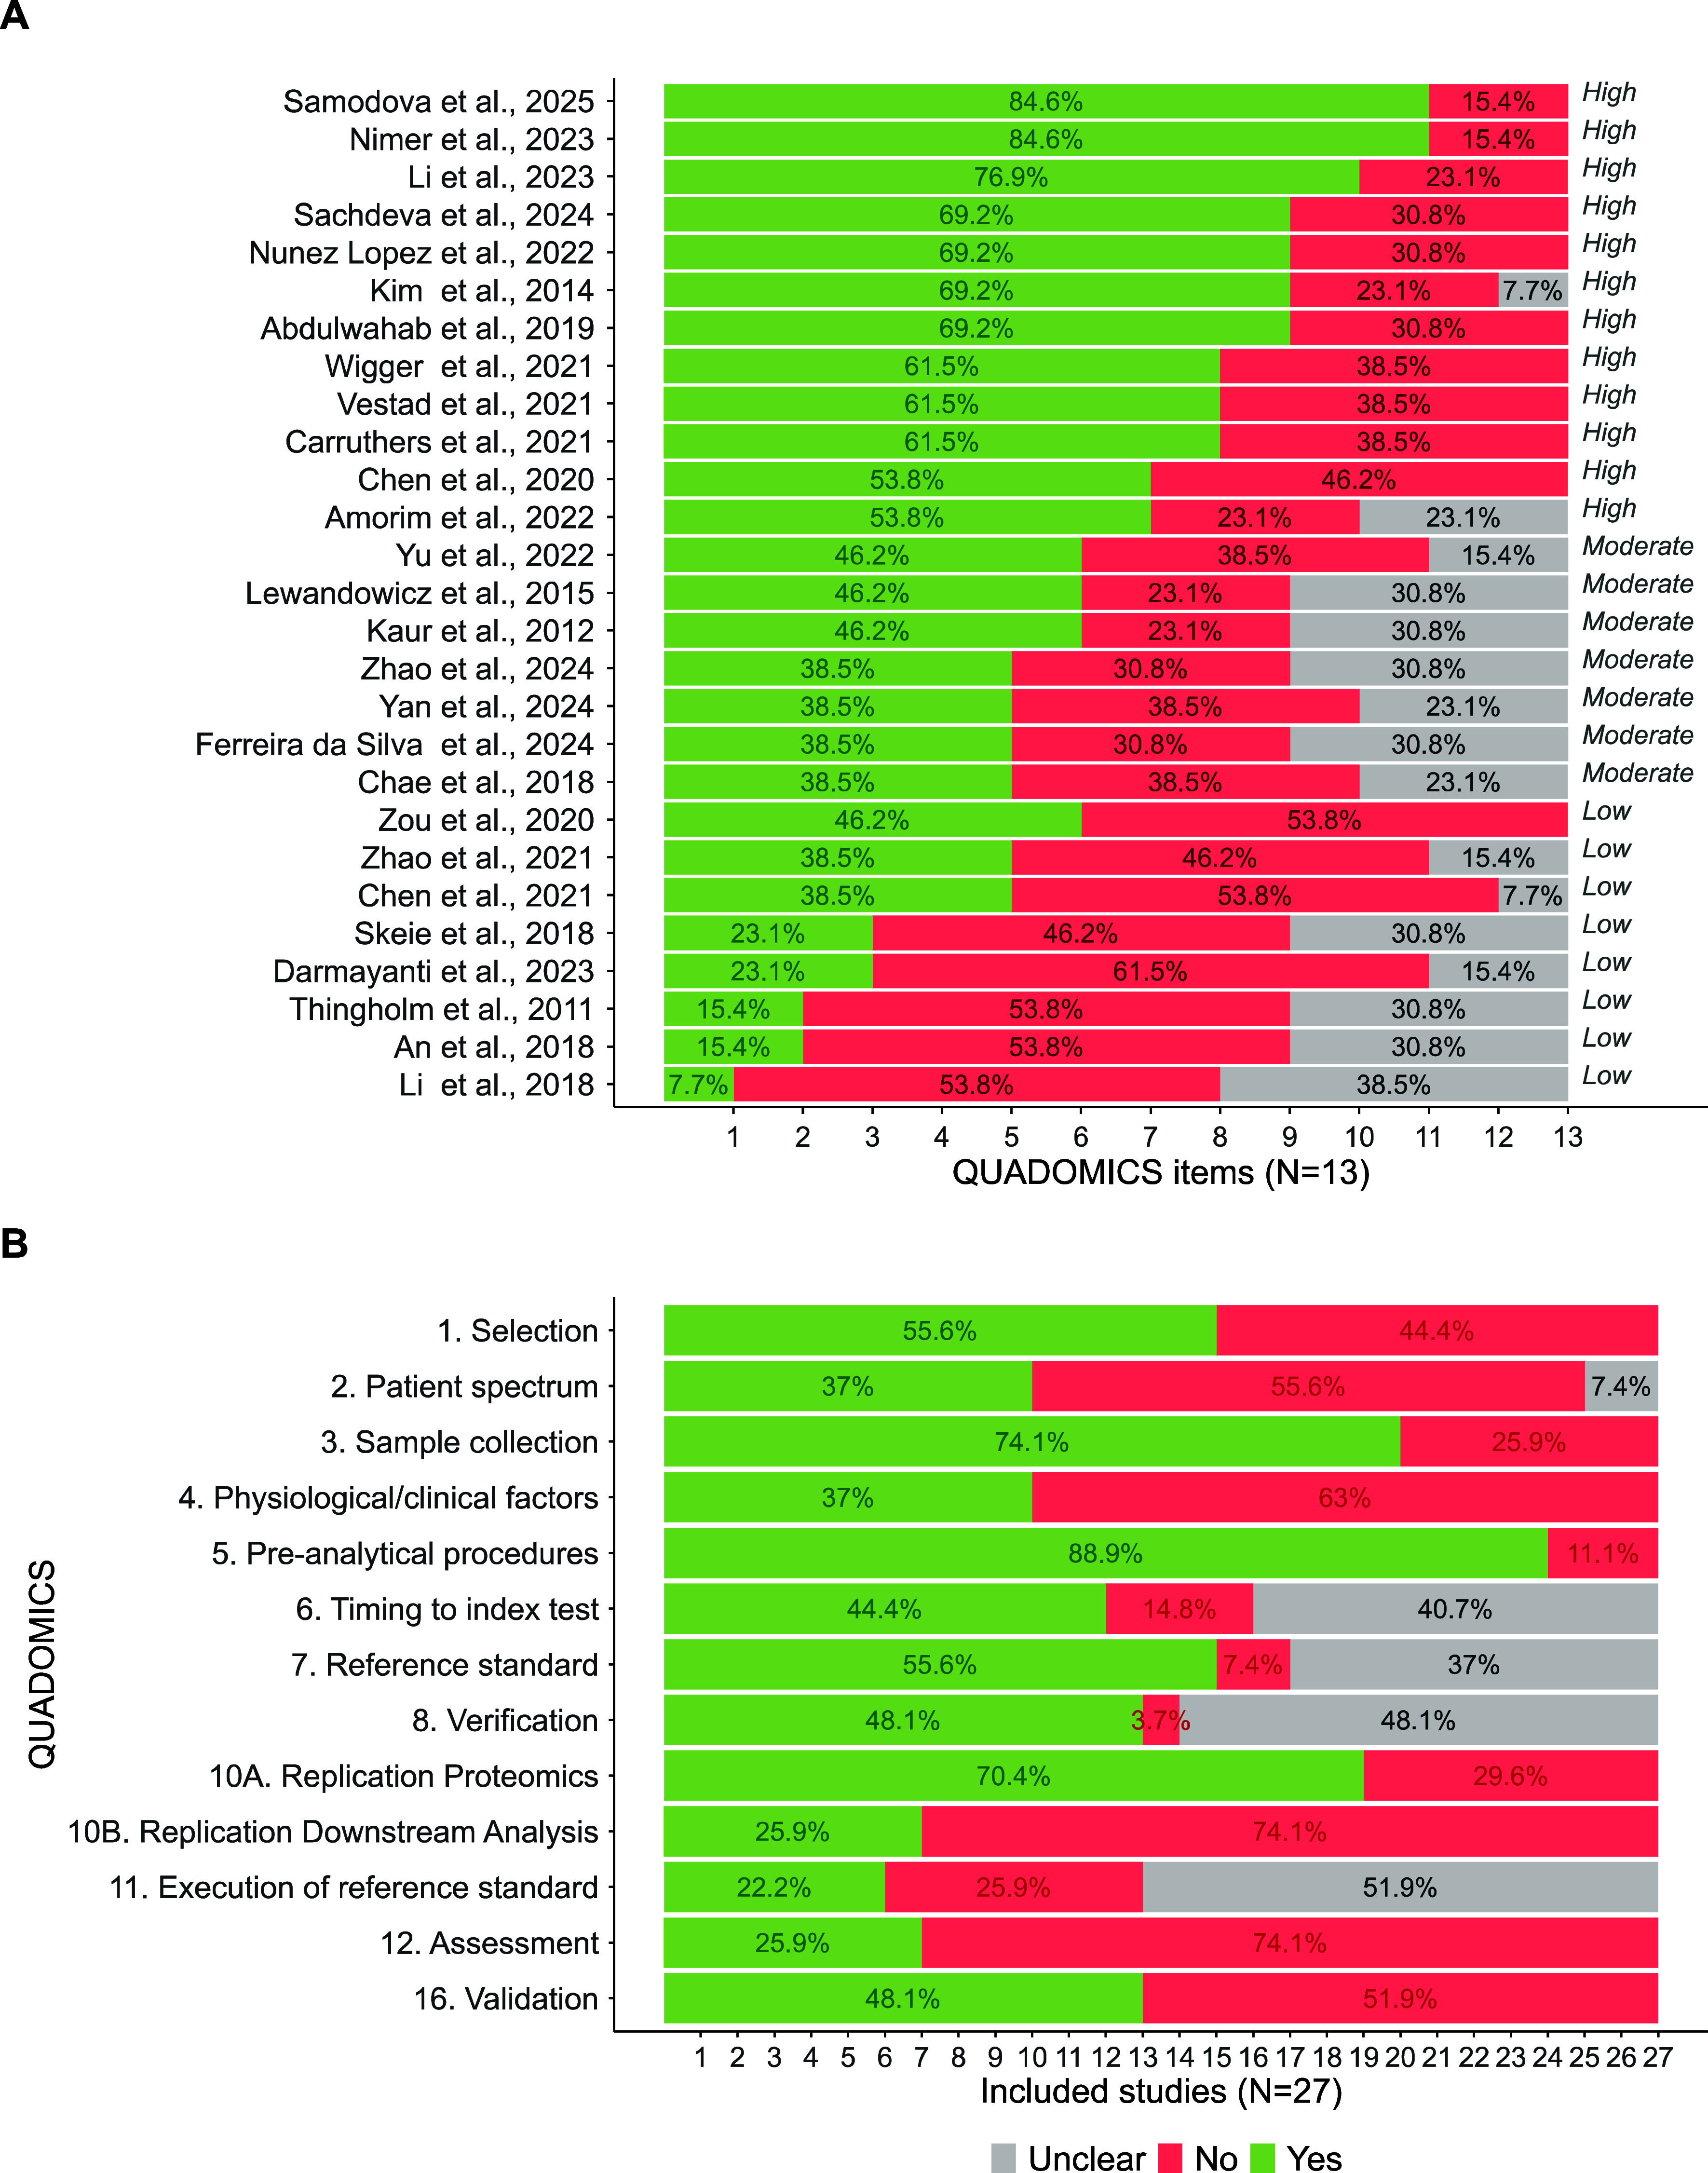 2
2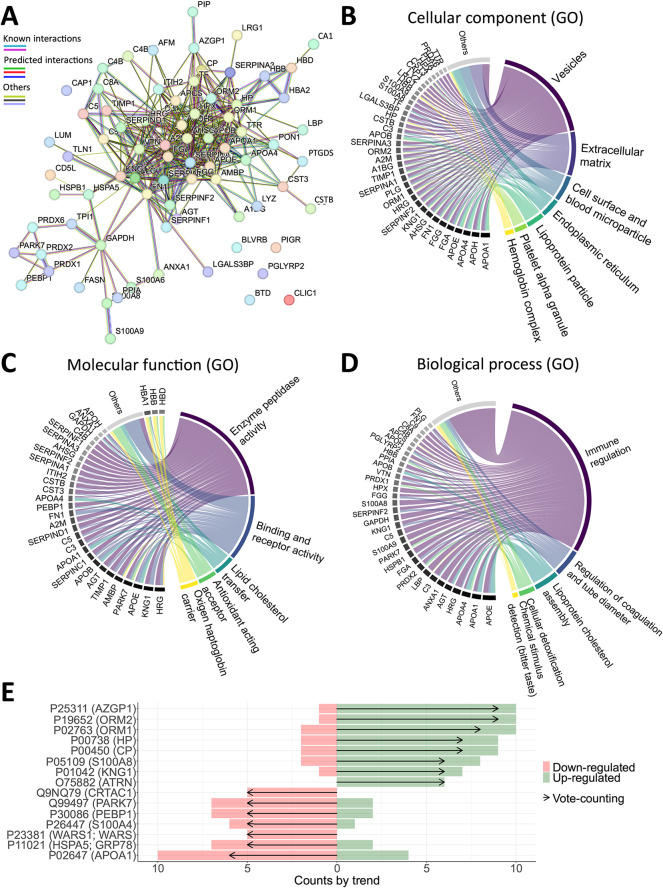 3
3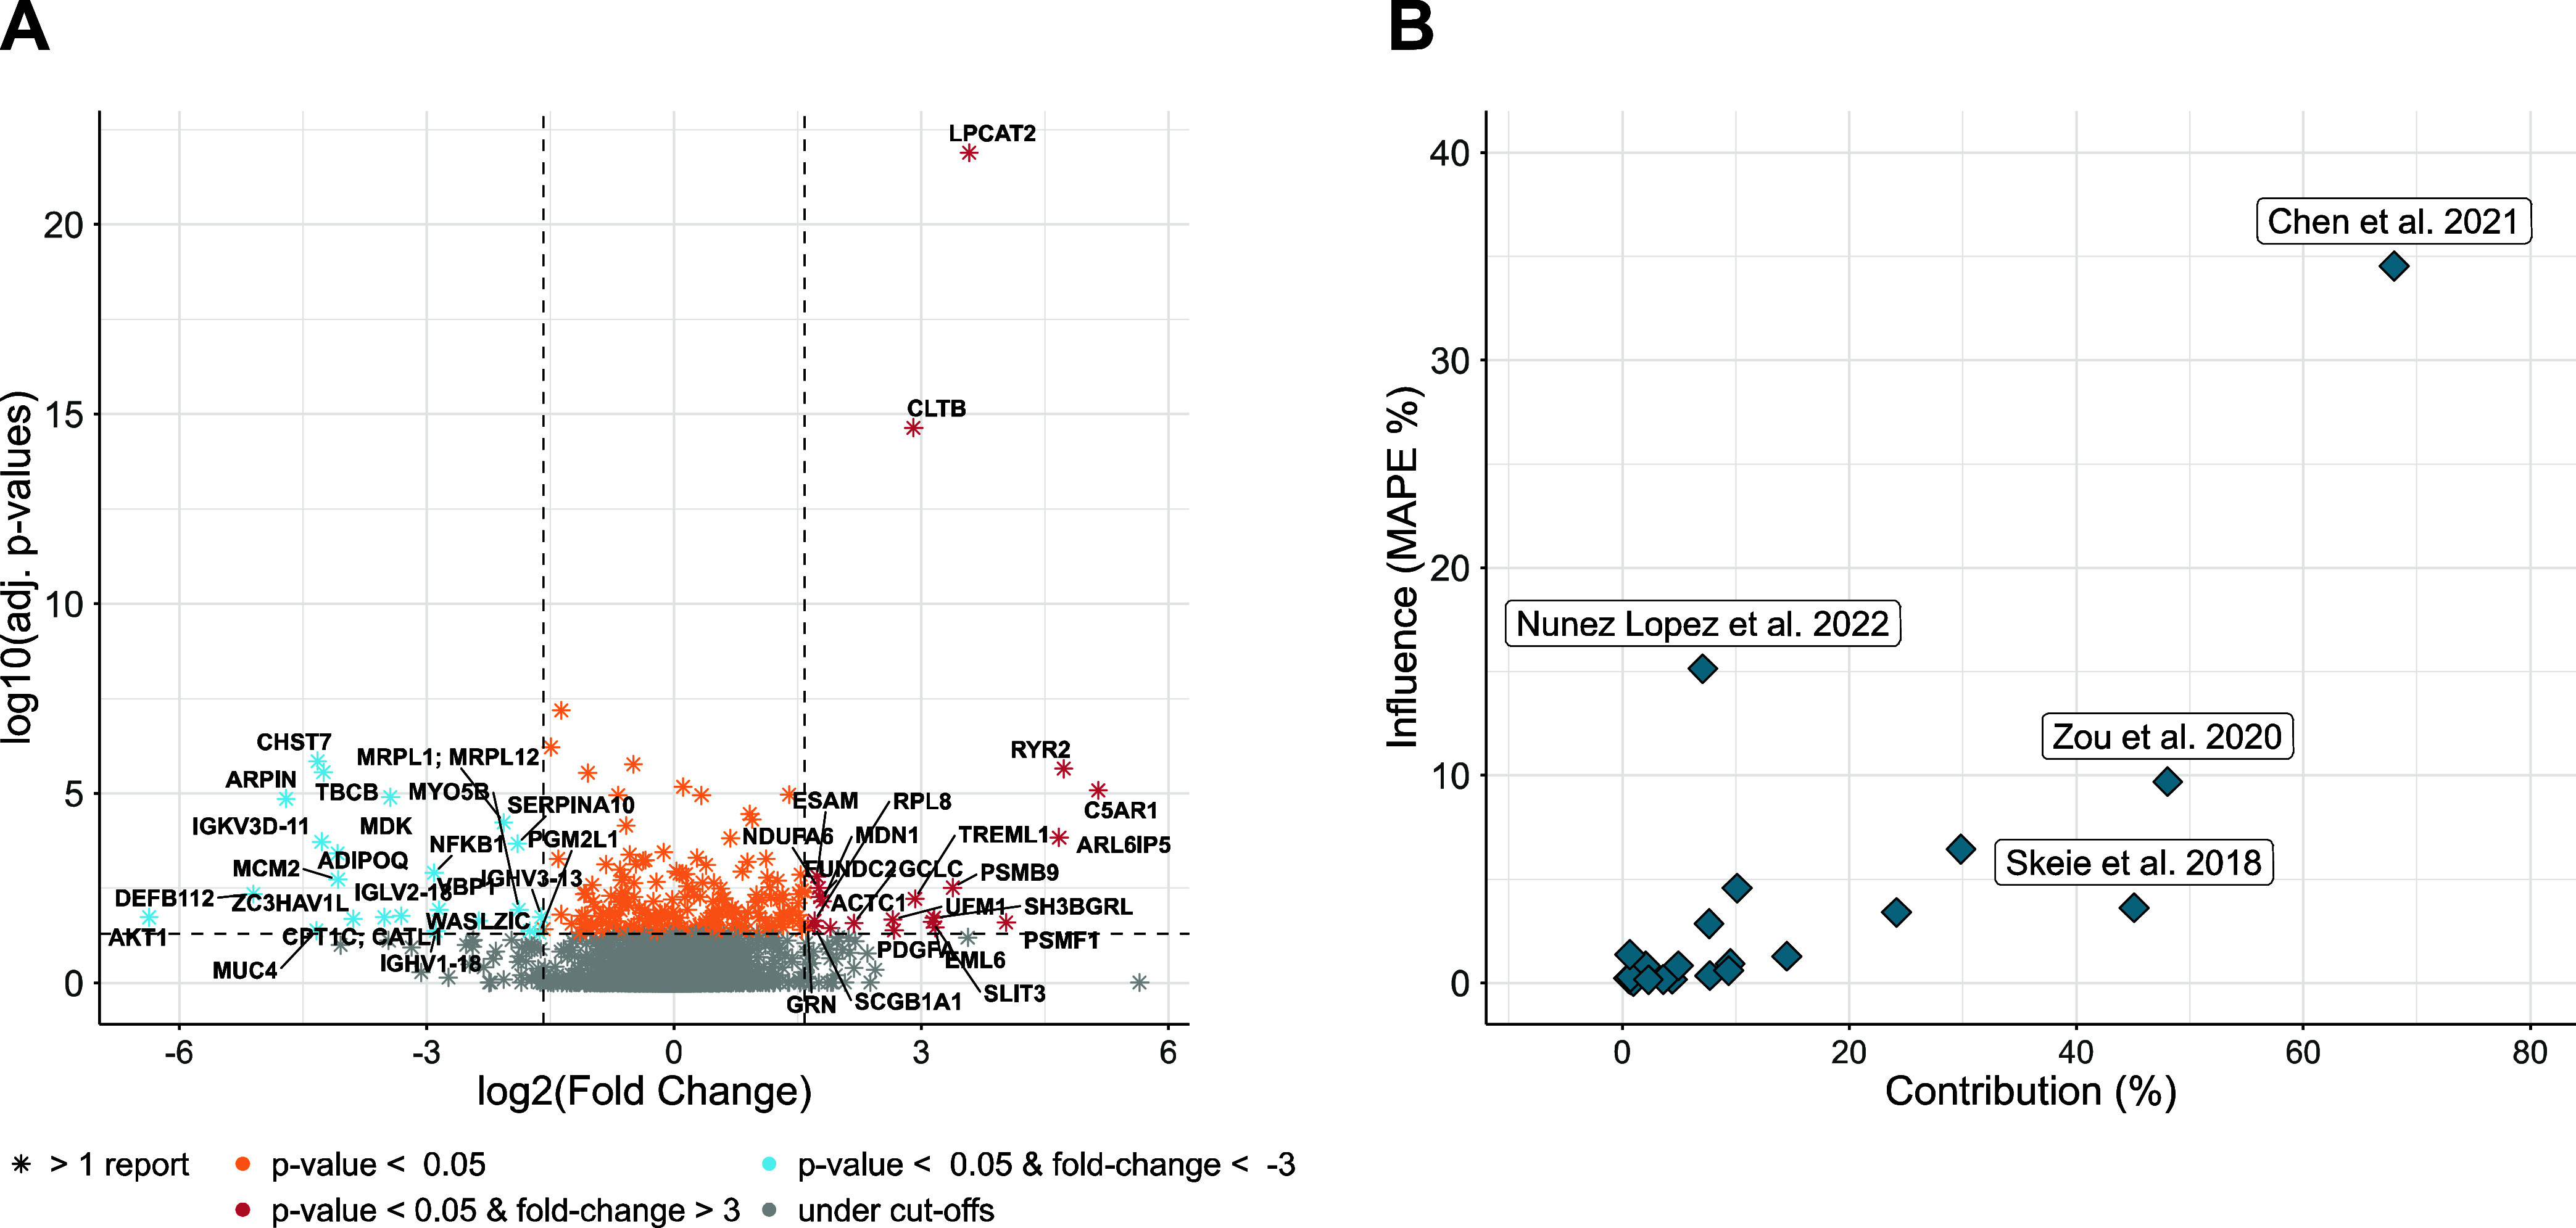 4
4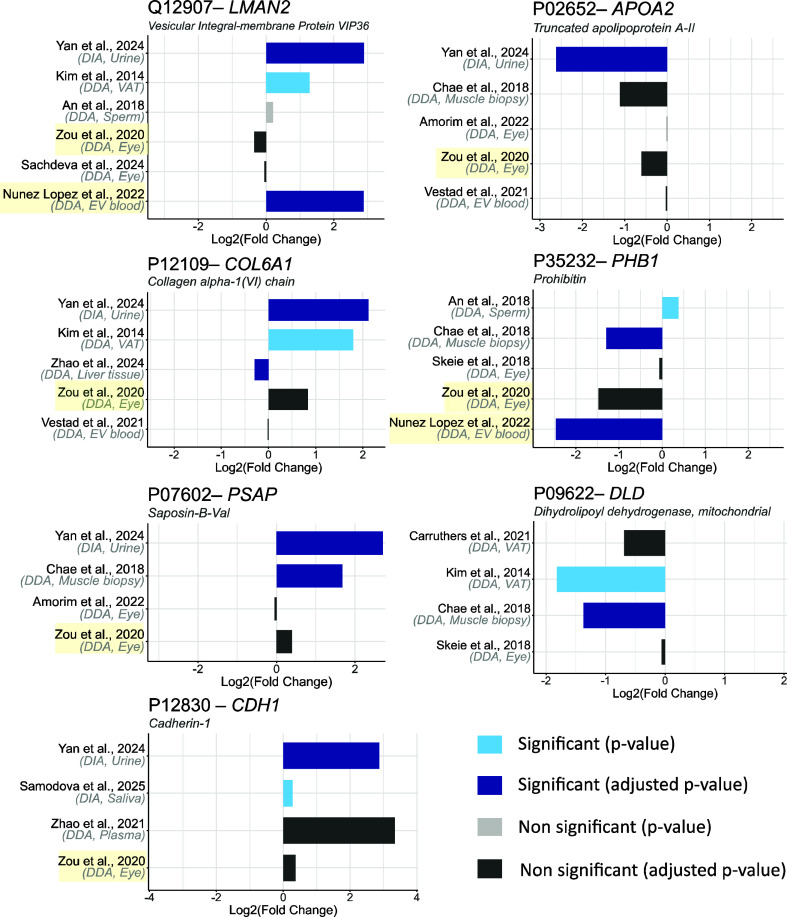 5
5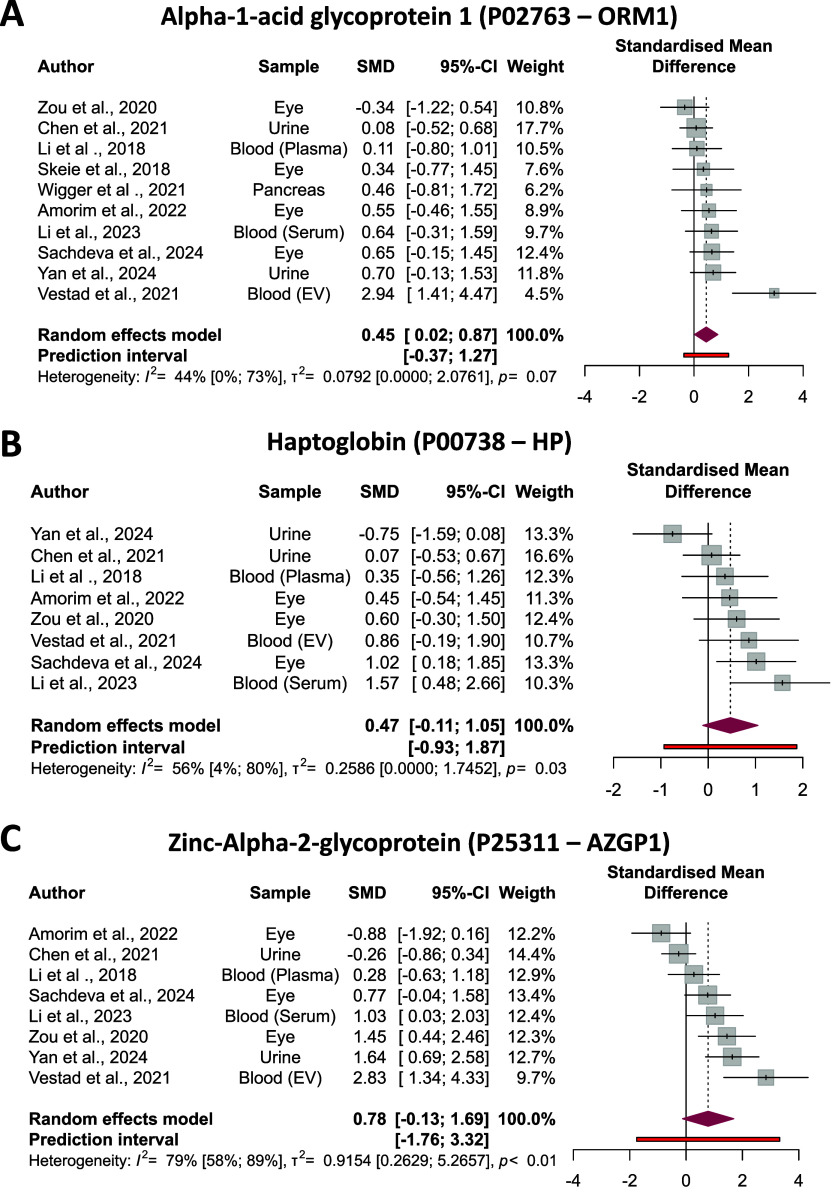 6
6| Reference | Country | Year | Target disease? | Mode | Type of sample | Sample size T2D | Sample size control | Raw data? |
|---|---|---|---|---|---|---|---|---|
| Li
et al., 2018 | China | 2018 | Obesity | DDA | Plasma | 10 | 9 | Yes |
| Zhao et al., 2021 | China | 2021 | T2D | DDA | Plasma | 8 | 8 | No |
| Yu et al., 2022 | China | 2022 | MCI | DDA | Plasma | 25 | 30 | No |
| Kaur et al., 2012 | USA | 2012 | T2D | DDA | Serum | 10 | 10 | No |
| Abdulwahab et al., 2019 | Bahrain | 2019 | T2D | DIA | Serum | 6 | 6 | No |
| Chen et al., 2020 | China | 2020 | MTS | DDA | Serum | 7 | 7 | No |
| Nimer et al., 2023 | Jordan | 2023 | T2D | DIA | Serum | 7 | 7 | No |
| Darmayanti et al., 2023 | Indonesia | 2023 | DN | DDA | Serum | 55 | 32 | No |
| Li et al., 2023 | China | 2023 | T2D | DDA | Serum | 9 | 9 | Yes |
| Vestad et al.,
2021 | Norway | 2021 | HIV | DDA | Extracellular vesicles (blood) | 9 | 7 | Yes |
| Nunez Lopez et al., 2022 | USA | 2022 | T2D | DDA | Extracellular vesicles (blood) | 10 | 10 | No |
| Skeie et al.,
2018 | USA | 2018 | T2D | DDA | Endothelium–Descemet membrane (eye) | 5 | 4 | Yes |
| Zou et al., 2020 | China | 2020 | Dry Eye | DDA | Tear (eye) | 10 | 10 | Yes |
| Amorim et al., 2022 | Portugal | 2022 | DR | DDA | Tear (eye) | 8 | 8 | Yes |
| Sachdeva
et al., 2024 | USA | 2024 | T2D | DDA | Aqueous humor (eye) | 11 | 15 | Yes |
| Lewandowicz et al., 2015 | Poland | 2015 | DN | DDA | Urine | 15 | 12 | No |
| Chen et al., 2021 | China | 2021 | DVD | DDA | Urine | 22 | 21 | Yes |
| Yan et al., 2024 | China | 2024 | DN | DIA | Urine | 12 | 12 | Yes |
| Thingholm et al., 2011 | Denmark | 2011 | T2D | DDA | Muscle biopsesmyotubes | 10 | 10 | No |
| Chae et al., 2018 | South Korea | 2018 | T2D | DDA | Muscle biopsesmitochondria | 9 | 9 | No |
| Ferreira da Silva et
al., 2024 | Brazil | 2024 | T2D | DIA | Saliva;Plasma | 11 | 29 | No |
| Samodova et al., 2025 | Denmark | 2025 | T2D | DIA | Saliva | 15 | 15 | No |
| Kim et al., 2014 | South Korea | 2013 | T2D | DDA | Visceral adipose tissue | 5 | 6 | No |
| Carruthers et al.,
2021 | USA | 2021 | T2D | DDA | Visceral adipose tissue | 10 | 10 | No |
| Zhao et al., 2024 | China | 2024 | T2D | DDA | Liver tissue | 3 | 3 | Yes |
| Wigger et al., 2021 | Germany | 2021 | T2D | DDA | Pancreatic island cells | 5 | 5 | Yes |
| An et al., 2018 | China | 2018 | T2D | DDA | Sperm | 6 | 6 | Yes |
| UniProt ID | Protein name | Gene symbol | Adj. | Log2 FC | GO annotations | (No. studies) References |
|---|---|---|---|---|---|---|
|
| Vesicular integral membrane protein (VIP36) |
| 0.041 | 1.196 | Protein binding (GO:0005515) | (6) Nunez Lopez et al., 2022; |
| Carbohydrate binding (GO:0030246) | ||||||
| D-mannose binding (GO:000557) | ||||||
|
| Truncated apolipoprotein A-II |
| 0.048 | –1.017 | Cholesterol homeostasis (GO:0042632) | (5) Chae et al.,
2018; |
| Response to glucose (GO:0009749) | ||||||
| Protein oxidation (GO:0018158) and stabilization (GO:0050821) | ||||||
|
| Collagen alpha-1(VI) chain |
| 0.023 | 1.108 | Protein binding (GO:0005515) | (5) Kim et
al., 2014; |
| Collagen binding (GO:0005518) | ||||||
| Platelet-derived growth factor binding (GO:0048407) | ||||||
|
| Prohibitin |
| 0.027 | –1.244 | Regulation of DNA-templated transcription (GO:0006355) | (5) Chae et al., 2018; |
| Positive regulation of complement activation (GO:0045917) | ||||||
| Antiviral innate immune response (GO:0140374) | ||||||
| Mitochondrion organization (GO:0007005) | ||||||
|
| Saposin-B-Val |
| 0.004 | 1.314 | Positive regulation of β-galactosidase activity (GO:1903771) | (4) Chae et al., 2018; |
| Lysosomal transport (GO:0007041) | ||||||
| Ganglioside GM1 transport to membrane (GO:1905572) | ||||||
|
| Dihydrolipoyl dehydrogenase, mitochondrial |
| 0.038 | –1.019 | Dihydrolipoyl dehydrogenase (NADH) activity (GO:0004148) | (4) Chae et
al., 2018; |
| Protein binding (GO:0005515) | ||||||
|
| Cadherin-1 |
| 0.001 | 1.534 | Positive regulation of protein localization (GO:1903829) | (4) Samodova
et al., 2025; |
| Cell–cell adhesion (GO:1903829) | ||||||
| Regulation of gene expression (GO:0010468) | ||||||
| Positive regulation DNA-templated transcription (GO:0045893) |
- —Axencia Galega de Innovaci??n10.13039/501100010769
- —Universidade da Coru??a10.13039/501100014597
Peer Reviews
No public reviews on file for this paper yet. If you reviewed it on a platform where reviews are public (OpenReview, ICLR, NeurIPS, ICML), you can paste yours below so the community can read it here.
Videos
No videos yet. Explain this paper in a talk, walkthrough, or lecture? Add one.
Taxonomy
TopicsAdipokines, Inflammation, and Metabolic Diseases · Metabolomics and Mass Spectrometry Studies · Clusterin in disease pathology
Introduction
Type 2 diabetes (T2D) is a complex and progressive metabolic disorder characterized by persistent hyperglycemia, resulting from insulin resistance and progressive pancreatic β-cell dysfunction.? Representing approximately 90% of all diabetes cases worldwide, T2D has reached epidemic proportions, mainly driven by population aging, sedentary lifestyles, and poor dietary habits.? The latest report from the International Diabetes Federation indicates that over 589 million adults aged 20–79 are currently living with diabetes, a number projected to exceed 850 million by 2050.? T2D is associated with a high risk of microvascular complications (retinopathy, nephropathy, neuropathy) and macrovascular conditions (coronary heart disease, stroke), significantly increasing premature mortality and healthcare costs. ?−? ? ? ? ? Despite advancements in therapeutics, early detection and prevention remain critical challenges, especially given that the metabolic alterations underlying the disease may begin years before a clinical diagnosis is established. ?,? Due to this prolonged asymptomatic phase, there is an urgent need for reliable biomarkers capable of identifying at-risk individuals before irreversible metabolic damage occurs.
Biomarkers are measurable indicators of biological processes, disease states, and therapeutic responses. Given T2D’s primarily environmental etiology and the significant improvement of proteomic technologies in recent years, proteins represent especially promising biomarker candidates. As functional executors of cellular processes, proteins may reflect early pathophysiological changes and serve as potential therapeutic targets. Protein biomarker research in T2D has been widely explored and generally involves a comprehensive proteome screening of target tissues, followed by differential abundance analysis (DAA) to identify dysregulated or disease-specific proteins associated with T2D. In this context, targeted techniques such as ELISA (Enzyme-Linked Immunosorbent Assay), Western blotting, immunoprecipitation assays, or SRM/MRM (Selected/Multiple Reaction Monitoring) MS (Mass Spectrometry) are valuable for validation, but their limited scope makes them unsuitable for discovery-phase studies.? Traditional proteomic methods for biomarker discovery typically involved two-dimensional electrophoresis (2-DE) or liquid chromatography (LC) for protein separation, followed by identification using Matrix-Assisted Laser Desorption/Ionization (MALDI) MS or Surface-Enhanced Laser Desorption/Ionization (SELDI) MS. ?−? ? ? ? ? However, these early approaches had considerable limitations, as they only enabled the identification of a small subset of proteins associated with T2D. Although an additional quantification step was included using gel staining ?−? ? ? or differential fluorescence labeling (two-dimensional difference gel electrophoresis or 2D-DIGE) ?−? ? ? to identify differentially abundant proteins, detection remained restricted to a limited number of molecules. In recent years, more sensitive targeted proteomic platforms such as Olink, a proximity extension assay that uses qPCR for protein quantification, ?−? ? ? and SomaScan, which relies on modified DNA aptamers that selectively bind proteins whose abundance is quantified via DNA arrays, qPCR, or sequencing, ?−? ? ? ? ? have allowed for deeper proteomic exploration. Despite their broader coverage, these are still targeted proteomic approaches: target proteins are selected prior to analysis, provided that specific antibodies or aptamers are available. Shotgun proteomics, a high-throughput and untargeted approach, has greatly expanded protein identification capacity.? Operating in data-dependent acquisition (DDA) mode, shotgun involves selecting the most abundant precursor ions in the MS1 scan for MS2 spectra recording,? which limits reproducibility and the detection of low-abundance proteins. These challenges are addressed by label-free data-independent acquisition (DIA) methods, which perform a windowed full fragmentation of precursor ions in MS2,? offering a promising alternative for T2D biomarker discovery. The DIA approach enhances reproducibility and consistency across samples by avoiding precursor ion selection bias and enabling comprehensive, untargeted proteome coverage. However, this method requires individual sample analysis, increasing costs, and being a relatively recent approach, few studies applying DIA for T2D biomarker discovery exist to date, with none published before 2015.? Considering both methodological strengths and limitations, shotgun and DIA-based proteomics currently offer the most comprehensive and informative strategies for identifying protein biomarkers in T2D. Their broad proteome coverage and their enhanced ability to capture multiple proteins provide valuable insights into the disease’s complex pathogenesis.
Although launching another primary study might seem a logical next step, the growing number of individual reports risks contributing to fragmentation rather than synthesis. Without integration, the proliferation of candidate biomarkers can delay translation from discovery into clinical application, particularly in the form of validated multibiomarker panels.? As proposed by Tans et al., 2018,? such a panel should integrate diverse biomarkers across omics layers (transcriptomics, metabolomics, proteomics), reflecting key systemic changes in T2D and integrated via systems biology models. Achieving this ambitious aim requires first integrating biomarkers within each omics dimension to better understand primary alterations and highlight the most representative markers. In this context, proteomic reviews of T2D biomarkers are essential to consolidating knowledge and providing a comprehensive overview of individual studies. Although a relevant number of reviews on T2D proteomic biomarker discovery are available in the literature, ?−? ? ? ? ? ? many adopt a narrative format without applying strict inclusion criteria, which can make it more challenging to assess the strength of the evidence. In some cases, data from different organisms or sample types are discussed together, ?,? which may lead to misinterpretation if those distinctions are not explicitly stated. Additionally, key methodological details such as the characteristics of the control groups or the direction and magnitude of biomarker changes are not always reported, potentially limiting cross-study comparability. ?,?,?,? In contrast, quantitative meta-analyses offer a rigorous, transparent framework to identify the most consistent and statistically robust biomarkers. Yet, such analyses remain rare for proteomic T2D studies. A search in the PROSPERO database reveals few registered entries in this domain.? One key barrier has been data availability: many proteomic studies report only summary statistics (e.g., fold change (FC), p-values from DAA) for a subset of detected proteins without making raw data accessible. Recently, Llambrich et al., 2022? developed a novel aggregation method, implemented in the Amanida R package, which overcomes these challenges by leveraging available metrics and weighting them by study sample sizes to enable more robust meta-analytic integration, maximizing the use of available proteomic data.
In this study, we address the urgent need for evidence integration in T2D proteomics by conducting a systematic review and meta-analysis focused on differentially abundant proteins between individuals with T2D and normoglycemic controls. We include only nontargeted high-throughput proteomic studies employing comprehensive acquisition strategies, particularly shotgun and DIA-based approaches. Through a combination of a rigorous study selection process with both qualitative synthesis and quantitative aggregation, our goal is to identify robust and reproducible protein biomarkers, detect key altered pathways in T2D, and support the development of clinically relevant multibiomarker panels.
Methods
Study Design
A systematic review and meta-analysis were conducted to address the following research question incorporating all PICO (Population, Intervention, Comparison, Outcome) components: Which proteins exhibit differential abundance between individuals with type 2 diabetes and normoglycemic controls, as identified through high-throughput proteomic analysis? A detailed protocol was registered in PROSPERO? (CRD42025648346) prior to the analysis, and the review was conducted in accordance with the PRISMA guidelines.
Search Strategy
Two consecutive searches were conducted in the following databases: PubMed Central (PMC), Scopus, and Web of Science (WOS). The first search (February 12, 2025) was used to refine the initial search strategy, followed by a final search using a more precise equation (February 13–14, 2025). For the refinement strategy,? results from the first search were used to identify additional relevant terms (from titles, abstracts, and keywords) (Supplementary Table S1). These terms were then manually grouped, selected, and incorporated into the final search equation (Supplementary Table S2).
Study Selection
PubMed references downloaded in CSV format included only limited article information, lacking key data necessary for screening such as abstracts. While the PubMed format contains all information for each article, it is not structured as a table, making it difficult to work with. To convert the PubMed format into a tabular structure, a web application (pubmedToCsv) was developed,? and this final table can be downloaded in CSV format.
Individual results for the three databases were merged, and duplicate studies were removed using the DOI as the primary identifier. Study selection was conducted with meticulous attention to the inclusion and exclusion criteria defined in Supplementary Table S3. All articles involving both a T2D group and a control group were considered in the selection process, even if the primary focus of the study was a different condition (e.g., diabetic retinopathy (DR), diabetic nephropathy (DN)). After a first screening round, a subset of 185 studies was independently reviewed by two researchers, ensuring the thoroughness and validity of our results.
Data Extraction
The main outcome of the meta-analysis was a list of proteins from each study, including FC and p-values, which were extracted directly from the articles. Additional data were also collected, including publication details, study design, proteomic methods, statistical analysis, and group information (demographic and clinical variables). Study investigators were contacted to obtain unreported primary outcomes. For all other variables, missing data directly impacted study quality in the risk of bias assessment. Some articles analyzed both proteomic and phosphoproteomic or glycoproteomic data; however, only proteomic data were included in this systematic review.
Quality Assessment
QUADOMICS tool,? adapted from the QUADS tool for omics-based studies, was used to assess the quality and risk of bias in the included studies (Supplementary Table S4).
Data Processing
Due to inconsistent protein naming conventions across studies, we recognized the need for standardization and made this a transparent part of our research process. UniProt identifiers were used to enhance comparability across studies due to the ambiguity and variability of protein names. For articles that did not report UniProt identifiers, protein names were mapped to UniProt entries using the UniProt web-based mapping tool.? Proteins without the corresponding UniProt identifier were excluded from the analysis. Since each protein identifier had to be unique within each study, an aggregation method based on the average FC and p-values was applied for each unique UniProt ID in two studies. For some studies, reanalysis of raw data was necessary due to the absence of results for our target groups, either fully or partially. When downstream analysis information was available, this process was reproduced accordingly. Details of the reanalysis procedures are fully described in Supplementary Table S5.
Qualitative Assessment
To achieve a global understanding of the results, interaction networks between pairs of interesting proteins were generated using the STRING database,? considering only strong interactions (score >0.7). Overrepresentation analysis (ORA) was performed using Gene Ontology (GO) databases to interpret the results at a functional level, ?,? followed by semantic clustering of the functional terms.? A vote-counting analysis was computed for each shared protein, considering its direction of change for differential abundance between T2D and control groups.?
Omics-Based Meta-Analysis
Protein outcomes (FC, p-values) were provided in some studies as adjusted p-values or log_2_-transformed FC (log_2_ FC). A general p-value adjustment was applied to data sets that only provided raw p-values, using the Benjamini–Hochberg correction and the total number of proteins involved in the comparison (retrieved from the corresponding articles). Both FC and log_2_ FC were estimated.
Proteins identified in at least two studies were selected, and their FC and adjusted p-values were aggregated, considering the group size using a weighted p-value combination as a variant of Fisher’s method and a weighted average of the log_2_ FC, respectively. Both approaches are implemented in the Amanida R package.?
The contribution of each study was determined by calculating the percentage of proteins from that study relative to the total number of proteins involved in the aggregation. To assess the influence of individual studies on the results of this omics-based meta-analysis, an influence analysis was performed: data were reanalyzed repeatedly, each time excluding one study, followed by the calculation of the Mean Absolute Percentage Error (MAPE) between the new FC and the original FC (previously estimated using all studies). This calculation was performed only for the subset of proteins included in each reanalysis. Higher MAPE values indicate greater differences between the aggregated log_2_ FC from the full meta-analysis and those from the leave-one-out study subsets.
Random-Effects Meta-Analysis
Only studies that provided raw data were involved in the random-effects meta-analysis. Given the large number of proteins shared by at least two studies, only a subset of relevant and frequently reported proteins was analyzed. To select these, a list of relevant proteins explicitly mentioned in the included studies was compiled (Supplementary Table S6). Proteins from this list that were shared by more than two-thirds of the studies were selected for the meta-analysis.
Standardized Mean Difference (SMD) was selected as the effect size measure.? A random-effects model with restricted maximum likelihood estimation was fitted to obtain the pooled SMD to explore potential differences between the T2D and control groups for each protein.? Confidence intervals (CIs) (95%) for the pooled effect and individual measures were estimated. The heterogeneity between studies was assessed by τ^2^ and Higgins’ I ^2^ statistic,? representing how much of the total variance could be attributed to the total amount of heterogeneity, with values ranging from 0 (all heterogeneity due to sampling variance) to 100 (all the variability due to heterogeneity between clusters). The goodness of fit was evaluated by sensitivity analyses based on outlier and influential case diagnostics plots (standardized residuals, hat values, and Cook’s distance).? The assessment of publication bias was evaluated through contour-enhanced funnel plots.? These plots show areas of statistical significance on a funnel plot (contours representing conventional levels of statistical significance: p-value <0.01, p-value <0.05, p-value <0.1), with effect sizes and standard errors on the two axes of the plot. Meta-analysis results are presented as a forest plot.
Software
All analyses were performed using R software version 4.4.1? with the following packages: litsearchr,? shiny,? esc, ? meta, ? rbioapi, ? clusterProfiler, ? AnnotationDbi, ? and GOSemSim. ? All codes are available in the GitHub repository for this systematic review: https://github.com/juliagcurras/metaanalysisT2D.
Results
Search Results
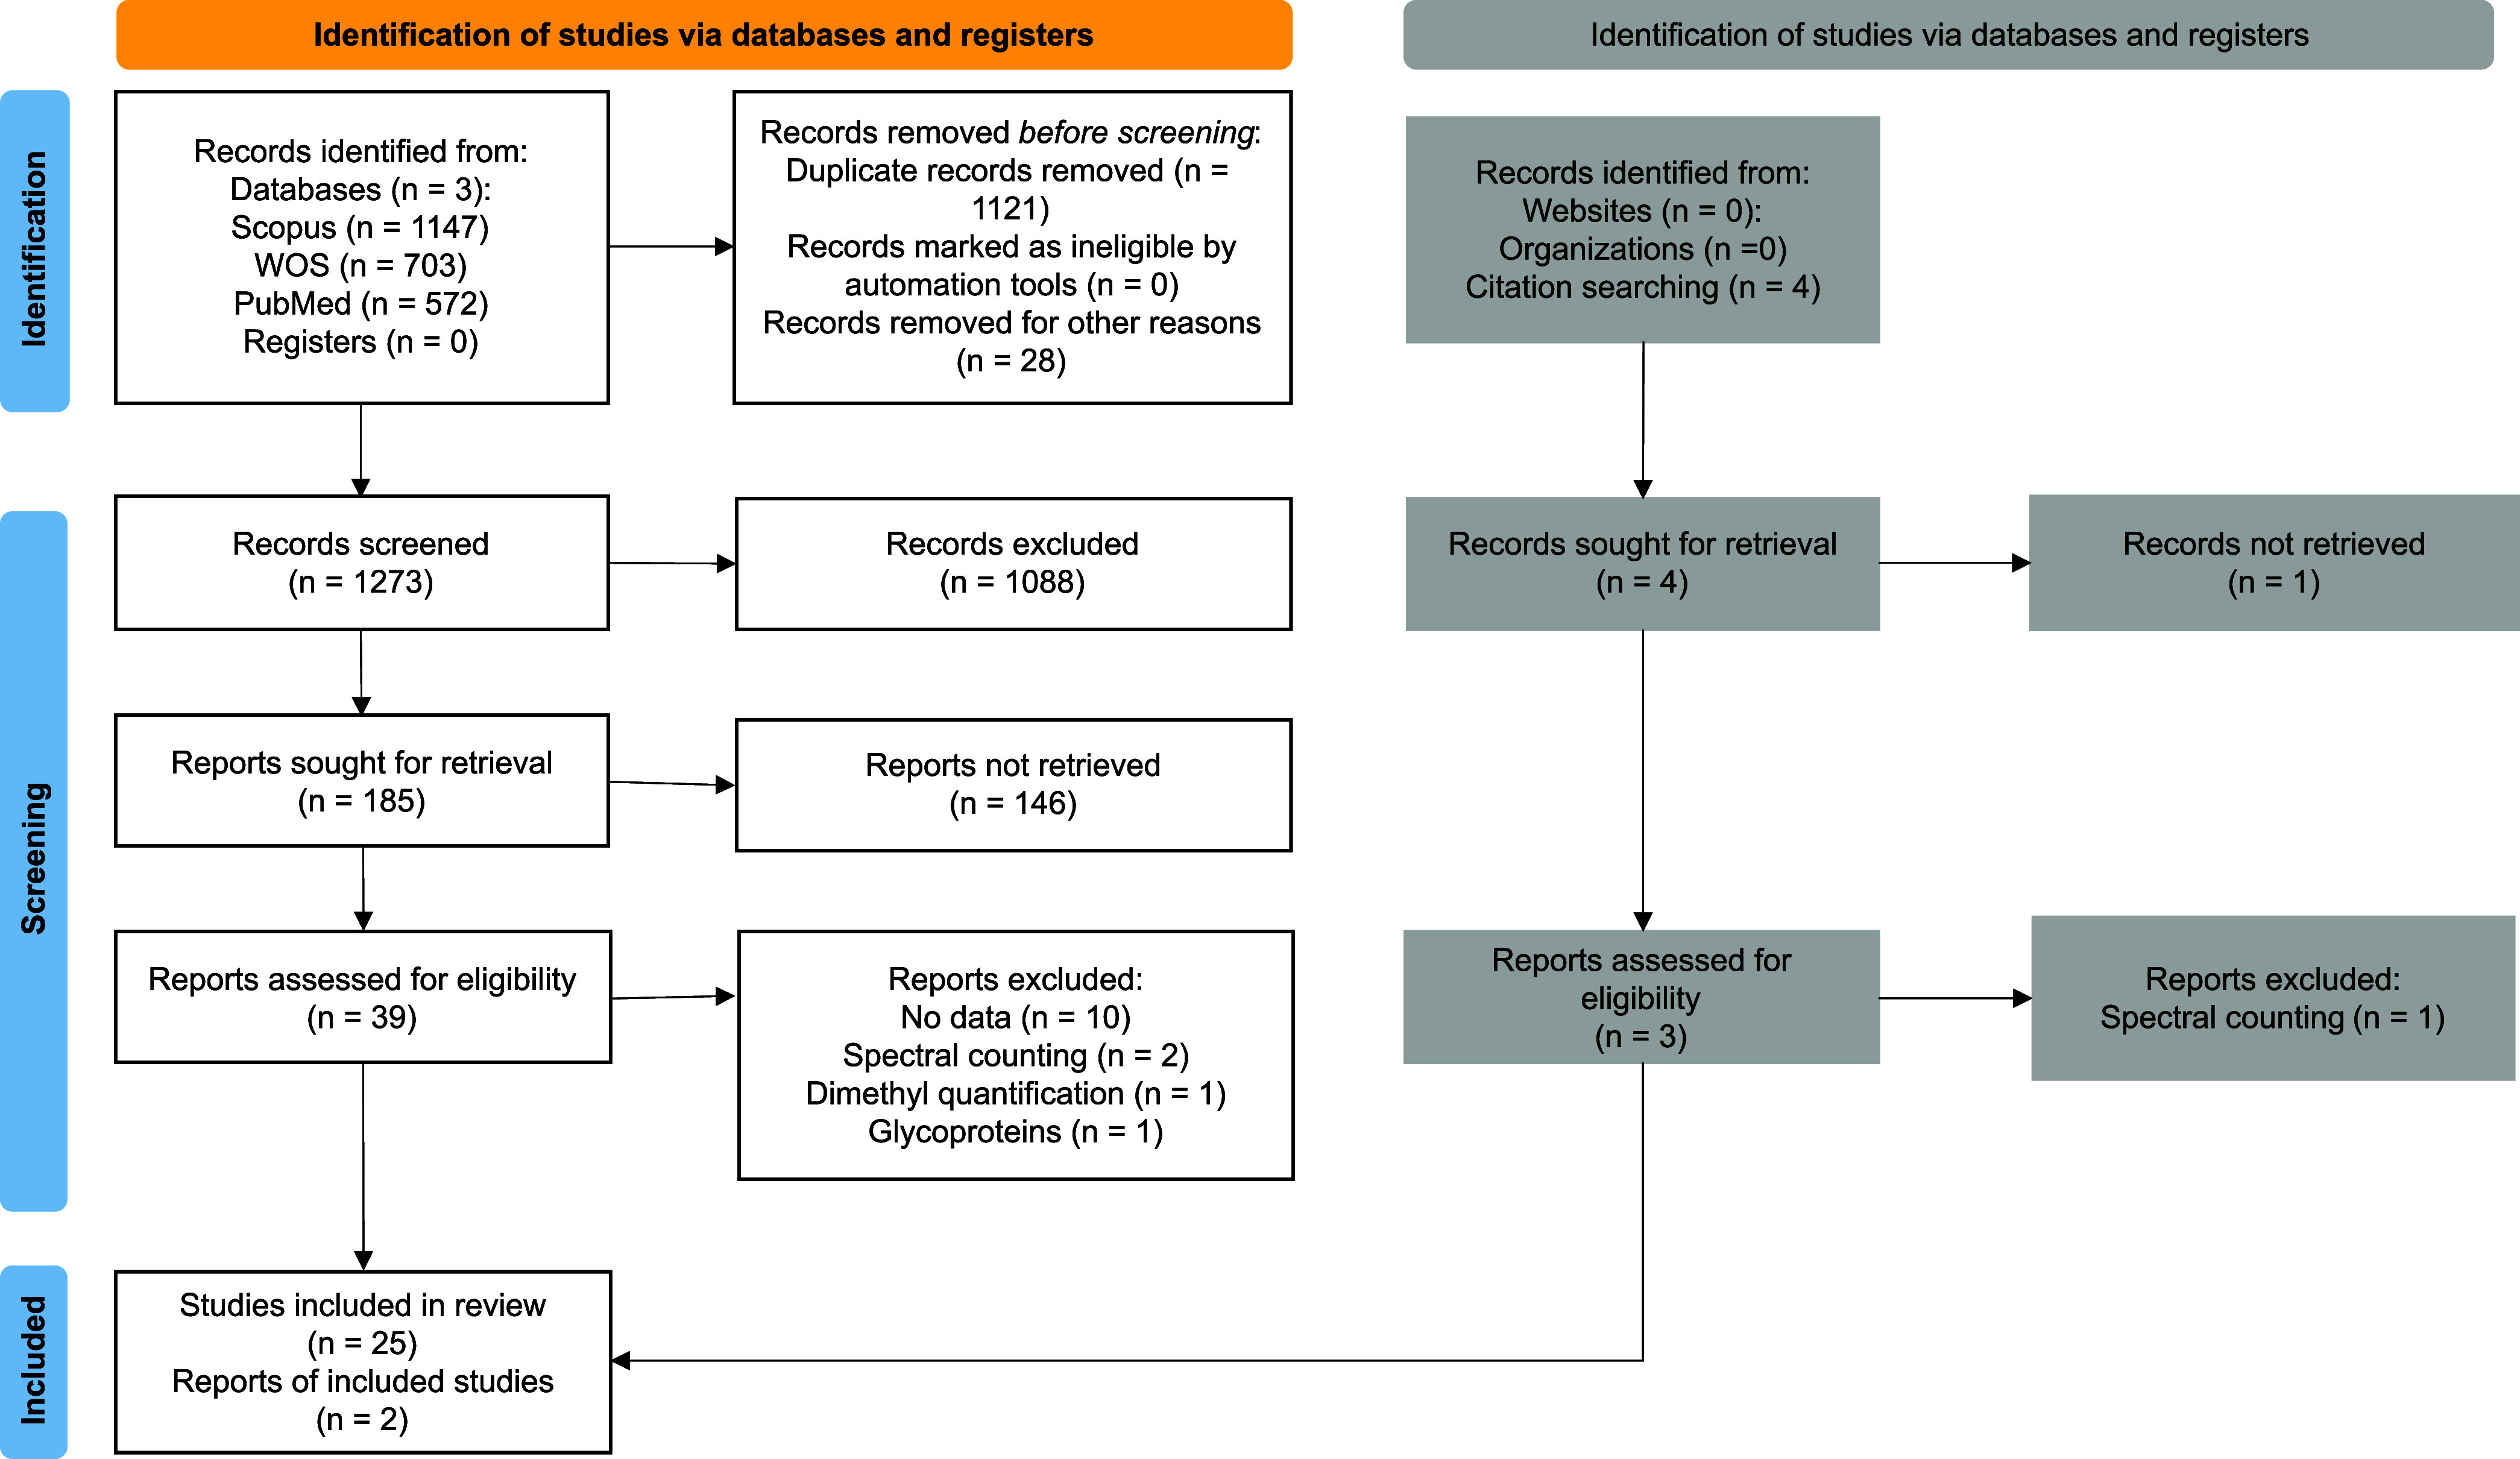
Refinement of the search equation increased the total number of retrieved articles from 969 in the initial search to 2,422 articles in the final search across the three databases (Supplementary Table S7). After removing duplicates based on DOI, 1,273 unique records remained for initial screening, with 505 articles identified as overlapping across the three databases (Supplementary Figure S1). Subsequently, 185 articles underwent full peer review. Following eligibility criteria, 25 studies were finally selected, with a high interreviewer agreement (concordance index = 0.705, p < 0.001, Supplementary Table S8). Two additional studies were identified through reference snowballing, yielding a final total of 27 included articles. The complete selection workflow is summarized in the PRISMA diagram (Figure), and the main characteristics of the 27 included studies are described in Table. A detailed description of the screening results and the final curated databases after data extraction is provided in Supporting Information 1.
PRISMA workflow diagram.
1: Description of the 27 Included Studies after the Search and Screening Process
Quality Assessment
A structured quality assessment of the selected studies was conducted based on the QUADOMICS framework (Supporting Information 2). According to this evaluation, 12 studies were classified as high quality (more than 50% positive answers); 8 as low quality (more than 50% negative responses or more negative than positive responses); and the remaining studies as moderate quality due to a high proportion of unclear responses (FigureA).
Quality assessment of the included studies using the QUADOMICS tool. (A) Quality profile for each included study, with quality assignments (high, moderate, low). (B) Proportion of studies fulfilling each QUADOMICS item, including those with positive, negative, and unclear responses.
As shown in FigureB, approximately half of the articles (55.6%) reported inclusion and exclusion criteria (item 1) followed in the recruitment process. Only 37% of the final studies fulfilled the criterion of having no age/sex restrictions and an adequate patient source (item 2), which can be partially explained by some articles targeting conditions related to, but distinct from, T2D. For example, Yu et al., 2022? investigated the role of T2D in mild cognitive impairment using elderly patients, who are not an ideal patient source to assess T2D specifically. Detailed information about the sample type and collection procedures (item 3) was reported in 74.1% of the studies, especially for unusual sample types (semen, visceral adipose tissue, or aqueous humor). However, most articles failed to report the timing of sample collection and storage intervals.
Regarding demographic and clinical factors (item 4) for both T2D and control groups, only 37% of studies provided sufficient information, with diabetes duration being the least reported variable. Reporting tended to be more detailed for case groups than for controls. In terms of analytical bias, over 70% of the studies supplied adequate details on preanalytical procedures and proteomic analysis (items 5 and 10A). However, only 25.9% provided enough reproducible descriptions of downstream analysis (item 10B), often lacking key information on data normalization, data imputation, and p-value adjustments. Unclear responses were most frequent for items related to the index test, particularly the diagnostic criteria for T2D (item 7), timing of diagnosis (item 6), condition verification (item 8), and diagnostic implementation (item 9), all of which were poorly documented.
Finally, only 25.9% of studies conducted discrimination analysis of the relevant biomarkers (item 12), while biomarker validation using alternative techniques such as Western blot or ELISA was reported in nearly half of the studies (item 16, 48.1%).
General Description of Relevant Literature
A total of 27 final articles met the inclusion criteria, most of which were conducted in China (37.0%) and the United States (18.5%). These studies span from 2011 to 2025, with a notable increase in publications after 2018 (Supplementary Figure S2A–B). Eight different sample types were used, with serum (21.4%), eye tissue (14.3%), and plasma (14.3%) being the most frequently analyzed (Supplementary Figure S2C). Only one study (Ferreira da Silva et al., 2024?) analyzed two different sample types (plasma and saliva) from the same cohort.
Regarding the proteomic analyses, 81.5% of the studies operated in the DDA mode. Instruments from Thermo commercial houses (including Thermo Fisher Scientific, Thermo Scientific, and Thermo Electron) were used in 70.3% of the studies (Supplementary Figure S2D). UniProt was the most commonly referenced protein identification library, cited in 63.0% of the articles. MaxQuant was the most frequently used software for protein identification (29.6%), followed by Proteome Discoverer (18.5%). DAA was commonly conducted using Perseus and R (18.5% each).
In terms of statistical analysis, testing was heterogeneous across the studies. The t-test was used in 44.4% of the studies, and functional analysis was performed in nearly all studies (88.9%). However, several gaps were identified in the reporting of downstream analytical procedures: 18.5% of studies did not report the analysis software used; 40.7% did not specify the normalization method; 44.4% did not indicate p-value adjustment procedures; and 63.0% lacked information on data imputation. Detailed settings are shown in Supplementary Table S9.
As highlighted in the QUADOMICS section, group-level demographic and clinical data were frequently incomplete, particularly for control groups. Age and gender information were generally provided, but important factors related to diabetessuch as BMI (Body Mass Index), HbA1c, and FPG (Fasting Plasma Glucose)were not reported in 44.4% to 62.9% of the articles (Supporting Information 2). Group descriptions show that, in most articles, the average age of the T2D and control groups is similar, except for Kaur et al., 2012,? Ferreira da Silva et al., 2024,? and Kim et al., 2014,? where the control groups were younger. Participants across all studies ranged in age from approximately 20 to 80 years old (Supplementary Figure S3A). Gender distribution was generally balanced between T2D and control groups (Supplementary Figure S3B). The female percentage across studies ranged from 30% to 60%, with two articles including only men (An et al., 2018;? Darmayanti et al., 2023?where the latter focused on semen samples) and one study including only women (Carruthers et al., 2021?). Due to the well-established relationship between obesity and diabetes, BMI data highlighted those studies including obese patients; however, for most studies, BMI ranged from 20 to 30 (Supplementary Figure S3C). Forest plots of average HbA1c and FPG levels (Supplementary Figure S3D–E) confirmed group assignment in studies reporting this information. T2D duration was reported in only nine studies. In two cases, patients were diagnosed at recruitment (duration = 0 years), while the remaining studies reported durations ranging from 3 to 12 years, with substantial intra- and interstudy variability (Supplementary Figure S3F).
Qualitative Analysis
From the 27 included studies, a total of 23,099 protein identifiers were initially retrieved. After data curation and harmonization, this number was reduced to 22,328. Among these, 2,745 proteins were reported in ≥2 studies and 85 were consistently identified in at least eight articles (Supplementary Figure S4A). This highly recurrent subset of proteins showed strong interconnections, as illustrated by the interaction network in FigureA (Supporting Information 3).
*Qualitative analysis of proteins commonly analyzed in proteomic studies of T2D. (A) Protein–protein interaction network (score
0.7) of the proteins identified in at least eight studies (n = 85). Edge color code, in legend order: known interactions from curated databases or experimentally determined; predicted interactions by gene neighborhood, gene fusions, or gene cooccurrence; others include text mining, coexpression, and protein homology. (B–D) Circle plot showing the association and contribution of proteins to functional annotation clusters for cellular components (B), molecular function (C), and biological process (D) of Gene Ontology (GO). Proteins linked to only a few terms are grouped under the Others class. (E) Vote-counting analysis summarizing the direction of differential abundance (upregulated or downregulated in T2D) across studies for selected proteins.*
ORA was performed on these 85 proteins, using the broader set of 2,745 proteins (shared by at least two studies) as the reference background. Statistically significant enrichment terms (adjusted p-value and q-value <0.05) were divided by GO category and grouped by semantic clustering. The clustering results for the 30 significant cellular component annotations indicate that the 85 proteins are mainly localized in lipoprotein particles, the extracellular matrix, various types of vesicles (cytoplasmic, secretory, luminal), the endoplasmic reticulum, the cell surface, and blood-related complexes and particles (FigureB). Regarding the main clusters for the 38 significant molecular functional terms, enrichment indicates associations with lipid and cholesterol transfer, binding and receptor activity (heparin, protease, oxygen, hemoglobin, haptoglobin), as well as enzyme peptidase activity, antioxidant-acting acceptors, and oxygen/haptoglobin carriers (FigureC). In terms of biological processes (114 after simplifying by removing redundancies), the major clusters refer to proteins that are primarily involved in immune regulationincluding complement activation and humoral and innate immunityas well as lipoprotein cholesterol assembly, cellular detoxification, regulation of coagulation and tube diameter, and chemical stimulus, particularly for the detection of bitter taste (FigureD). The complete ORA results and the clustering of functional terms can be accessed in Supporting Information 3.
Complementing this analysis, a vote-counting approach was applied to assess the directionality of protein regulation based on log_2_ FC. This analysis revealed that zinc-alpha-2-glycoprotein (AZGP1) and myosin regulatory light chain 1 (ORM2) were consistently upregulated in the T2D group across most studies, whereas apolipoprotein A-I (APOA1) was generally downregulated in the T2D group (FigureE, Supporting Information 3).
Omics-Based Meta-Analysis
Of the 27 included studies, 23 provided full quantitative data reporting both FC and p-values for each protein (three lacked specific p-value information, and one only provided the direction of change). These studies were included in the omics-based meta-analysis. From a total of 16,668 proteins reported across these 23 articles, 2,735 were found to be shared by at least two studies (Supplementary Figure S4B). Aggregated log_2_ FC values and adjusted p-values for these proteins are presented in FigureA, with full details available in Supporting Information 3.
(A) Volcano plot showing the aggregated adjusted p-values and log2 FC, weighted by sample size, for the 2,734 proteins shared by two or more studies. Positive log2 FC values indicate higher protein abundance in the T2D group. (B) Correlation between contribution and influence (MAPE %) of the included studies.
Contribution analysis revealed that three studiesChen et al., 2021,? Zou et al., 2020,? and Skeie et al., 2018?collectively accounted for more than 40% of the proteins shared across studies. However, influence analysis, which evaluates the impact of each study on the meta-analytic results, identified Chen et al., 2021,? Nunez Lopez et al., 2022,? and Zou et al., 2020? as the most influential contributors. Chen et al., 2021? showed the highest influence: when this study was omitted, the pooled FC values differed by 34.5% relative to the pooled estimates obtained from all 23 studies. The impact of Nunez López et al., 2022? and Zou et al., 2020? was considerably lower, but also important (15.1% and 9.7%, respectively). For the remaining studies, influence values ranged from 0.07% to 6.44%, with 13 studies showing values below 1%. Interestingly, despite its large protein count, Skeie et al., 2018? was not found to be highly influential (3.63%). This highlights that while contribution and influence are related, a high volume of data does not necessarily equate to a strong impact on meta-analytic outcomes (FigureB, Supporting Information 3).
Once the aggregated FC and adjusted p-values were computed, proteins were filtered to identify relevant, stable biomarkers shared across studies while minimizing the influence of previously identified high-impact studies. Criteria included an aggregated adjusted p-value <0.05, an absolute log_2_ FC > 1, and presence in three or more studies. A subset of 29 significant proteins met these thresholds. Further filtering resulted in the identification of seven stable candidate biomarkers for T2D (Table). The filter was based on consistency in the log_2_ FC direction across studies and exclusion of results heavily driven by high-influence studies (Figure), excluding the most influential study. Briefly, these seven candidates can be grouped as follows:
- Four related to metabolic regulation: Vesicular integral-membrane protein VIP36 (LMAN2), truncated apolipoprotein A-II (APOA2), saposin-B-Val (PSAP), and dihydrolipoyl dehydrogenase (DLD).
- Two involved in cell binding and adhesion: Collagen alpha-1(VI) chain (COL6A1) and cadherin-1 (CDH1).
- One associated with regulation of transcription and mitochondrial function: Prohibitin (PHB1).
Log2 FC magnitude and direction for the filtered proteins in each of the studies, with bars colored by original significance interpretation. Most influential studies are highlighted in yellow. Positive log2 FC values indicate higher protein abundance in the T2D group. EV: extracellular vesicles; VAT: visceral adipose tissue.
2: Summary of Seven Key Protein Biomarkers Identified through Omics-Based Meta-Analysis of High-Throughput Proteomic Studies Comparing T2D and Normoglycemic Individuals
Several of the previously identified biomarkers are also associated with key biological processes relevant to T2D, including immune response, cholesterol homeostasis, and carbohydrate metabolism.
A grouped analysis was also conducted by sample type, limited to those samples analyzed in more than one study (Supplementary Figure S5). In general, no relevant biomarkers were identified in blood (serum and plasma) or eye samples, and those found in other sample types were each supported by a single study, providing weak evidence of their relevance. Urine, however, was an exception, with aggregated results showing multiple significant proteins and considerable magnitudes of change. Nevertheless, this evidence may be unreliable, as it is primarily supported by the most influential study in the global meta-analysis: Chen et al., 2021.?
Random-Effects Meta-Analysis
Twelve articles provided proteomic raw data and were included in the random-effects meta-analysis. Due to the large number of proteins reported across studies, a selection process was implemented as described in the Methods section to focus on the most consistently identified proteins. The final list comprised highly shared proteins across multiple studies, including alpha-1-acid glycoprotein 1 (ORM1), reported in 10 studies; alpha-1-antichymotrypsin (SERPINA3) and truncated apolipoprotein A-I (APOA1), both present in 9 articles; and six proteins identified in 8 studies: Haptoglobin (HP), apolipoprotein E (APOE), vitronectin (VTN), zinc-alpha-2-glycoprotein (AZGP1), peroxiredoxin-2 (PRDX2), and peptidyl-prolyl cis–trans isomerase A (PPIA) (Supplementary Table S10).
Results from the random-effects meta-analysis revealed limited consistency in the SMD values across studies for the most of these proteins (Supplementary Figure S6). However, three proteinsORM1, HP, and AZGP1showed consistent differences (although without reaching significance) in abundance between T2D and control groups (Figure). All three proteins were upregulated in the T2D group, with AZGP1 displaying the highest effect size (SMD (95% CI) = 0.78 (−0.13 to 1.69)).
Forest plot displaying the SMDs for selected proteins across studies comparing T2D and normoglycemic individuals. Individual study effect sizes, 95% confidence intervals, and corresponding weights are shown alongside the pooled SMD estimated using a random-effects model. Measures of heterogeneityincluding I 2 (percentage of total variability due to heterogeneity), τ2 (between-study variance), and the p-value from Cochran’s Q testare reported to assess consistency across studies. Positive SMD values indicate a higher protein abundance in the T2D group.
To assess the robustness of the meta-analyses for the previous three proteins, sensitivity, bias, and influence diagnostics were performed. One outlier study (Vestad et al., 2021?) was identified for ORM1, and its removal substantially reduced heterogeneity (I ^2^ from 44% to 0%). No outliers were detected for HP or AZGP1. Egger’s test suggested no significant small-study effects for any protein (all p > 0.05), though a trend toward asymmetry was observed for ORM1 (p = 0.065). Trim-and-fill analysis did not impute missing studies for ORM1 but indicated potential asymmetry and increased heterogeneity for HP and AZGP1. Excess significance testing showed no inflation for ORM1 or HP, while AZGP1 exhibited a borderline significant excess (p = 0.048). Selection models detected possible publication bias only for ORM1 (p = 0.033). Influence analysis confirmed that pooled estimates were stable across studies, with no single study unduly altering the results. Overall, findings appeared robust, though caution is warranted for ORM1 due to potential bias indicators. Detailed results from outlier detection, publication bias, and influence diagnostics are presented in Supplementary Tables S11 to S14.
Due to the high heterogeneity observed in the meta-analysis, we explored potential sources of variability for each consistent biomarker (Supplementary Table S15). ORM1 and AZGP1 did not show significant differences across subgroups defined by sample type, data acquisition method, study quality, commercial platform, or analytical software. In contrast, all of these factors appear to contribute to variability for HP, which exhibited, for example, higher SMD values in urine samples and in studies rated as low quality according to QUADOMICS reporting criteria.
metaMarkers2D
To enhance the accessibility and impact of this study for the scientific community, a Shiny appmetaMarkersT2Dwas developed. This interactive tool enables users to explore the final curated database of proteins identified in the 27 studies included in the meta-analysis. Proteins can be searched using their UniProt ID, which serves as a standardized reference identifier.
Upon querying a protein, the application returns a list of studies in which that protein was reported, including the original FC and p-value or adjusted p-value for each occurrence. To provide further context, additional metadata about the studies is organized into three separate tables, offering detailed information about experimental design, sample types, and analysis methods.
Differential abundance results are visualized in a bar plot, where the Y-axis represents the magnitude of the log_2_ FC and the X-axis lists the studies. Bars are color-coded according to the significance level reported in the original articles (with p-values or adjusted p-values specified). For ease of use, all retrieved data can be downloaded in a tabular format. The app is freely accessible at the following link: https://jgcurras.shinyapps.io/metaMarkersT2D/.
Discussion
In this study, we conducted a systematic review of proteomic biomarkers associated with T2D. We integrated quantitative data from the selected studies using both an omics-based meta-analysis and a traditional random-effects meta-analysis. This combined approach enabled us to identify key protein biomarkers that were consistently reported across studies with concordant directions of change, statistical significance, and clear biological relevance to T2D pathophysiology.
Our final set of 27 articles clearly reflects that T2D has been studied from multiple perspectives, focusing mainly on noninvasive or minimally invasive samples such as blood, urine, eye tissue, and even semen, while also including primary tissues directly involved or affected by impaired glucose homeostasis: liver, pancreas, muscle, and visceral adipose tissue. This diversity of tissues can also be explained by the fact that in some studies, the primary target was not T2D itself but microvascular complications derived from it, particularly DN and RN. In studies reporting cohort details, T2D and control groups were generally well matched for sex, age, and BMI, with only moderate variability. Because obesity is strongly associated with T2D,? it could have been a confounding factor; however, we mitigated this by including only studies in which both T2D and control groups had similar obesity status.
Details of the proteomic analyses are generally provided, revealing substantial variability in instrument platforms and settings across studies. In contrast, the reporting of critical data processing steps (normalization, missing-data imputation, and statistical testing) was often lacking. Although DIA methods offer clear advantages in proteomics, few studies have used this approach, likely due to its relatively recent introduction. On a positive note, the use of the same reference library, UniProt database, for protein identification in most studies likely contributed to greater consistency in the proteins analyzed. Based on the extraction and analysis of baseline data from the included studies, we recommend that future work should pay particular attention to detailed reporting of case and control group descriptions, diagnostic methods, disease duration, and recruitment processes. Such information is essential to assess comparability across studies and to ensure the representativeness of comparison groups, maximizing the value of each study’s data for meta-analytical approaches. Likewise, transparent reporting of data processing steps is critical since these have a substantial impact on the final results and are key to ensuring reproducibility.
Despite the variability introduced by different proteomic platforms, acquisition modes, sample types, and population origins, we identified a subset of 85 proteins reported in eight or more studies comparing T2D with the normoglycemic controls. These were not randomly shared proteins: their strong interaction networks and enriched functional annotations suggest their biological importance, with many processes representing the functional background of the general proteome commonly detected in differential abundance studies of T2D versus those of normoglycemic individuals. The main cellular locations of these highly recurrent proteinsincluding vesicles, extracellular matrix, cell surfaces, and circulating complexes or granulesunderscore the relevance of interorgan communication in T2D pathophysiology. This is further supported by the enriched molecular functions related to binding and receptor activity, as well as peptidase activity, carried out by proteins such as fibronectin (FN1), histidine-rich glycoprotein (HRG), kininogen-1 (KNG1), alanine-glyoxylate aminotransferase (AGT1), complement factors (C3, C5, C4B), and proteins related to coagulation from the SERPIN genetic family. Collectively, these functions point to immune regulation (reflecting T2D’s chronic low-grade inflammation) and to coagulation and vascular tone control, processes closely linked to T2D micro- and macrovascular complications.?
In addition, several apolipoproteins such as apoliproteins E, B, A1, and 4 (APOE, APOB, APOA1, APOA4) were predominantly located in lipoprotein particles and were associated with lipid and cholesterol transport.? Given that dyslipidemia often coexists with T2D and patients often exhibit an atherogenic lipid profile, alterations in lipoprotein particles are expected.? A smaller subset of proteins, including HP, Parkinson’s disease protein 7 (PARK7), and hemoglobin subunits alpha 1, beta, and delta (HBA1, HBB, HBD), showed antioxidant and oxygen transport functions, highlighting the importance of cellular detoxification under the oxidative stress imposed by chronic hyperglycemia.? We also observed enriched terms related to chemical stimulus detection, particularly bitter taste perception, involving proteins such as AZGP1, polymeric immunoglobulin receptor (PIGR), and prolactin-inducible protein (PIP).? Altered flavor perception may influence dietary behavior and lifestyle, potentially contributing to metabolic disorders such as T2D. ?,? Notably, several of the previously mentioned proteins showed consistent regulation patterns across studies, with AZPG1, HP, and KNG1 mostly upregulated, while APOA1 and PARK7 were predominantly downregulated.
Selecting relevant biomarkers based on statistical significance and magnitude of change proved challenging. In our omics-based meta-analysis, even widely shared proteins showed large discrepancies in adjusted p-values between studies, preventing many from meeting stringent significance thresholds in the aggregate analysis. These discrepancies were also reflected in the magnitude of change. As a result, the final biomarkers identified through this meta-analytic approach were reported in no more than six studies. Another key factor was the limited contribution of some studies to the shared protein set due to incomplete reporting of full or partial protein lists. In fact, blood-derived samples were the most frequently analyzed, raising the possibility of bias toward blood-associated proteins. However, these studies generally contributed shorter protein lists, which helped counteract potential overrepresentation effects. Despite these challenges, the omics-based meta-analysis proved to be a valuable strategy to address incomplete data reporting in proteomic studies by leveraging available fold-change and p-value metrics. In contrast, the more traditional random-effects meta-analysis could only include the 12 studies providing a raw quantitative matrix, underscoring the urgent need for open and standardized data sharing in omics research. Interestingly, this approach also identified multiple proteins reported in more than one article, but when a protein was present in four or more studies, concordant significance across data sets was rarely achieved, making it difficult to select a robust subset of biomarkers solely based on p-values. Consequently, the analysis was restricted to proteins previously reported as candidate biomarkers in the literature and supported by sufficient studies to strengthen the statistical power, regardless of significance. Combining both meta-analytic strategies, we identified ten candidate biomarkers supported by multiple studies as potential components of a multimarker diagnostic panel for T2D: LMAN2, APOA2, PSAP, DLD, COL6A1, CDH1, PHB1, ORM1, HP, and AZPG1.
From this list, some proteins were also identified as relevant biomarkers in previous reviews for T2D and proteomic biomarkers. All proteins found to be highly consistent in our random-effects meta-analysis had been reported previously in at least one of these reviews. HP was the most frequently mentioned, appearing in four reviews, ?,?,?,? three of which indicated higher HP levels in T2D, ?,?,? consistent with our findings. AZGP1 was also widely reported, ?,? with previous reviews likewise describing increased abundance in T2D, further supporting our results. Additionally, our analysis identified ORM1 as a promising biomarker, with high levels in T2D. This finding aligns with the review by Sohail et al., 2018,? including concordance in the direction of change. Regarding the consistent biomarkers detected by the omics-based approach, two had been reported in prior studies. Various apolipoproteins were noted as relevant for T2D in the related literature, ?,?,? but APOA2 was specifically highlighted by Riaz, 2015,? who also indicated reduced abundance in T2D, consistent with our meta-analysis results. Furthermore, Riaz 2015? also reported CDH1 as a relevant biomarker for T2D, with increased concentrations in this condition, fully concordant with our findings.
Biomarkers highlighted in previous reviews were numerous and often variable. These lists essentially reflect collections of results from individual studies, with only a few studies supporting the relevance of each protein and almost no quantitative information provided. Moreover, the selection of articles was typically based on the authors’ discretion, introducing subjectivity and limiting reproducibility. In contrast, our systematic approach addresses these limitations by performing a structured and comprehensive search across three different databases to capture the relevant literature. Furthermore, the biomarkers identified in our study are accompanied by quantitative data on significance, direction, and magnitude of change, estimated through meta-analytical methods that appropriately account for variability between studies. Importantly, each of these biomarkers is supported by at least four studies, with some supported by up to ten, providing a robust and reproducible evidence base. Despite the strengths of this approach, several limitations should also be acknowledged in this work. One key issue is the lack of detailed preprocessing information and raw data in the included studies, which restricted our ability to perform uniform reanalyses and fully assess differential protein abundance. Variability in data processing methods, including normalization, imputation, and statistical testing procedures, is another important concern, which may have introduced additional heterogeneity and affected comparability across studies. In this regard, the random-effects meta-analysis is more robust than the omics-based approach, as it operates directly on the quantification matrices, thereby reducing the impact of differences in testing methods. A further limitation is the inconsistency in protein nomenclature, requiring extensive mapping to standard identifiers and potentially resulting in minor mismatches or omissions. As our analyses were conducted using previously published data sets, external validation of the candidate biomarkers was not feasible. This aspect should be addressed in future studies to provide additional validation of the findings.
In light of this work, we stress the importance of cautious interpretation of individual biomarker discovery studies and advocate for integrating evidence from previous work to corroborate or challenge proposed biomarkers, even qualitatively. We also emphasize the urgent need for greater data accessibility in omics research: adherence to FAIR (Findable, Accessible, Interoperable, Reusable) data principles should be mandatory for publication to ensure that data sets can be readily reused and reanalyzed by the scientific community.
Regarding T2D, future work should integrate proteomic data obtained using complementary technologies such as Olink and SOMAscan. For both integrated analyses and new biomarker studies, our metaMarkersT2D Shiny application developed in this study can serve as a useful tool to cross-reference novel findings against the database compiled in this review. Additionally, other omics layers, particularly lipidomics and metabolomics, which are closely linked to T2D pathogenesis, should be incorporated to build a more comprehensive multiomics profile of the disease. Systematic reviews and meta-analyses represent optimal approaches for this integration, as they minimize selection bias and generate interpretable quantitative metrics. In this context, the pubmedToCsv Shiny app developed in this project can assist in managing proteomic literature from the PMC database during the search step. Ultimately, pooling evidence from multiple studies and omics will provide a strong foundation for constructing a validated multibiomarker panel for T2D, an achievement attainable only through collaborative efforts across the scientific community.
Supplementary Material
The reference list from the paper itself. Each links out to its DOI / PubMed record.
- 1Gallwitz B.Kazda C.Kraus P.Nicolay C.Schernthaner G.Contribution of Insulin Deficiency and Insulin Resistance to the Development of Type 2 Diabetes: Nature of Early Stage Diabetes Acta Diabetol.2013501394510.1007/s 00592-011-0319-421861172 · doi ↗ · pubmed ↗
- 2International Diabetes Federation IDF IDF Diabetes Atlas; 11th ed.; International Diabetes Federation: Brussels, Belgium, 2025.
- 3Evans M.Chandramouli A. S.Faurby M.Matthiessen K. S.Mogensen P. B.Verma S.Healthcare Costs and Hospitalizations in US Patients with Type 2 Diabetes and Cardiovascular Disease: A Retrospective Database Study (OFFSET)Diabetes Obes. Metab.20222471300130910.1111/dom.1470335504854 PMC 9324926 · doi ↗ · pubmed ↗
- 4Nanayakkara N.Curtis A. J.Heritier S.Gadowski A. M.Pavkov M. E.Kenealy T.Owens D. R.Thomas R. L.Song S.Wong J.Chan J. C.-N.Luk A. O.-Y.Penno G.Ji L.Mohan V.Amutha A.Romero-Aroca P.Gasevic D.Magliano D. J.Teede H. J.Chalmers J.Zoungas S.Impact of Age at Type 2 Diabetes Mellitus Diagnosis on Mortality and Vascular Complications: Systematic Review and Meta-Analyses Diabetologia 202164227528710.1007/s 00125-020-05319-w 33313987 PMC 7801294 · doi ↗ · pubmed ↗
- 5Exalto L. G.Whitmer R. A.Kappele L. J.Biessels G. J.An Update on Type 2 Diabetes, Vascular Dementia and Alzheimer’s Disease Exp. Gerontol.2012471185886410.1016/j.exger.2012.07.01422884853 · doi ↗ · pubmed ↗
- 6Stolar M.Glycemic Control and Complications in Type 2 Diabetes Mellitus Am. J. Med.20101233 S 3S 1110.1016/j.amjmed.2009.12.00420206730 · doi ↗ · pubmed ↗
- 7Hashemi H.Rezvan F.Pakzad R.Ansaripour A.Heydarian S.Yekta A.Ostadimoghaddam H.Pakbin M.Khabazkhoob M.Global and Regional Prevalence of Diabetic Retinopathy; A Comprehensive Systematic Review and Meta-Analysis Semin. Ophthalmol.202237329130610.1080/08820538.2021.196292034402390 · doi ↗ · pubmed ↗
- 8Anjana R. M.Mohan V.Rangarajan S.Gerstein H. C.Venkatesan U.Sheridan P.Dagenais G. R.Lear S. A.Teo K.Karsidag K.Alhabib K. F.Yusoff K.Ismail N.Mony P. K.Lopez-Jaramillo P.Chifamba J.Palileo-Villanueva L. M.Iqbal R.Yusufali A.Kruger I. M.Rosengren A.Bahonar A.Zatonska K.Yeates K.Gupta R.Li W.Hu L.Rahman M. O.Lakshmi P. V. M.Iype T.Avezum A.Diaz R.Lanas F.Yusuf S.Contrasting Associations Between Diabetes and Cardiovascular Mortality Rates in Low-, Middle-, and High-Income Countries: Cohort Study Data From 143,567 Individuals in 21 · doi ↗ · pubmed ↗