PRIME: an interpretable artificial intelligence model based on liquid biopsy improves prediction of progression risk in non-small cell lung cancer
Yu Wang, Yong-Bo Xiang, Xiao-Wei Chen, Tao Zhang, Jian-Yang Wang, Wen-Yang Liu, Lei Deng, Lu-Hua Wang, Shu-Geng Gao, Nan Bi

TL;DR
PRIME is an interpretable AI model that uses liquid biopsy data to better predict the risk of cancer progression in non-small cell lung cancer patients.
Contribution
PRIME integrates clinical-genomic predictors with machine learning to improve progression risk prediction and enable personalized therapy decisions.
Findings
PRIME outperformed single biomarkers and clinical signatures in predicting treatment failure risk (AUC = 0.82 in validation).
MRD, treatment modality, and pre-treatment ctDNA were top contributors to model predictions.
KEAP1, STK11, and CDKN2A mutations were confirmed as poor prognostic markers with immune-related mechanisms.
Abstract
Despite the predictive impact of circulating tumor DNA (ctDNA) minimal residual disease (MRD), accurate prediction of failure risk after curative-intent treatments for early-stage or localized non-small cell lung cancer (NSCLC) patients to guide personalized therapy remains challenging. This study aimed to develop and validate an interpretable artificial intelligence-assisted model using global data resources. Liquid biopsy data, blood-based genomic alterations, clinicopathological features, and survival outcomes of stage I–III NSCLC patients who underwent surgery or definitive chemoradiotherapy were collected from 6 cohorts. PRIME (Progression Risk prediction by Interpretable Machine learning on ctDNA-MRD, Mutations, and clinical-therapeutic features) was trained by 6 machine learning algorithms across 4 cohorts and validated in 2 independent cohorts. Model performance was evaluated…
Genes, proteins, chemicals, diseases, species, mutations and cell lines named across the full text — each resolved to its canonical identifier and authoritative record.
Click any figure to enlarge with its caption.
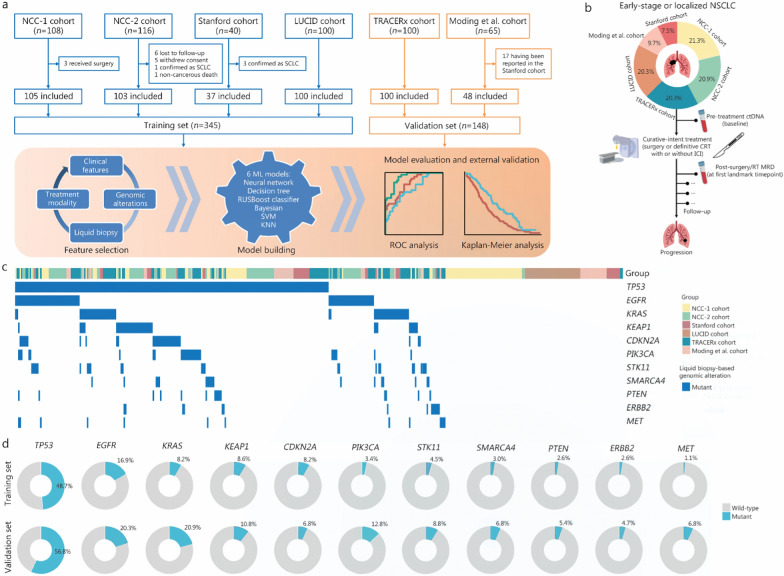 Figure 1
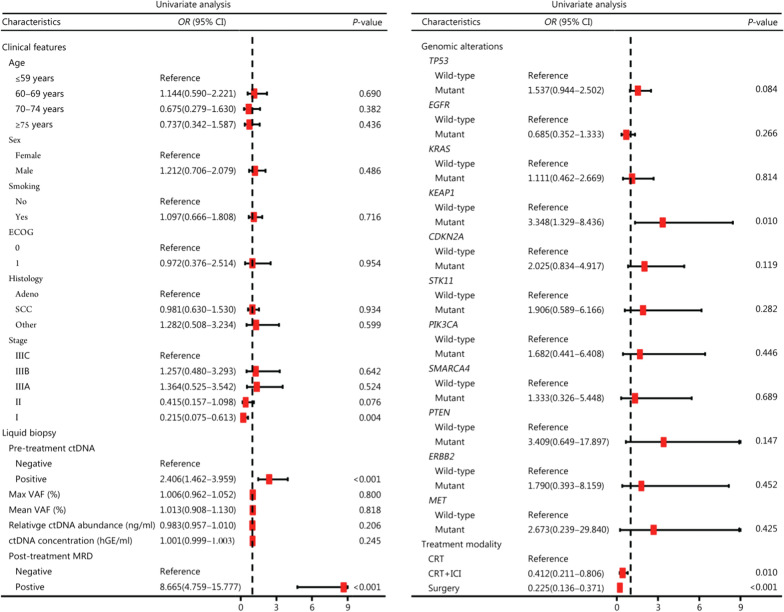 Figure 2
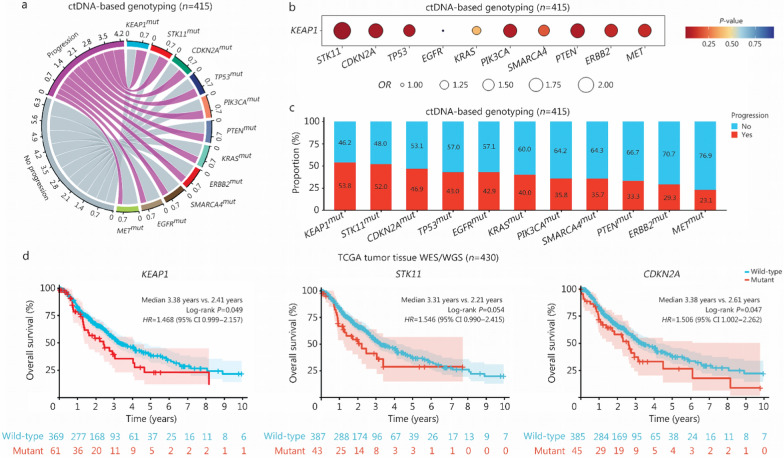 Figure 3
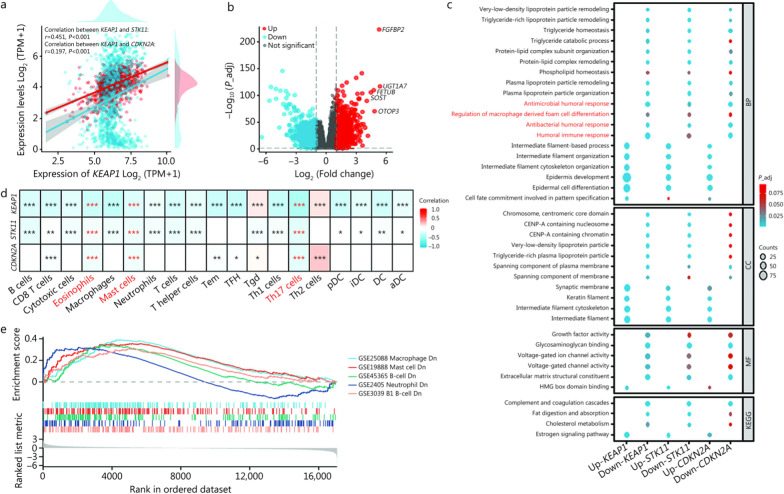 Figure 4
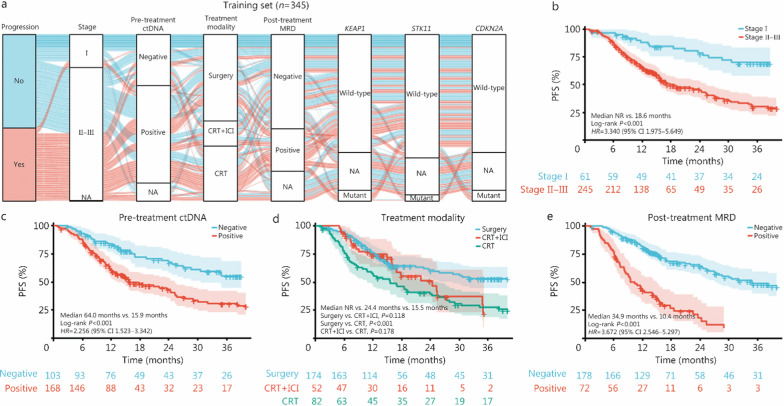 Figure 5
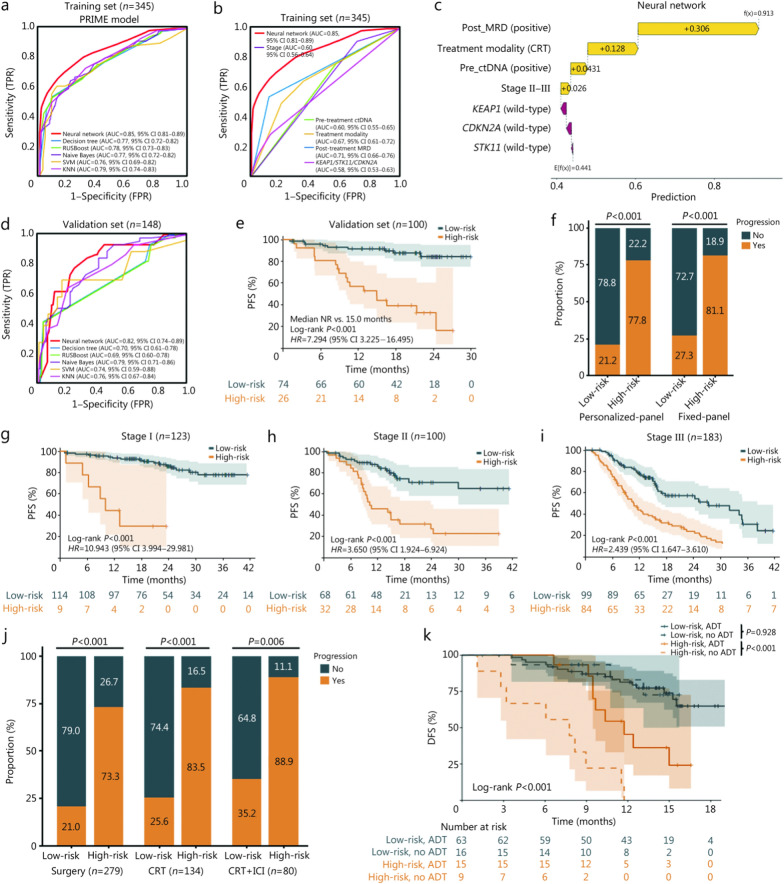 Figure 6
- —http://dx.doi.org/10.13039/501100001809National Natural Science Foundation of China
- —Special Research Fund for Central Universities, Peking Union Medical College
- —http://dx.doi.org/10.13039/501100019018Chinese Academy of Medical Sciences Initiative for Innovative Medicine
Peer Reviews
No public reviews on file for this paper yet. If you reviewed it on a platform where reviews are public (OpenReview, ICLR, NeurIPS, ICML), you can paste yours below so the community can read it here.
Videos
No videos yet. Explain this paper in a talk, walkthrough, or lecture? Add one.
Taxonomy
TopicsCancer Genomics and Diagnostics · Lung Cancer Treatments and Mutations · Lung Cancer Diagnosis and Treatment
Background
Non-small cell lung cancer (NSCLC) is the leading cause of cancer-related death [1, 2]. Curative-intent treatment strategies for patients with early-stage or localized NSCLC include surgical resection and radical chemoradiotherapy (CRT) [3]. Despite advances in surgical procedures, radiation techniques, and combined therapies with immune checkpoint inhibitors (ICIs), patient outcomes remain poor, with a high recurrence rate ranging from 30% to 55% [4, 5]. Therefore, there is an urgent need for effective predictive models that can determine the risk of disease progression early, stratify prognosis accurately, and guide personalized escalated or de-escalated adjuvant treatment decisions.
Although radiological surveillance is currently the clinical follow-up for early-stage and localized NSCLC patients after curative treatment, such monitoring tools can identify only macroscopic disease relapse [6]. Given postsurgical anatomical changes as well as indistinguishable radiation pneumonitis from disease progression, radiographic monitoring can be inconclusive [7, 8]. Liquid biopsies, including circulating tumor DNA (ctDNA)-based minimal (or molecular) residual disease (MRD) detection, provide a noninvasive alternative and the ability to predict disease progression early with high specificity (approximately 71–100%) [9–11]. However, the insufficient sensitivity (36–100%) [10] of single ctDNA-MRD detection for predicting recurrence remains an unsolved problem. More than 50% of patients with negative post-treatment MRD will eventually experience disease recurrence [12, 13], highlighting the necessity of improving sensitivity. Recent studies have suggested that integrating ctDNA-based genomic alterations into a multi-parameter model could improve predictive performance and assist with more personalized prediction [14–16].
In addition to incorporating circulating genomic features into combinatorial models, several machine learning (ML) algorithm-based studies using multi-modality data, including clinicopathologic characteristics, treatment regimens, and peripheral blood biomarkers, have shown enhanced prediction effects and promising clinical applicability [17–20]. Compared with single biomarkers or conventional statistical combined models, such as regression or classification tools constructed by combining ctDNA testing with other variables, ML approaches possess the advantages of capturing more nuanced and highly individualized features in the field of biomedicine [21, 22], thereby effectively improving the prediction power [23]. Such comprehensive and informative artificial intelligence (AI)-assisted models are invaluable for non-metastatic NSCLC, since they help identify the failure risk early after local therapies and guide risk-adaptive decisions on adjuvant systemic treatments [24]. Moreover, in contrast to the inexplicable “black box” nature of deep learning algorithms, ML models offer better interpretability and are more suitable for clinical practice [25–27]. However, research in this field is currently lacking.
Currently, in the real-world setting, patients often undergo different ctDNA testing techniques on various platforms, including fixed panels or personalized panels. Although the detection sensitivity and specificity of each platform likely differ, and it is difficult to directly compare results across panels, there remains an urgent need for a comprehensive summary of results obtained from different techniques to assess the overall predictive performance. This will help make an objective assessment of the clinical value of liquid biopsy and guide real-world medical practice. This study aimed to develop a novel model named PRIME (Progression Risk prediction using Interpretable ML on ctDNA-based genomic Mutations, MRD, and clinical-therapeutic features) for early prediction of treatment failure risk and clinical outcomes in early-stage and localized NSCLC patients.
Methods
Description of the data and participants
This study analyzed data from 6 cohorts (Fig. 1a). NCC-1 and NCC-2 cohorts were in-house datasets from National Cancer Center (Beijing, China), comprising 105 unresectable and 103 resectable stage I–III NSCLC patients, respectively, treated between 2018 and 2022. Patients in NCC-1 cohort received definitive CRT with or without consolidation ICI therapy, and those in NCC-2 cohort underwent radical surgery. Longitudinal ctDNA profiling was performed at pre-treatment and post-treatment timepoints in both cohorts. LUCID (LUng cancer Circulating tumour DNA) [28], TRACERx (Tracking Non-Small-Cell Lung Cancer Evolution Through Therapy) [29, 30], Stanford [31], and Moding et al. [32] cohorts were available open-source datasets that, at the time this study was conducted, met the following inclusion criteria: 1) early-stage or localized NSCLC patients with survival outcomes; 2) curative-intent treatments including surgery or definitive CRT; and 3) longitudinal ctDNA profiling before and after therapy. Among the 6 cohorts, 2 used tumor-informed personalized ctDNA panels (LUCID [28] and TRACERx [29, 30]), and 4 employed fixed-panel ctDNA detection (NCC-1 and NCC-2, Stanford [31], and Moding et al. [32]). Considering the heterogeneity of sequencing platforms used by patients in the real world, we endeavored to incorporate data from different ctDNA testing techniques into the model training, and assessed the predictive performance of the final integrated PRIME model in different clinical contexts, aiming to guide real-world medical practice. For the enrolled patients, we collected their clinical characteristics, treatment regimens, survival outcomes, and ctDNA testing results, including pre-treatment ctDNA at baseline and post-treatment ctDNA-MRD detection at the first landmark time point, that is, within 2 weeks to 4 months after radical treatment ended (Fig. 1b). The baseline information of all the subjects is summarized in Additional file 1: Table S1. For details regarding the clinical procedures, patient eligibility criteria, and ctDNA sequencing methods used in each cohort, please refer to the Additional file 2: Methods. This study was approved by the Ethics Committee of Chinese Academy of Medical Sciences (20/453–2649).Fig. 1. Study overview. a Description of study procedure. b Flowchart of peripheral blood sample collection. c Heatmap plot of pre-treatment ctDNA-based tumor mutations for patients with variants identified in tumor tissue or plasma (n = 415). d Donut plots displaying the distribution of identified ctDNA-based mutations in the training set (n = 267) and validation set (n = 148). A total of 78 patients in the training set with unavailable blood-based mutation sequencing data before treatment. NSCLC non-small cell lung cancer, SCLC small cell lung cancer, ML machine learning, RUSBoost random under-sampling boosting, SVM support vector machine, KNN K-nearest neighbors, AUC area under the curve, ctDNA circulating tumor DNA, CRT chemoradiotherapy, ICI immune checkpoint inhibitor, RT radiotherapy, MRD minimal residual disease, NCC National Cancer Center, LUCID LUng cancer Circulating tumour DNA, TRACERx Tracking Non-Small-Cell Lung Cancer Evolution Through Therapy
Genomic mutation analyses
As mentioned above, ctDNA-based genotyping involves targeted sequencing of pre-treatment blood samples using fixed panels or personalized panels, which is highly consistent with the clinical utility of liquid biopsy in real-world settings. To validate the prognostic effect of genomic mutations identified by liquid biopsies, we employed whole-exome sequencing (WES) or whole-genome sequencing (WGS) data on tumor tissue samples from 430 patients with stage II–III lung squamous cell carcinoma (LUSC) or lung adenocarcinoma (LUAD) who underwent local therapy. RNA-sequencing (RNA-seq) data from 1149 subjects, including 1041 LUSC or LUAD patients and 108 healthy controls, were used to investigate the underlying mechanisms. WES/WGS and RNA-seq data were retrieved from The Cancer Genome Atlas (TCGA) portal (https://portal.gdc.cancer.gov/). We performed differential gene expression, functional enrichment, and immune infiltration analyses. Heatmaps and supervised clustering were generated by differential expression of preselected genes. All the samples were Z score normalized and clustered using Euclidean distance. Gene Ontology (GO) and Kyoto Encyclopedia of Genes and Genomes (KEGG) pathway analyses were used for functional annotations. Gene set enrichment analysis (GSEA) was further conducted.
Clinical outcome measures
The primary outcome measure of this study was disease progression, defined as disease recurrence after surgery or progressive disease after radiotherapy, which was determined according to Response Evaluation Criteria in Solid Tumors (RECIST) version 1.1 [33]. In this study, we consistently used “progression” to refer to the occurrence of progressive disease in patients treated with definitive radiotherapy and disease recurrence in patients who underwent surgery. For patients who received radical surgical resection (no measurable residual disease after surgery), the secondary outcome was disease-free survival (DFS), defined as the time from diagnosis to the first occurrence of newly measurable local–regional lesions, distant metastasis, or death without prior disease progression [34]. For those treated with definitive radiotherapy (residual measurable disease after treatment), the secondary outcome was progression-free survival (PFS), defined as the time from diagnosis to ≥ 20% growth of local–regional target lesions (according to RECIST version 1.1), distant metastasis, or death without prior progression [34]. In this study, when analyzing the overall population, we consistently used “PFS” to refer to the time to treatment failure (local–regional failure or distant metastasis) or death without treatment failure. The exploratory outcome was overall survival (OS), defined as the time to death from any cause. Clinical outcomes and treatment efficacy were evaluated via radiological examinations.
Feature selection for the ML models
Feature screening was performed in the training set. Logistic regression analysis was applied to evaluate the effects of clinicopathological characteristics, liquid biopsy biomarkers, ctDNA-based genomic alterations, curative treatment regimens on disease progression (the primary outcome measure). Specifically, features with a P-value < 0.05 in logistic regression analysis were considered to be significantly associated with disease progression, and were retained for subsequent ML model construction. The variance inflation factor (VIF) was calculated to assess multicollinearity among features.
ML model training and validation
The NCC-1 and -2, Stanford, and LUCID cohorts were employed to train the ML models. The TRACERx and Moding et al. cohorts were used for external independent validation. A total of 6 well-established classification learning models were trained and evaluated, including a neural network (NN), decision tree, random under-sampling boosting (RUSBoost) classifier, naive Bayes, support vector machine (SVM), and K-nearest neighbors (KNN). The predictive performance of the model for disease progression risk was assessed using receiver operating characteristic (ROC) curves and area under the curves (AUCs). DeLong’s test was employed to compare the predictive performance of different models and to test for statistical differences in AUCs of ROC curves [35, 36]. We also used F1-score, accuracy, precision, and recall to evaluate model performance. The handling of missing values included deletion or multiple imputation. Missing data were summarized variable-by-variable. When the missingness was < 5%, complete-case analysis was performed. For variables with ≥ 5% missing values deemed missing at random (MAR) or missing completely at random (MCAR), we performed multiple imputation using the multivariate imputation by chained equation for NN. To visually assess whether variables were MAR, MCAR, or missing not at random (MNAR), we used Sankey diagrams to contrast the flow of complete vs. missing data across relevant variable strata. Sensitivity analyses were conducted after excluding individuals with missing data (complete-case analysis) to examine the robustness of the model. SHapley Additive exPlanations (SHAP) were used to interpret the importance and contribution of each feature in the model prediction.
Standardized ctDNA-MRD detection across cohorts
To minimize the bias across cohorts and ensure consistency and comparability, we extracted the parameters shared across all cohorts and processed them using the same pipeline. All the fixed-panel sequencing platforms used covered the genes of interest in this study, including tumor protein p53 (TP53), epidermal growth factor receptor (EGFR), Kirsten rat sarcoma viral oncogene homolog (KRAS), Kelch-like ECH-associated protein 1 (KEAP1), cyclin-dependent kinase inhibitor 2a (CDKN2A), phosphatidylinositol-4,5-bisphosphate 3-kinase catalytic subunit alpha (PIK3CA), serine/threonine kinase 11 (STK11), SWI/SNF-related, matrix-associated, actin-dependent regulator of chromatin, subfamily A, member 4 (SMARCA4), phosphatase and tensin homolog (PTEN), Erb-B2 receptor tyrosine kinase 2 (ERBB2), and mesenchymal-epithelial transition factor (MET), which are canonical NSCLC driver mutations [37, 38]. To pool available individual-level data from different cohorts, we also aligned their MRD calling pipelines. A tumor-informed consensus definition was derived by taking the intersection of the technical parameters explicitly documented in every protocol. Consequently, a post-treatment plasma sample was classified as MRD-positive only when all of the following criteria were satisfied: 1) sequencing was restricted to somatic single-nucleotide variants (SNVs) pre-identified in the tumor samples or baseline plasma, with germline and clonal-hematopoiesis variants removed; 2) at least 2 independent SNVs from this patient-specific panel were detected in the same blood draw; 3) each variant exhibited an allele frequency ≥ 0.01% after error-suppression and background polishing; and 4) the cumulative confidence score for the variant set exceeded the study-specific threshold corresponding to ≥ 98% specificity in matched negative-control plasmas. The MRD-landmark time point was defined as the first post-curative sample collected between 2 weeks and 4 months after completion of radical surgery or radiotherapy. This minimum-common-specification preserves the highest shared analytical specificity and allows harmonized downstream analyses.
Additionally, to address the potential bias arising from heterogeneity across different ctDNA detection techniques, we employed a generalized linear mixed-effects model (GLMM). Specifically, we included ctDNA testing panel as a random intercept term, allowing the baseline event probability to vary by technique. This approach provides adjusted effect estimates for the predictor of interest while controlling for between-panel variability. The significance of the panel-level variance component was evaluated using a likelihood ratio test comparing the mixed-effects model to a standard logistic regression model without random effects.
Statistical analysis
Continuous variables were summarized as mean ± standard deviation, and categorical variables were described as n (%). Survival curves were estimated with the Kaplan–Meier method and compared by the log-rank test. For survival analyses, only patients with complete time-to-event data were included. All Kaplan–Meier plots report the exact numbers at risk. Hazard ratios (HRs) and 95% confidence intervals (CIs) were calculated by Cox proportional hazard regression modeling. The effects of the variables on disease progression were quantified using logistic regression and presented as ORs and 95% CIs. Variables with P < 0.05 in logistic regression models were selected for further development of ML models. The distributions of continuous variables were compared by the Wilcoxon signed-rank test. The proportions of categorical data across groups were compared using the Chi-square test or Fisher’s exact test as appropriate. Bonferroni correction was applied for multiple testing correction. Potential correlations were determined using the Spearman and Pearson methods and represented by correlation coefficients (r). P-values < 0.05 were considered statistically significant. Statistics were analyzed with R software (v4.4.1). ML algorithms and model development processes were implemented with Python (v3.12) and MATLAB (R2022a).
Results
Study overview
We compiled a large-scale, global dataset of 781 blood samples from 493 early-stage or localized NSCLC patients treated with curative intent (Fig. 1a), including the training set (n = 345) and the validation set (n = 148). The clinical characteristics are summarized in Additional file 1: Table S1. Detailed baseline data for patients from each cohort are provided in Additional file 1: Tables S2-S7. The mutational data of 2 proprietary datasets (NCC-1 and NCC-2 cohorts) are presented in Additional file 1: Tables S8-S9.
For eligible participants, pre- and post-treatment peripheral blood samples were collected before and after curative treatments, including surgery or definitive CRT with or without consolidation ICI therapy (Fig. 1b). Among 415 (84.2%) patients with pre-treatment ctDNA variant data, TP53 (51.6%), EGFR (18.1%), KRAS (12.8%), KEAP1 (9.4%), CDKN2A (7.7%), PIK3CA (6.7%), STK11 (6.0%), and SMARCA4 (4.3%) were the most frequently detected candidate driver mutations (Fig. 1c), in accordance with the expected pattern in canonical NSCLC drivers [37, 38]. In the training and validation sets, the frequency of detected alterations remained largely consistent (Fig. 1d). Comparisons of the clinical characteristics between the training and validation datasets are presented in Additional file 1: Table S10. There were no significant differences in age, sex, histopathological type, or pre-treatment ctDNA status between the two groups of patients. However, compared with the training set, the validation set included more patients with stage I disease who received surgery and who were positive for post-treatment MRD (Additional file 1: Table S10). In terms of survival outcomes, after a median follow-up of 36.7 months, the median PFS for all patients was 28.6 months (95% CI 24.4–52.0), and the median OS was 60.0 months [95% CI 60.0–not reached (NR); Additional file 2: Fig. S1].
Comprehensive features identified for model construction
A comprehensive landscape of 24 potential features was analyzed in the training set (n = 345), including clinicopathological characteristics, liquid biopsy biomarkers, ctDNA-based genomics, and treatment modalities (Fig. 2). Compared with stage II–III disease, stage I disease was significantly against the risk of progression (OR = 0.215, 95% CI 0.075–0.613; P = 0.004). Pre-treatment detectable ctDNA was significantly associated with an increased risk of disease progression (OR = 2.406, 95% CI 1.462–3.959; P < 0.001), and post-treatment MRD showed a stronger positive correlation with progression (OR = 8.665, 95% CI 4.759–15.777; P < 0.001). KEAP1 mutation was also positively correlated with disease progression (OR = 3.348, 95% CI 1.329–8.436; P = 0.010). Regarding curative-intent treatment modalities, compared with CRT alone, both CRT plus consolidation ICI (OR = 0.412, 95% CI 0.211–0.806; P = 0.010) and surgery (OR = 0.225, 95% CI 0.136–0.371; P < 0.001) significantly favored freedom from progression. VIF values for variables in the logistic regression analysis are summarized in Additional file 1: Table S11, and no evident multicollinearity was observed among the features.Fig. 2. Forest plot of potential predictors for disease progression in the training set (n = 345). OR odds ratio, CI confidence interval, ECOG Eastern Cooperative Oncology Group, Adeno Adenocarcinoma, SCC squamous cell carcinoma, ctDNA circulating tumor DNA, VAF variant allele frequency, MRD minimal residual disease, CRT chemoradiotherapy, ICI immune checkpoint inhibitor
KEAP1, STK11, and CDKN2A mutations suggest poor prognosis
We then evaluated the prognostic effects of mutations detected in peripheral blood. Among patients with available pre-treatment ctDNA genotyping data (n = 415), disease progression occurred in 53.8%, 52.0%, and 46.9% of patients with KEAP1, STK11, and CDKN2A mutations, respectively, ranking in the top 3 (Fig. 3a). Given that KEAP1 mutations frequently occur alongside other alterations (co-mutations) [39, 40], we further investigated the effect of co-occurring KEAP1 and other mutations on disease progression. Consistent with previous research [39–41], we found that KEAP1/STK11 (OR = 2.23, 95% CI 1.27–3.91; P = 0.005) and KEAP1/CDKN2A (OR = 1.84, 95% CI 1.09–3.11; P = 0.023) were associated with an increased risk of progression (Fig. 3b). Among all mutations, the overall comparison of disease progression rate revealed no significant difference (P = 0.292; Fig. 3c). However, the proportion of disease progression was significantly higher with KEAP1, STK11, and CDKN2A mutations than with other mutations (Bonferroni-corrected P = 0.045; Fig. 3c). The poor prognostic value of KEAP1, STK11, and CDKN2A mutations was further validated in the tumor tissue WES/WGS data. A total of 430 patients from TCGA with stage II–III NSCLC who received local treatment were included in the analysis. Baseline characteristics are displayed in Additional file 1: Table S12. Patients with KEAP1-mutated disease had shorter OS (median 2.41 years vs. 3.38 years; P = 0.049; Fig. 3d). Similarly, compared with STK11- and *CDKN2A-*wild-type patients, those with STK11 (median 2.21 years vs. 3.31 years; P = 0.054) and CDKN2A (median 2.61 years vs. 3.38 years; P = 0.047; Fig. 3d) mutations were associated with marginally poorer OS. Taken together, baseline KEAP1, STK11, and CDKN2A mutations detected by liquid biopsy indicate a poor prognosis, which was also confirmed by tumor tissue-based mutation sequencing data.Fig. 3. Genomic mutation biomarkers for disease progression. a Chord diagram showing KEAP1-, STK11-, and CDKN2A-mutated patients ranking in the top 3 for the proportion of disease progression, among all patients with detectable ctDNA-based variants (n = 415). b Bubble plots depicting odds ratios (ORs) for disease progression conferred by KEAP1 and co-occurring mutations estimated by logistic regression (n = 415). Bubble size indicates the OR value, and bubble color reflects the P value. c Stacked bar plots indicating the proportion of disease progression (red bar) in patients with detectable ctDNA-based variants (n = 415). Among all mutations, the overall comparison of progression revealed no significant difference (P = 0.292), while the progression rate was significantly higher with KEAP1, STK11, and CDKN2A mutations than with other mutations (Bonferroni-corrected P = 0.045). d Kaplan–Meier curves of overall survival (OS) stratified by KEAP1, STK11, and CDKN2A mutation status using tumor tissue whole-exome or whole-genome sequencing (WES/WGS) from The Cancer Genome Atlas (TCGA) database. All patients had stage II or III NSCLC and received local treatments (n = 430). ctDNA circulating tumor DNA, mut mutant, ns not significant, HR hazard ratio, CI confidence interval
Transcriptomic profiling and immune landscape of KEAP1, STK11, and CDKN2A
We next explored the transcriptomic data of KEAP1, STK11, and CDKN2A via RNA-seq of 1041 patients with LUSC or LUAD and 108 healthy control subjects. Compared with those in normal tissue, KEAP1, STK11, and CDKN2A were highly expressed in the tumor samples of NSCLC patients (P < 0.01; Additional file 2: Fig.S2a). Although the STK11, SMARCA4, and KEAP1 genes were clustered together, CDKN2A was separated from them and was in the same macrocluster with EGFR and PIK3CA (Additional file 2: Fig. S2b). Consistently, compared with those of other genes, the correlation coefficients of CDKN2A with KEAP1 (Spearman r = 0.183, P < 0.001) and CDKN2A with STK11 (Spearman r = 0.154, P < 0.001) were relatively lower (Additional file 2: Fig. S2c). Pearson correlation analyses revealed that the correlation between CDKN2A and KEAP1 was negligible (Pearson r = 0.197, P < 0.001), whereas KEAP1 was positively correlated with STK11 (Pearson r = 0.451, P < 0.001; Fig. 4a). Logistic regression suggested that KEAP1 (OR = 2.012, 95% CI 1.036–3.907; P = 0.039) and KEAP1/STK11 (OR = 2.229, 95% CI 1.272–3.906; P = 0.005) mutations were significantly associated with an increased risk of disease progression (Additional file 2: Fig.S3a). For patients with KEAP1/STK11 mutations, a higher proportion of progression was observed, compared to wild-type patients (58.2% vs. 35.6%; P = 0.004; Additional file 2: Fig. S3b). The above findings suggest that KEAP1 and STK11 may have co-mutated expression, while CDKN2A does not show a clear correlation pattern with them.Fig. 4. Immune landscape of KEAP1-, STK11-, and *CDKN2A-*mutant tumors. a Scatter plot of Pearson correlation analyses for KEAP1, STK11, and CDKN2A. Blue dots refer to the expression of KEAP1 and STK11 genes, and the blue fitted curve indicates a positive correlation (r = 0.451). Red dots refer to the expression of CDKN2A, and the red fitted curve indicates a negligible correlation between KEAP1 and CDKN2A (r = 0.197). b Volcano plot displaying differentially expressed genes in KEAP1-, STK11-, and CDKN2A-mutated tumors. c Bubble chart illustrating the Gene Ontology/Kyoto Encyclopedia of Genes and Genomes (GO/KEGG) pathway enrichment analysis of down-regulated genes. d Heatmap indicating the infiltrating immune cells in the KEAP1-, STK11-, and CDKN2A-mutated tumors. e Gene set enrichment analysis (GSEA) plots showing enriched pathways in the down-regulation of immune cells. ^^P < 0.05, ^^P < 0.01, ^^P < 0.001. TPM transcripts per million, BP biological process, CC cellular component, MF molecular function, P_adj adjusted P-value, Tem T effector memory, TFH T follicular helper, Tgd T gamma delta, Th T helper, pDC plasmacytoid dendritic cell, iDC immature dendritic cell, DC dendritic cell, aDC activated dendritic cell, Dn downregulated, CENP centromere protein, HMG high mobility group
Furthermore, a volcano plot of the differentially expressed genes in KEAP1/STK11/CDKN2A-mutated patients is shown in Fig. 4b. The down-regulated genes were significantly enriched in pathways associated with humoral immune responses and macrophage regulation (Fig. 4c). Consistently, immune infiltration analysis revealed striking reductions in various immune cells in KEAP1-, STK11- or CDKN2A-mutated tumors (Additional file 2: Fig. S4), characterizing the suppressive tumor immune microenvironment (TIME). Among them, eosinophils, mast cells, and T helper 17 cells were concomitantly decreased in KEAP1-, STK11-, and CDKN2A-mutated tumors (Fig. 4d). GSEA plots (Fig. 4e) confirmed the downregulation of pathways associated with macrophage differentiation [normalized enrichment score (NES) = −2.026, false discovery rate (FDR) < 0.001], mast-cell activation (NES = −1.851, FDR = 0.006), and B-cell-mediated immunity (NES = -1.755, FDR = 0.026; Additional file 2: Fig.S5), highlighting distinct humoral immunosuppression. Taken together, mutations in KEAP1, STK11, and CDKN2A could collectively drive a suppressive “cold” TIME, attenuate humoral immunity, and confer poor prognosis.
Multi-modal features effectively predict the risk of disease progression
On the basis of our above findings, several multi-modality features were applied to develop the PRIME model, including stage, pre-treatment ctDNA detection, treatment modality, post-treatment MRD, and mutations in KEAP1, STK11, and CDKN2A. In the training set (n = 345), most disease progression events occurred in patients characterized by stage II–III disease, baseline ctDNA positivity, CRT alone, and detectable MRD (Fig. 5a). The Sankey diagram also illustrated that, although some data were unavailable for several features (Additional file 1: Table S13), most of the missing values were MAR and no systematic redirection contradicting the MAR assumption was observed (Fig. 5a). For patients with stage II–III disease, PFS was significantly shorter than those with stage I disease (median 18.6 months vs. NR; P < 0.001; HR = 3.340, 95% CI 1.975–5.649; Fig. 5b). Moreover, patients with positive ctDNA at baseline had significantly poorer PFS than those with negative ctDNA (median 15.9 months vs. 64.0 months; P < 0.001; HR = 2.256, 95% CI 1.523–3.342; Fig. 5c). Resectable patients treated with surgery had significantly longer PFS than unresectable patients receiving CRT alone (median NR vs. 15.5 months; P < 0.001); however, PFS for patients who underwent surgery was numerically longer than PFS for unresectable patients who received CRT plus consolidation ICI (median NR vs. 24.4 months;* P* = 0.118; Fig. 5d). Patients with detectable MRD had significantly shorter PFS than those with undetectable MRD (median 10.4 months vs. 34.9 months; P < 0.001; HR = 3.672, 95% CI 2.546–5.297; Fig. 5e). Overall, each of the above factors could effectively predict the risk of progression when used individually. Thus, we integrated the aforementioned key features into a model that employs ML algorithms to enhance predictive accuracy.Fig. 5. Predictive effects of identified multi-modality features in the training set (n = 345). a Sankey plot depicting identified variables in the training set (n = 345). b Kaplan–Meier curves of progression-free survival (PFS) stratified by stage in the training set (n = 306). Thirty-nine patients were excluded from analysis: 37 due to missing time-to-event data and 2 due to lack of stage information. c Kaplan–Meier curves of PFS stratified by pre-treatment ctDNA status (n = 271), with 37 patients excluded from analysis due to missing time-to-event data and 37 due to unavailable ctDNA testing results. d Kaplan–Meier curves of PFS stratified by treatment modalities (n = 308), with 37 patients excluded from analysis due to missing time-to-event data. e Kaplan–Meier curves of PFS stratified by post-treatment MRD (n = 250), with 37 patients excluded from analysis due to missing time-to-event data and 58 due to unavailable MRD. ctDNA circulating tumor DNA, MRD minimal residual disease, NA not available, CRT chemoradiotherapy, ICI immune checkpoint inhibitor, NR not reached, HR hazard ratio, CI confidence interval
Superior prediction performance of the NN-based PRIME model
We first developed a logistic regression model by simply combining the efficient features together to predict the risk of progression, and the AUC for this combined model was 0.79 (95% CI 0.74–0.85; Additional file 2: Fig. S6). To further increase the predictive effects, we constructed ML-based models using 6 different ML algorithms. The NN-based PRIME model demonstrated optimal prediction performance, with an AUC of 0.85 (95% CI 0.81–0.89) in the training set, compared with decision tree (AUC = 0.77, 95% CI 0.72–0.82; DeLong’s test P = 0.0001), RUSBoost (AUC = 0.78, 95% CI 0.73–0.83; DeLong’s test P = 0.0002), naive Bayes (AUC = 0.77, 95% CI 0.72–0.82; DeLong’s test P = 0.0006), SVM (AUC = 0.76, 95% CI 0.69–0.82; DeLong’s test P < 0.0001), and KNN (AUC = 0.79, 95% CI 0.74–0.83; DeLong’s test P = 0.0093; Fig. 6a). F1-score, accuracy, precision, and recall for each model are summarized in Additional file 1: Table S14. The NN-PRIME model (AUC = 0.85, 95% CI 0.81–0.89) was significantly superior to individual predictors, including clinical stage (AUC = 0.60, 95% CI 0.56–0.64; DeLong’s test P < 0.0001), pre-treatment ctDNA (AUC = 0.60, 95% CI 0.55–0.65; DeLong’s test P < 0.0001), treatment modality (AUC = 0.67, 95% CI 0.61–0.72; DeLong’s test P < 0.0001), post-treatment MRD (AUC = 0.71, 95% CI 0.66–0.76; DeLong’s test P < 0.0001), and mutations in KEAP1, STK11, and CDKN2A (AUC = 0.58, 95% CI 0.53–0.63; DeLong’s test P < 0.0001; Fig. 6b). Given the positive correlation between KEAP1 and STK11, as well as the adverse prognostic impact of KEAP1/STK11 co-mutations, we tested KEAP1/STK11 as a composite variable. However, merging KEAP1 and STK11 into a single feature did not improve model performance compared with treating KEAP1, STK11, and CDKN2A as 3 separate features (AUC 0.85, 95% CI 0.81–0.89 vs. 0.85, 95% CI 0.81–0.89 in the training set; AUC 0.79, 95% CI 0.71–0.87 vs. 0.82, 95% CI 0.74–0.89 in the validation set; Additional file 2: Fig. S7). Ultimately, the NN-PRIME model retained the following 7 key predictors: stage, pre-treatment ctDNA, treatment modality, post-treatment MRD, and mutations in KEAP1, STK11, and CDKN2A.Fig. 6. Neural network (NN)-based PRIME model construction, interpretation, and validation. a Receiver operating characteristic (ROC) curves of 6 different machine learning algorithms to develop the PRIME model in the training set (n = 345). b ROC curves comparing the NN-PRIME model to 5 individual features. c SHapley Additive exPlanations (SHAP) analysis of the NN-PRIME model. d ROC curves of 6 different machine learning algorithms to validate the PRIME model in the validation set (n = 148). e Kaplan–Meier curves of progression-free survival (PFS) stratified by progression risk predicted by NN-PRIME for patients in the validation set (n = 100). Forty-eight patients were excluded from analysis due to missing time-to-event data. f Stacked bar plots showing the proportion of progression (orange bar) in low-risk vs. high-risk patients using personalized-panel or fixed-panel ctDNA sequencing techniques. g Kaplan–Meier curves of PFS stratified by NN-PRIME for patients with stage I disease (n = 123), with 7 stage I patients excluded from analysis due to missing time-to-event data. Eighty-five patients without time-to-event data, and 2 without stage information, were excluded from analysis. h Kaplan–Meier curves of PFS stratified by NN-PRIME for patients with stage II disease (n = 100), with 11 stage II patients excluded from analysis due to missing time-to-event data. i Kaplan–Meier curves of PFS stratified by NN-PRIME for patients with stage III disease (n = 183), with 54 stage III patients excluded from analysis due to missing time-to-event data. j Stacked bar plots showing the proportion of disease progression (orange bar) in low-risk vs. high-risk patients identified by NN-PRIME, in patients receiving surgery, CRT alone, or CRT plus consolidation ICI therapy. k Kaplan–Meier curves of disease-free survival (DFS) stratified by NN-PRIME and adjuvant therapy (ADT) in the NCC-2 cohort (n = 103). TPR true positive rate, AUC area under the curve, RUSBoost random under-sampling boosting, SVM support vector machine, KNN K-nearest neighbors, FPR false positive rate, MRD minimal residual disease, ctDNA circulating tumor DNA, Post post-treatment, CRT chemoradiotherapy, Pre pre-treatment, NN neural network, NR not reached, HR hazard ratio, CI confidence interval, ICI immune checkpoint inhibitor, ADT adjuvant therapy, PRIME Progression Risk prediction by Interpretable Machine learning on ctDNA-MRD, Mutations, and clinical-therapeutic features
To further interpret the model, all contributing features were ranked with SHAP analysis. MRD, treatment modality, and baseline ctDNA status emerged as the top 3 contributors, both in terms of SHAP values and overall contribution (Additional file 2: Fig. S8). Specifically, the average predicted value across all samples was 0.441, and post-treatment MRD contributed positively to the NN-PRIME prediction (+0.306), suggesting an increased likelihood of predicting the positive class (Fig. 6c). CRT alone also contributed positively (+0.128). Detectable baseline ctDNA and stage II–III disease modestly increased the predicted probability (+0.043 and +0.026, respectively). In contrast, wild-type KEAP1, STK11, and CDKN2A mutations made negative contributions to the model output of progression (Fig. 6c).
Moreover, we evaluated ML-based models in the validation set, where NN-PRIME maintained good performance with an AUC of 0.82 (95% CI 0.74–0.89), and the AUCs were 0.70 (95% CI 0.61–0.78) for decision tree, 0.69 (95% CI 0.60–0.78) for RUSBoost, 0.79 (95% CI 0.71–0.86) for naive Bayes, 0.74 (95% CI 0.59–0.88) for SVM, and 0.76 (95% CI 0.67–0.84) for KNN (Fig. 6d). Hence, according to the predicted results of NN-PRIME, patients were classified into low- or high-risk groups of disease progression. In the validation set, high-risk patients had significantly poorer PFS than low-risk patients (median 15.0 months vs. NR; P < 0.001; HR = 7.294, 95% CI 3.225–16.495; Fig. 6e). For all patients or patients in the training set, the PFS of the high-risk group was significantly shorter than that of the low-risk group (P < 0.001; Additional file 2: Fig. S9).
Robustness and applicability of NN-PRIME across diverse clinical scenarios
Next, we tested the generalizability and reliability of the NN-PRIME model. Sensitivity analyses based on complete-case analysis yielded virtually identical AUCs (0.85 vs. 0.83 in the training set; 0.82 vs. 0.80 in the validation set), confirming good model robustness (Additional file 2: Fig. S10). NN-PRIME effectively identified the risk of treatment failure (Fig. 6f) and stratified PFS (P < 0.001; Additional file 2: Fig. S11) irrespective of whether personalized-panel (n = 200) or fixed-panel (n = 293) ctDNA sequencing techniques were used. We also estimated ctDNA panel-specific random intercepts using GLMM, and no significant between-panel heterogeneity was observed (variance = 0, likelihood-ratio test P > 0.99; Additional file 1: Table S15). Subgroup analyses further illustrated that, after cross-platform harmonization, NN-PRIME retained consistent performance regardless of sequencing platform, ctDNA detection technique, or patient cohort (Additional file 2: Fig. S12), highlighting that technical variability did not compromise predictive accuracy.
High-risk patients identified by NN-PRIME had significantly worse PFS, irrespective of whether patients were at stage I (P < 0.001; HR = 10.943, 95% CI 3.994–29.981; Fig. 6g), stage II (P < 0.001; HR = 3.650, 95% CI 1.924–6.924; Fig. 6h), or stage III disease (P < 0.001; HR = 2.439, 95% CI 1.647–3.610; Fig. 6i). In terms of treatment regimens, for patients receiving surgery (n = 279; progression occurred in 21.0% of low-risk patients vs. 73.3% of high-risk patients; P < 0.001), CRT alone (n = 134; progression occurred in 25.6% of low-risk patients vs. 83.5% of high-risk patients; P < 0.001), or CRT plus consolidation ICI (n = 80; progression occurred in 35.2% of low-risk patients vs. 88.9% of high-risk patients; P = 0.006), NN-PRIME exhibited consistency in predicting treatment failure risk (Fig. 6j) and survival outcomes (Additional file 2: Fig. S13). In patients with resectable or unresectable stage II–III NSCLC, based on the treatment administered, the high-risk subgroup had a significantly greater risk of disease progression (P < 0.001; Additional file 2**:** Fig. S14). Subgroup analyses indicated that across all the clinical subgroups, high-risk patients identified by PRIME had a significantly greater risk of disease progression (P < 0.05; Additional file 2: Fig. S15). Notably, for patients with resectable NSCLC in the NCC-2 cohort, we observed that high-risk patients could significantly benefit more from adjuvant therapy (ADT) after radical surgery (P < 0.001), whereas there was no significant difference between low-risk patients with or without ADT (P = 0.928; Fig. 6k). In summary, NN-PRIME manifested good robustness and applicability across diverse clinical settings. The high-risk patient subgroup, which faced a greater risk of treatment failure, was poised to benefit significantly from intensified ADT strategies.
Discussion
With increasing evidence from translational studies attesting to the predictive benefit of liquid biopsies, their use is being promoted and applied in real-world clinical practice [42–45]. Although ctDNA-MRD has achieved success in identifying disease relapse early, the predictive power of single liquid biopsy biomarkers is limited, with inconsistent predictive ability in various clinical scenarios [9, 10]. To date, large-scale data derived from different sequencing platforms that use blood samples from diverse populations, to test the generalizability of ctDNA-based predictions are lacking [46]. Using a global dataset of liquid biopsy and clinical-genomic variables from 493 patients with localized NSCLC, we developed and externally validated the NN-PRIME model. NN-PRIME achieved AUCs of 0.85 (95% CI 0.81–0.89) and 0.82 (95% CI 0.74–0.89) in the training and validation sets, respectively, outperforming single MRD testing and other machine-learning algorithms (all DeLong’s test P < 0.05). These data suggest that integrating ctDNA MRD with blood-based mutations and clinical features could refine post-treatment risk stratification and facilitate early, personalized clinical decision-making.
Compared with most traditional ML prediction studies, NN-PRIME was built on clinically relevant variables. The genomic components were further corroborated by external tissue WES/WGS analyses and transcriptomic profiling, and the contribution of each feature was quantified by SHAP analysis. These steps may collectively enhance the interpretability and predictive performance of NN-PRIME for therapeutic outcomes. Instead of using all factors shared among participants or simply performing feature ranking calculations, such as random forest methods, to include variables in the ML model development, we selected predictors essentially impacting clinical outcomes to construct PRIME. This could be one of the key reasons why the PRIME model has good performance and excellent generalizability across different patient populations and treatment regimens. Previous publications have also compared the performance of various ML algorithms in predicting outcomes [47–49]. Chang et al. [19] introduced a six-feature logistic LASSO regression model to predict response to immunotherapy (LORIS) using pan-cancer data. Six features were utilized, including age, tumor mutational burden (TMB), blood albumin level, neutrophil–lymphocyte ratio [19]. However, the authors identified these 6 features from 8 variables shared by most subjects using feature importance analysis [19], which may lead to insufficient interpretability of the included factors. Specifically, the predictive impact of age and blood albumin on the objective response to immunotherapy is uncertain. This could also explain why LORIS had AUC values of 0.66–0.77 in patients with NSCLC [19], while NN-PRIME could achieve an AUC of 0.85.
In addition to the interpretable features and enhanced predictive performance of PRIME, another obvious advantage is the readily accessible predictors, which provide great convenience for the real-world application of this model. Especially for patients with unresectable localized NSCLC, obtaining adequate tumor tissue samples for genetic profiling is difficult [50]. Our findings suggest that genetic mutations, including KEAP1, STK11, and CDKN2A, identified in peripheral blood could effectively predict outcomes as well. On this basis, combining blood-based genomic features with ctDNA-MRD and clinical characteristics can achieve more robust prediction of outcomes, providing guidance for risk-adaptive ADT. Zhao et al. [49] constructed a decision tree model (DT10) to predict immunotherapy efficacy in patients with metastatic NSCLC using tissue-based mutation, histology, TMB, etc., and the AUC of this tumor tissue-based model ranged between 0.79 and 0.83 [49], which is comparable to that of our blood-based PRIME model (AUC 0.82–0.85), suggesting that the predictive model based on liquid biopsy has similar reliability to the tissue-derived predictions. Given that Zhao et al. [49] also identified the pivotal prognostic effect of KEAP1/STK11 mutations, this could further confirm our findings from the dimension of tumor tissue.
We observed that STK11, KEAP1, and CDKN2A could increase the risk of disease recurrence. RNA-seq analyses further revealed significantly decreased infiltration of eosinophils, mast cells and T-helper 17 cells, together with downregulated macrophage differentiation, mast-cell activation and B-cell-mediated immunity, in STK11-, KEAP1-, and CDKN2A-mutated tumors, indicating the suppression of humoral immune function collectively driven by these cells and pathways. Although previous studies have shown that tumor tissue-based STK11, KEAP1, and CDKN2A/B mutations are adverse prognostic factors [51, 52], we further confirm that ctDNA-based STK11, KEAP1, and CDKN2A can predict unfavorable outcomes in patients with non-metastatic NSCLC. Prior research has suggested that tumors with STK11, KEAP1, or CDKN2A mutations are characterized by attenuation of T cell-mediated adaptive immunity or innate immunity [53, 54]. Our findings further elucidate that the downregulation of innate humoral immune responses may be a more important reason for their adverse prognostic impacts. We also observed that modeling KEAP1/STK11 co-mutation as a single feature did not improve prediction over treating the two mutations separately. This reflects that merging KEAP1 and STK11 into one variable may prevent the model from capturing biologically relevant nuances. For instance, KEAP1 primarily affects the Nrf2-antioxidant signaling pathway, STK11 loss impairs cell polarity and energy metabolism, and CDKN2A mainly exerts influence through cell-cycle regulation [55–57]. Compressing these mutations into one composite feature risks obscuring these nuanced, pathway-specific impacts and their complex interplay with clinical factors such as disease stage and ctDNA status. Retaining KEAP1, STK11, and CDKN2A as separate inputs allows the model to exploit their individual prognostic value and thereby enhances predictive accuracy.
It is noteworthy that PRIME can successfully identify the high-risk subgroup in early-stage NSCLC patients, particularly in stage I (HR = 10.943, 95% CI 3.994–29.981) and stage II (HR = 3.650, 95% CI 1.924–6.924) patients. In the NCC-2 cohort, PRIME-defined high-risk patients derived marked benefit from post-surgical ADT (P < 0.001), whereas no significant survival difference was observed between low-risk patients with or without ADT (P = 0.928). According to CheckMate-816 [58], IMpower010 [59], and KEYNOTE-091 [60], perioperative immunotherapy brings therapeutic benefits to patients with resectable stage IB–IIIA NSCLC. However, not all early-stage patients could benefit from perioperative immunotherapy. In the CheckMate-816 trial, there was no significant difference in event-free survival between stage IB–II patients receiving neoadjuvant chemotherapy alone and those receiving chemoimmunotherapy [58]. Therefore, early and precise identification of patient subgroups with poorer prognoses and higher risks of treatment failure is vital for patients with early-stage NSCLC to guide personalized and risk-adaptive perioperative immunotherapy [61, 62].
The more pronounced risk stratification effect of NN-PRIME in early-stage patients may be attributed to biological differences across stages. Early-stage tumors typically exhibit lower genomic complexity and fewer subclonal evolutions, allowing liquid biopsy-based genotyping to more reliably capture dominant aggressive clones [63, 64]. In contrast, locally advanced stage III tumors often harbor greater intratumoral heterogeneity, which may dilute the prognostic signal of blood-derived mutations at baseline [65, 66]. Besides, the predictive role of ctDNA-MRD status is more corroborative in early-stage NSCLC patients who undergo surgical resection, while the accuracy of post-CRT MRD in predicting outcomes may be confounded by the impact of consolidation immunotherapy [44]. Furthermore, we revealed that NN-PRIME achieved superior risk stratification in patients undergoing surgery or CRT alone (P < 0.001), compared to those receiving CRT plus consolidation ICIs (P = 0.006). This differential performance may stem from PRIME-identified high-risk patients having inherently poorer outcomes and thus potentially deriving greater benefits from consolidation immunotherapy after CRT. This also indirectly reflects PRIME’s potential to guide personalized and risk-adaptive treatment decisions, particularly as we demonstrated that high-risk patients benefited substantially from intensified ADT after surgery, while low-risk patients showed no significant benefit. In the future, the PRIME model will be verified in a prospective, multicenter, phase II trial (ClinicalTrials.gov identifier: NCT06998719). This study will enroll localized NSCLC patients receiving neoadjuvant immunotherapy followed by either surgery plus adjuvant immunotherapy, or definitive CRT plus consolidation immunotherapy, aiming to further confirm the prognostic performance of the model and to evaluate its utility for predicting benefit from perioperative immunotherapy.
This study had several limitations. First, research subjects had a certain degree of heterogeneity, comprising patients with stage I–III NSCLC, resectable or unresectable disease, and those treated with curative-intent surgery or radiotherapy, which may introduce potential bias. Nevertheless, NN-PRIME maintained robust prediction across all examined subgroups. Second, ctDNA profiling was performed using different techniques, including fixed-panel and personalized-panel. This is consistent with the situation in which patients receive ctDNA testing in the real world, and PRIME effectively predicts the risk of disease progression in patient subgroups using different ctDNA sequencing platforms, providing a reference for real-world clinical practice. Third, owing to limited data resources, we analyzed disease progression risk and PFS, but not OS. However, there is high-level evidence indicating that DFS and PFS are valid surrogate endpoints for OS in patients with early-stage and localized NSCLC [67]. In addition, there is some missing data in certain analyses, which should be taken into account when generalizing the findings. Lastly, the mechanisms underlying the adverse prognostic impact of STK11, KEAP1, and CDKN2A mutations, currently inferred from tumor RNA-seq data and bioinformatic analyses, remain to be experimentally validated in future in vivo and in vitro fundamental research.
Conclusions
In conclusion, we developed PRIME, an interpretable AI-driven model trained on global datasets. After integrating liquid biopsy biomarkers, genomic mutations, with other clinical informative features, PRIME enabled early identification of progression risk in stage I–III NSCLC patients treated with curative intent. The NN-PRIME model demonstrated superior predictive performance compared to single ctDNA-MRD assays and other ML models (all DeLong’s test P < 0.05), with robust applicability and practicality across diverse clinical scenarios. In addition, patients identified as high-risk by NN-PRIME showed significantly worse prognoses but could potentially derive greater benefits from ADT, highlighting the potential of NN-PRIME to facilitate risk-stratified clinical decision-making. Future investigation is warranted to prospectively explore the incorporation of PRIME into routine clinical practice to improve patient outcomes and advance therapeutic personalization.
Supplementary Information
Additional file 1. Table S1 Baseline characteristics of patients from all cohorts (n = 493). **Table S2 **Clinical, treatment and ctDNA data for patients in the NCC-1 cohort (n = 105). Table S3 Clinical, treatment and ctDNA data for patients in the NCC-2 cohort (n = 103). Table S4 Clinical, treatment and ctDNA data for patients in the Stanford cohort (n = 37). Table S5 Clinical, treatment and ctDNA data patients in the LUCID cohort (n = 100). Table S6 Clinical, treatment and ctDNA data for patients in the TRACERx cohort (n = 100). Table S7 Clinical, treatment, and ctDNA data for patients in the Moding et al. cohort (n = 48). Table S8 Mutational data of patients in the NCC-1 cohort (n = 105). Table S9 Mutational data of patients in the NCC-2 cohort (n = 103). Table S10 Comparison of baseline characteristics of patients in the training set and validation set. Table S11 The VIF for each feature in the logistic regression analysis. Table S12 Baseline information and variants data for patients in the TCGA WES/WGS validation cohort (n = 430). Table S13 Missing data summary in the training set (n = 345). Table S14 F1-score, accuracy, precision, and recall for each model. Table S15 Generalized linear mixedeffects model of disease progression across different ctDNA detection techniques.Additional file 2. Fig. S1 Survival outcomes. Fig. S2 RNA-sequencing (RNA-seq) analysis of KEAP1, STK11, and CDKN2A mutations in the Cancer Genome Atlas (TCGA) database. Fig. S3 Prognostic effects of KEAP1/STK11 mutations in the overall patient cohort. Fig. S4 Immune infiltration analysis of KEAP1/STK11/CDKN2A mutations. Fig. S5 Gene set enrichment analysis (GSEA) ridge plots showing the normalized enrichment score (NES), adjusted P-value, and false discovery rate (FDR) for significantly enriched gene sets. Fig. S6 Receiver operating characteristic (ROC) curve for the combined model based on logistic regression. Fig. S7 Comparison of model performance with composite vs. separate genomic features. Fig. S8 SHapley Additive exPlanations (SHAP) for neural network (NN)-based PRIME model. Fig. S9 Progression-free survival stratified by NN-PRIME in all patients (a) and in the training set (b). Fig. S10 Sensitivity analyses of NN-PRIME model robustness. Fig. S11 Progression-free survival stratified by NN-PRIME in patients receiving personalized-panel (tumor-informed) ctDNA testing (a) and in patients receiving fixed-panel (tumor-naïve) ctDNA testing (b). Fig. S12 Subgroup analyses of NN-PRIME model performance in different ctDNA sequencing platforms, detection techniques, and patient cohorts. Fig. S13 Kaplan-Meier curves of survival outcomes in patients with different treatment regimens. Fig. S14 Proportion of disease progression in low-risk vs. high-risk patients stratified by NN-PRIME in resectable or unresectable stage II–III NSCLC patients. Fig. S15 Forest plot of logistic regression indicating high-risk patients identified by NN-PRIME correlated with poorer outcomes across various clinical subgroups.