Comparative meta-analysis of robot- and video-assisted surgery for thymoma: efficacy, learning curve, and economic burden in 7347 patients
Guohang Shen, Yupei Dai, Yaxu Xin, Kaiyong Wang, Haobo Zhang, Yang Chen, Linyun Wang, Zongxin Li, Feng Li, Fengli Gao

TL;DR
This study compares robot-assisted and video-assisted surgery for thymoma, finding robot-assisted surgery has better recovery and fewer complications but higher costs.
Contribution
A meta-analysis comparing robot-assisted and video-assisted thymoma surgery with a focus on learning curves and economic burden.
Findings
Robot-assisted surgery showed lower conversion rates, reduced blood loss, and fewer complications.
Operative times for robot-assisted surgery decreased significantly after 20 procedures.
Hospitalization costs were higher for robot-assisted surgery despite similar mortality rates.
Abstract
This meta-analysis systematically evaluates the perioperative outcomes, learning curve, and hospitalization costs of robot-assisted thoracoscopic surgery (RATs) compared to video-assisted thoracoscopic surgery (VATs) for thymoma resection. A comprehensive literature search was conducted in PubMed, Embase, Web of Science, and the Cochrane Library, with the final update in June 2025, following PRISMA guidelines. Constant-effects model or random-effects model was used based on heterogeneity, and subgroup analyses were performed accordingly. A total of 30 studies involving 7,347 patients (RATs: 3,122; VATs: 4,225) were included, and 17 outcome indicators were analyzed. Compared with VATs, RATs showed lower conversion rates, reduced blood loss, shorter chest tube duration, and fewer complications—including pulmonary infections—while operative time and hospital stay differences were modest.…
Genes, proteins, chemicals, diseases, species, mutations and cell lines named across the full text — each resolved to its canonical identifier and authoritative record.
Click any figure to enlarge with its caption.
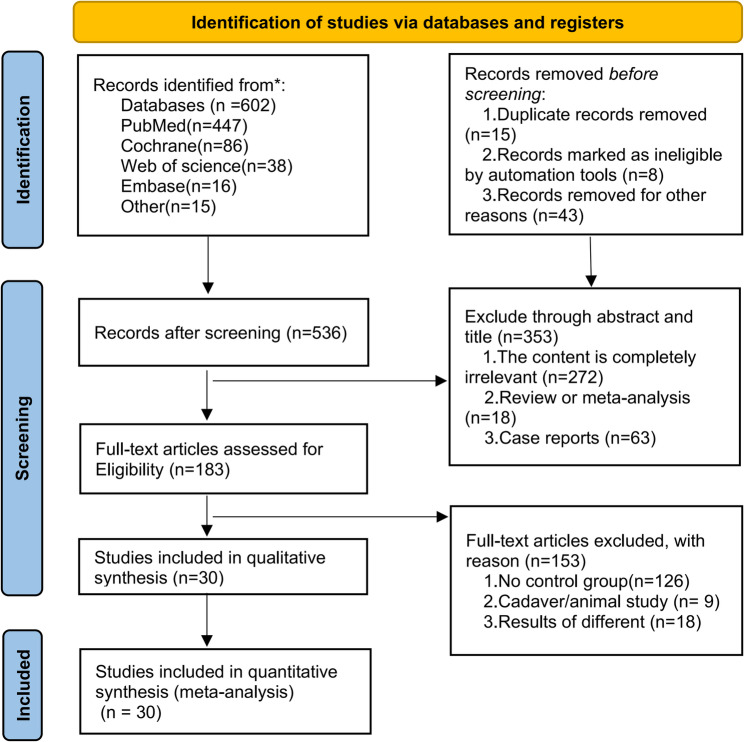 Figure 1
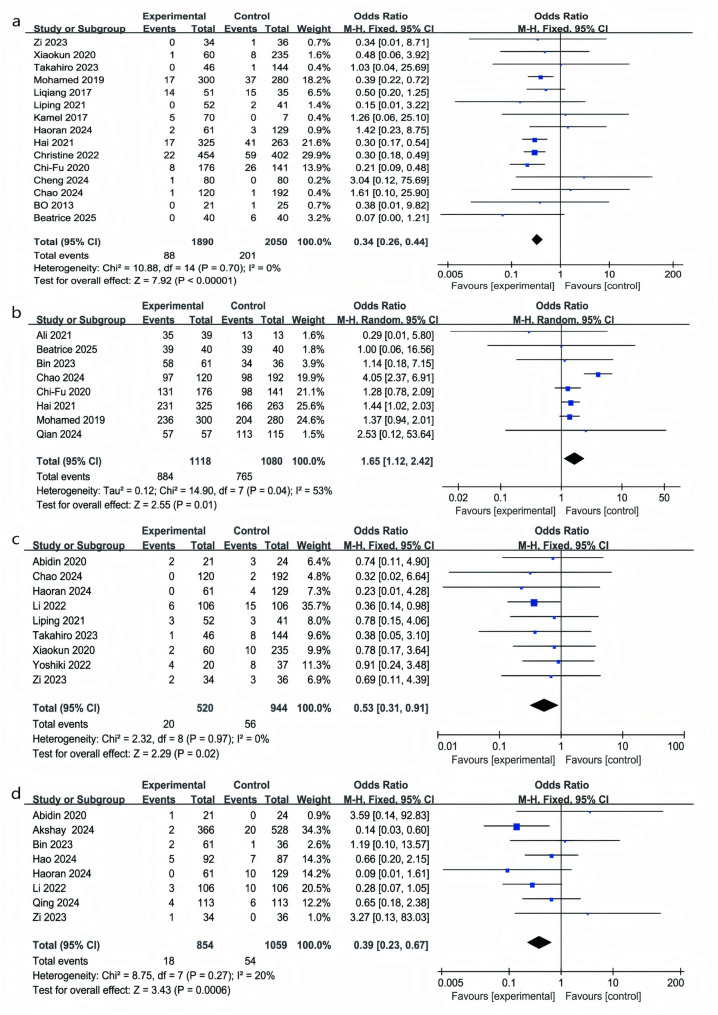 Figure 2
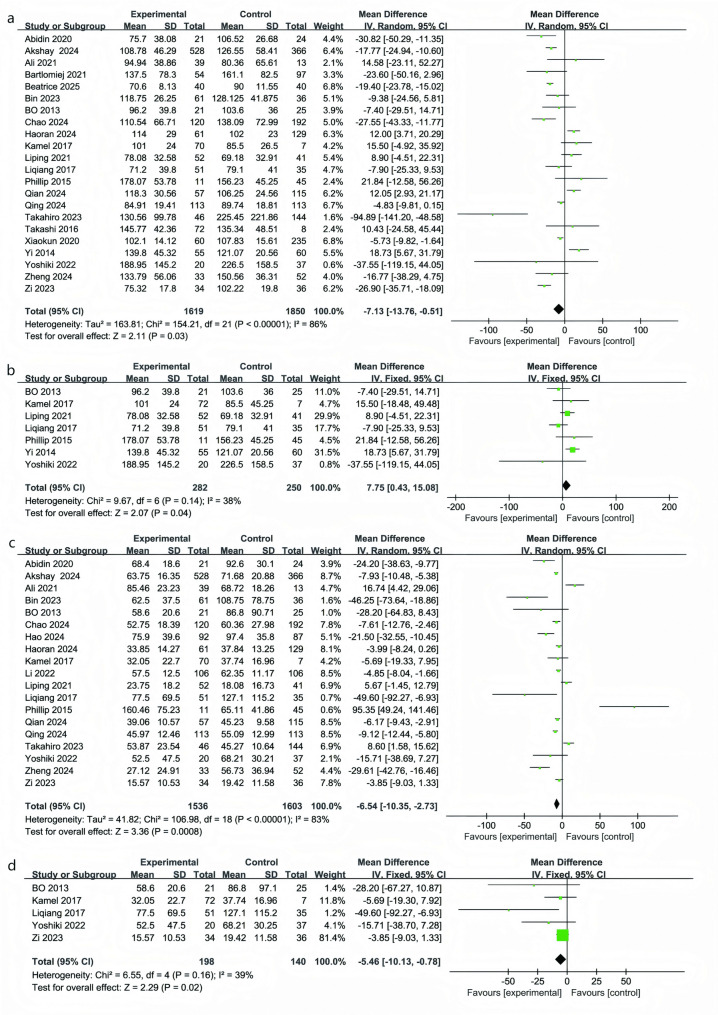 Figure 3
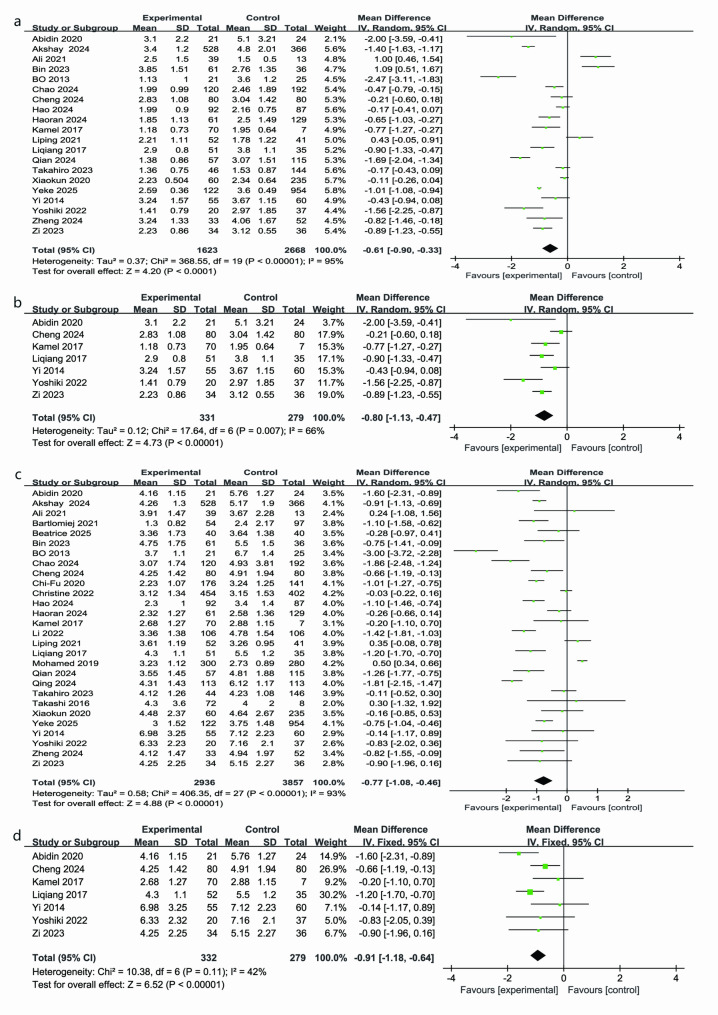 Figure 4
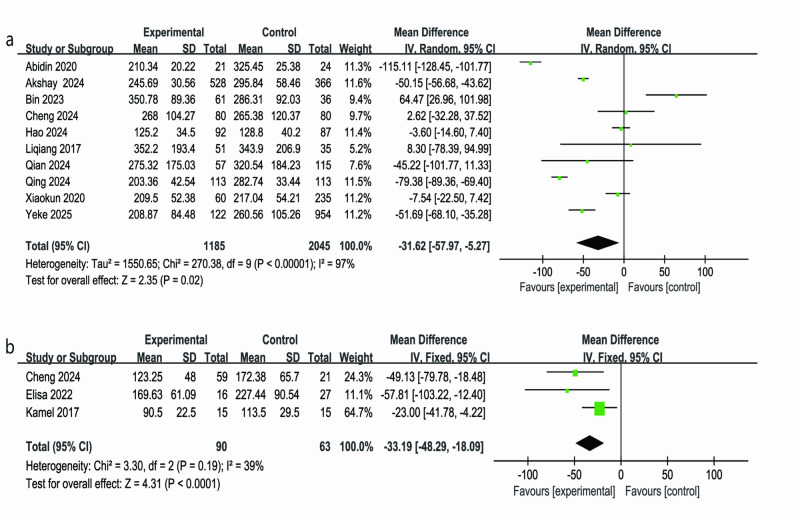 Figure 5
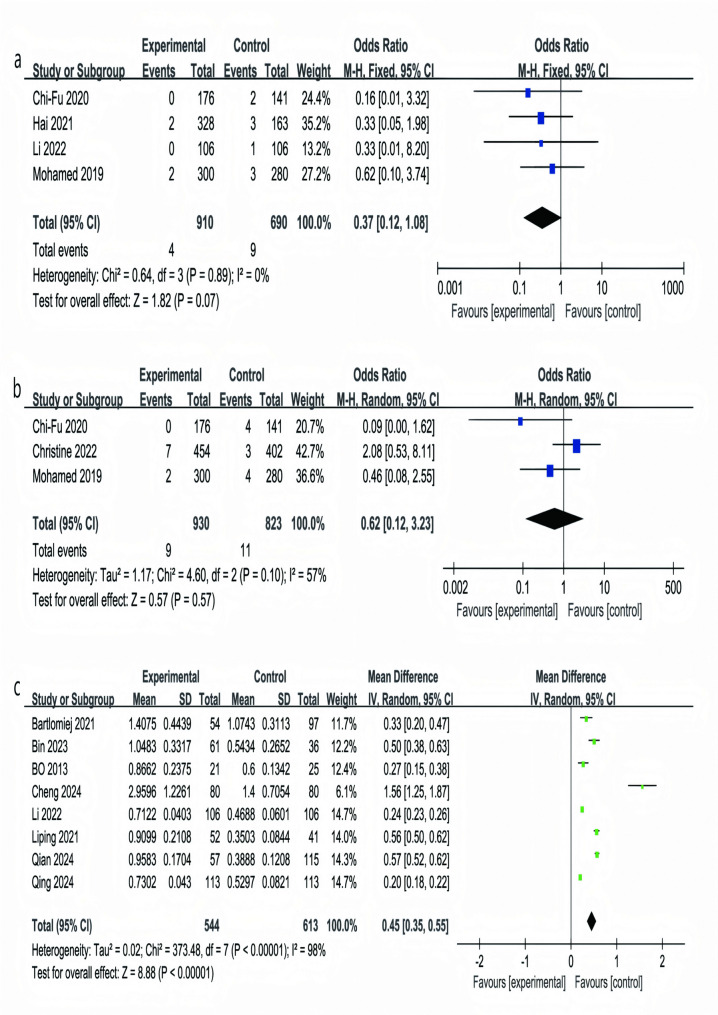 Figure 6
- —宁夏回族自治区自然科学基金, 中国
Peer Reviews
No public reviews on file for this paper yet. If you reviewed it on a platform where reviews are public (OpenReview, ICLR, NeurIPS, ICML), you can paste yours below so the community can read it here.
Videos
No videos yet. Explain this paper in a talk, walkthrough, or lecture? Add one.
Taxonomy
TopicsMyasthenia Gravis and Thymoma · Thyroid and Parathyroid Surgery · Lymphatic Disorders and Treatments
Introduction
Thymectomy remains the gold standard for thymic diseases, especially primary tumors, thymic cysts, suspected anterior mediastinal masses, and myasthenia gravis (MG) [1]. The principal goal in the management of thymic pathologies, particularly thymoma and thymic cysts, is complete surgical excision to alleviate mass effect and achieve optimal disease control. For localized or early-stage thymoma, surgical resection remains the standard and most effective treatment, which can be performed through thoracoscopic, robot-assisted, or conventional open approaches [2]. This procedure not only ensures complete tumor removal but also prolongs survival, particularly in the absence of distant metastasis [3]. For patients with localized thymoma, surgical resection remains the treatment of choice, and minimally invasive techniques, such as thoracoscopic or robot-assisted surgery, can significantly reduce postoperative recovery time and the risk of complications [4]. However, no consensus has been reached on the optimal surgical technique, and the choice often depends on the surgeon’s experience and judgment [5].
With the increasing adoption of RATs, RATs has become an increasingly utilized technique for thymectomy. Compared with conventional VATs, the da Vinci Surgical System offers superior maneuverability through articulated instruments, enabling precise dissection in confined anatomical areas [6]. The robotic instrument’s wrist mechanism enhances precision, allowing for greater flexibility during surgery [7, 8]. Furthermore, the system’s capability to filter out physiological tremors enhances surgical precision and reduces intraoperative risk, thereby improving overall procedural quality [9, 10].
Although a few meta-analyses have compared the perioperative outcomes of different thymectomy techniques for thymoma—including operative time, hospital stay, blood loss, and the need for adjuvant therapy—they were limited by small sample sizes and narrow literature coverage [11, 12]. Moreover, these studies mainly focused on traditional clinical endpoints, overlooking key aspects such as R0 resection rate, hospitalization costs, surgeons’ learning curves, and outcomes of the full lateral approach. The present meta-analysis addresses these gaps by comparing perioperative outcomes, learning curves, and economic factors between RATs and VATs, emphasizing clinical efficacy, complications, and postoperative recovery.
Methods
Literature and database search strategy
We conducted this systematic review and meta-analysis in accordance with PRISMA guidelines and was preregistered on PROSPERO, https://www.crd.york.ac.uk/PROSPERO/ (registration no. CRD420251118017) [13]. Up to June 2025, relevant literature was retrieved from PubMed (biomedical database), the Cochrane Library, Embase and Web of Science. Target studies were identified using controlled vocabulary and keywords including “thymoma,” “robot-assisted,” and “video-assisted.” For example, the PubMed search string was: ((((thymoma) OR (Thymoma)) OR (mediastinal tumor)) OR (mediastinal)) AND ((((((((da Vinci) OR (Robot)) OR (robot)) OR (robotic)) OR (robot-assisted)) OR (robotic-assisted)) OR (robotic-assisted thoracic surgery)) AND (((((((vat) OR (VATs)) OR (VAT)) OR (Thoracoscope)) OR (video assisted thoracic surgery)) OR (video)) OR (thoracoscopic))).Only English-language publications were included in the analysis. Citation lists from the relevant clinical studies and meta-analyses were examined manually to identify additional applicable reports. Two reviewers independently screened and assessed the initially retrieved records. To avoid duplication of data from the same cohort, when multiple reports originated from a single study, only the most comprehensive or most recent report was included.
Eligibility criteria and data extraction
Eligibility criteria were established according to the PICOS framework (Population, Intervention, Comparison, Outcomes, Study design) to ensure methodological rigor and result validity [14]. Two reviewers independently screened full texts and extracted data; any discrepancies were resolved by consensus with a third reviewer. Specifically: P (Population): patients undergoing thymoma resection. I (Intervention): robot-assisted thymectomy. C (Comparison): video-assisted thymectomy. O (Outcomes): perioperative clinical outcomes, postoperative complications, and costs. S (Study design): randomized trials alongside cohort-based investigations. Using these criteria, we selected high-quality, relevant studies. Extracted information included study characteristics: publication year; surgical category; sample size; patient demographics (age, sex, body mass index (BMI); tumor size; world health organization (WHO)histological classification; surgical approach; MG status). Perioperative outcomes: conversion rate to open surgery; operative time; intraoperative blood loss; drainage volume and duration; R0 resection rate; postoperative length of stay; complication rates (including pulmonary infection); total hospitalization costs; learning-curve metrics; and 30- and 90-day mortality. Studies were excluded if they were duplicates, non-comparative designs (case reports, reviews, conference abstracts, meta-analyses, single-arm studies), not published in English, or lacked sufficient or high-quality data.
Quality assessment, publication bias, and statistical analysis
Study quality was evaluated using the Newcastle-Ottawa Scale (NOS), which assesses selection, comparability, and exposure, with a star-based system (maximum 9 stars); studies with >6 stars were deemed of acceptable quality and those with 8–9 stars high quality. Quantitative data required for the meta-analysis—such as means, standard deviations (SDs), mean differences (MDs), and odds ratios (ORs) were either extracted directly or derived via calculation, MD stands for mean difference, which represents the difference in the means of two groups. When applicable, units are specified (e.g., minutes, milliliters), and for ratios, MD indicates the comparative effect size without units [15]. When only medians and interquartile ranges were reported, they were converted to means and SDs using the Hozo method [16]. Study-specific ORs and their 95% confidence intervals (CIs) were calculated. Heterogeneity was assessed with the I² statistic, with < 25%, 25–50%, and >50% representing low, moderate, and high heterogeneity, respectively. A random-effects model was used if I² >50%; otherwise, a fixed-effect model was applied, with the fixed-effect results also examined in sensitivity analyses [17]. Dichotomous outcomes were summarized as ORs with 95% CI, and continuous outcomes as MDs with 95% CI [18, 19]. Statistical processing was carried out using the Review Manager program (version 5.4; Cochrane Collaboration, Oxford, UK). Funnel plots were visually examined to assess possible publication bias, and subgroup analyses limited to patients treated with the lateral approach—A fully lateral approach refers to a surgical positioning where the patient is placed in a lateral decubitus position, allowing the surgeon to access the thymus via the chest wall without the need for a sternotomy. This differs from other approaches, such as subxiphoid or median sternotomy, which may involve a different orientation of the patient or entry point [20]. Two-sided P values < 0.05 were considered statistically significant.
Results
Study selection and characteristics
A total of 602 articles were identified through database and manual searches. After careful full-text screening (with reasons for exclusions outlined in Fig. 1). A total of 30 retrospective studies, including 17 outcomes and 7,347 patients, were analyzed. Of these, 3,122 patients underwent RATs (experimental group) and 4,225 received VATs (control group). The studies, spanning from 2013 to 2025, have over 77% published in the last five years [4, 21–49]. Table 3 provides a summary of the patients’ baseline characteristics, and detailed outcome data from 30 studies are presented in Table 4. It revealed that the median age ranged from 50 to 60 years, with males accounting for 50.36% and females 49.63%. The median tumor size averaged 4.5 cm, the prevalence of MG was approximately 20%, and 93.77% of cases underwent a lateral surgical approach. The risk of bias for the included studies is shown in Table 2, evaluated using the Newcastle-Ottawa Scale (NOS). Most studies had a low risk of bias, with only a few having methodological limitations. The detailed risk of bias for each study is presented in Table 1, highlighting the potential impact on the findings.Fig. 1. Research options flow chart
Conversion to open surgery
A meta-analysis of 15 studies involving 3,940 patients (RATs: 1,890; VATs: 2,050) revealed a significantly lower conversion rate to open surgery in the RATs group. Specifically, patients undergoing RATs had about a two-thirds lower risk of conversion compared with those receiving VATs (OR 0.34, 95% CI 0.26–0.44; P < 0.05; I² = 0%) (Fig. 2a) [22, 27–32, 34, 35, 37–39, 43, 45, 49].Fig. 2. Forest plots comparing conversion rates, R0 resection rates, overall complications, and pulmonary infection rates between RATs and VATs (panels a-d)
R0 resection
In eight studies including 2,198 patients (RATs: 1,118; VATs: 1,080), the rate of complete (R0) resection was significantly higher in the RATs group. Patients treated with RATs had about a 65% greater chance of achieving R0 resection compared with VATs (OR = 1.65; 95% CI: 1.12–2.42; P = 0.01). Between-study variability was moderate (I² = 53%; P = 0.04), but the overall trend consistently favored RATs (Fig. 2b) [22, 24, 26, 28, 30, 32, 39, 41].
Overall complications
Incorporating data from 9 studies with 1,464 patients (RATs: 520; VATs: 944), overall complications, including arrhythmias, wound infections, phrenic nerve injury, intercostal neuralgia, and pneumothorax, were assessed. The results showed that the likelihood of developing postoperative complications was reduced by nearly half in RATs compared with VATs (OR 0.53, 95% CI 0.31–0.91; P = 0.02; I² = 0%) (Fig. 2c) [23, 28, 34, 36, 37, 43, 45, 47, 49].
Pulmonary infection
We separately analyzed pulmonary infections, as they are a common and clinically significant complication after thymectomy. Pulmonary infections can extend hospitalization, increase costs, and lead to secondary complications, making them more impactful on recovery than other minor complications. This distinction provides a clearer understanding of the perioperative safety profile of RATs versus VATs. Eight studies (RATs: 854; VATs: 1,059) reported postoperative pulmonary infections (Fig. 2d). The incidence was significantly lower in the RATs group, with patients experiencing about a 60% reduction in risk compared with VATs (OR = 0.39; 95% CI: 0.23–0.67; P = 0.0006, I² = 20%) [4, 23, 26, 33, 34, 36, 42, 49].
Surgical duration
A meta-analysis of 22 studies (RATs: 1,619; VATs: 1,850) (Fig. 3a) showed that the average operative time was about 7 min shorter in the RATs group compared with VATs (MD = − 7.13 min; 95% CI: − 13.76 to − 0.51 min; P = 0.03) [4, 22–28, 34, 35, 37, 38, 40–49]. Although statistically significant, this time saving was relatively modest and should be interpreted in light of substantial between-study heterogeneity (I² = 86%), which likely reflects differences in surgical approach, case complexity, and surgeon experience.
Fig. 3. Forest plots comparing surgical duration (panels** a**-b) and intraoperative blood loss (panels c-d) between RATs and VATs, including subgroup analysis of the lateral approach
To further explore heterogeneity, we performed a subgroup analysis restricted to studies that used a full lateral approach. Across seven studies (532 patients; RATs: 282, VATs: 250), the mean operative time was instead longer in the RATs group, by approximately 8 min on average (MD = 7.75 min; 95% CI: 0.43–15.08; P = 0.04, I² = 38%) (Fig. 3b) [27, 35, 37, 38, 40, 46, 47]. For procedures performed through a lateral approach, RATs tended to require more time, possibly reflecting the technical demands of precise dissection and the influence of the surgeon’s learning curve.
Intraoperative blood loss
A meta-analysis of 19 studies (3,139 patients) showed that intraoperative blood loss was lower with RATs than with VATs (MD = − 6.50 mL; 95% CI − 10.35 to − 2.73; P = 0.0008; I² = 83%) (Fig. 3c) [4, 23, 24, 26–28, 33–38, 40–43, 47–49]. Given the high heterogeneity, a random-effects model was used. Despite this variation, results consistently favored RATs, indicating a modest yet significant reduction in bleeding. Variations in hemostatic devices (e.g., ultrasonic scalpel, bipolar cautery) and surgical techniques likely contributed to the heterogeneity.
In the subgroup of five studies using the full lateral approach (RATs = 198; VATs = 140), blood loss remained lower with RATs (MD = − 5.46 mL; 95% CI − 10.13 to − 0.78; P = 0.02; I² = 39%) (Fig. 3d) [27, 35, 38, 47, 49]. Although the difference was smaller than in the overall analysis, the consistent trend supports a reliable advantage of RATs in reducing intraoperative bleeding.
Chest tube duration
A pooled analysis of 20 studies (Fig. 4a) showed that the time to postoperative chest tube removal was on average 0.61 days shorter in the RATs group than in the VATs group (MD = − 0.61 days; 95% CI: − 0.90 to − 0.33 days; P < 0.05), though heterogeneity was high (I² = 95%) [4, 21, 23, 24, 26–29, 33–35, 37, 38, 41, 43, 45–49]. In the full lateral approach subgroup (7 studies; 331 patients in the RATs group and 279 in the VATs group) (Fig. 4b) showed similar significant reductions, chest tubes were removed 0.80 days earlier with robot assistance (MD = − 0.80 days; moderate between-study variability, I² = 66%; 95% confidence interval: − 1.13 to − 0.47 days; P < 0.05) [23, 29, 35, 38, 46, 47, 49].
Fig. 4. Forest plots comparing chest tube duration (panels a-b) and postoperative length of stay (panels c-d) between RATs and VATs, including subgroup analysis of the lateral approach Figure 5: Forest plots comparing total drainage volume (panel a) and the learning curve of the RATs group (panel b)
Postoperative length of stay
Meta-analysis of 28 studies (RATs: 2,936;VATs: 3,857) showed that postoperative length of stay was significantly shorter in the robotic group compared to the video-assisted group (MD = − 0.77 days; 95% CI: − 1.08 to − 0.46 days; P < 0.00001), despite very high heterogeneity (I² = 93%)(Fig. 4c) [4, 21–31, 33–49]. In the full lateral approach subgroup (7 studies; RATs:332; VATs:279), the robotic cohort had a significantly reduced hospital stay (MD = − 0.91 days; 95% CI: − 1.18 to − 0.64 days; P < 0.05) (Fig. 4d). Heterogeneity was moderate (I² = 42%; P = 0.11), and the constant-effects approach validated the stability of this result, indicating a clear advantage of robotic thymectomy in shortening postoperative hospitalization for lateral approaches [23, 29, 35, 38, 46, 47, 49].
Total drainage volume
Analysis of 10 studies (RATs: 1,185; VATs: 2,045) (Fig. 5a) showed that the total postoperative drainage volume was significantly lower in the RATs group compared to the VATs group (MD = − 31.62 mL; 95% CI: − 57.97 to − 5.27 mL; P = 0.02). However, marked differences were observed between the studies (I² = 97%) [4, 21, 23, 26, 29, 33, 38, 41, 42, 45], which may be attributed to factors such as differences in patient disease severity, resection extent, lymph node dissection, and drainage management, all of which could influence the total drainage volume. Despite these differences, the potential advantage of the RATs group in reducing total drainage volume remains noteworthy.Fig. 5. Forest plots comparing total drainage volume (panel a) and the learning curve of the RATs group (panel b)
Learning curve of the RATs
The learning curve for RATs was analyzed across 3 studies, including 153 patients [29, 35, 50]. The experimental group consisted of 90 cases at different stages of robotic surgery, while the control group included 63 corresponding reference cases. The analysis revealed that as surgical volume increased (from ≤ 20 cases in the early phase to >20 cases in the later phase), the operative time in the RATs group significantly decreased compared to the VATs group (MD = − 33.19 min; 95% CI: − 48.29 to − 18.09 min; P < 0.05). Moderate heterogeneity was observed between studies (I² = 39%; P = 0.19), and the constant-effects model confirmed the stability of the results (Fig. 5b). Although the control group contained 15 cases with a smaller sample size, their contribution was statistically balanced (e.g., Kamel 2017 accounted for 64.7%). Despite the smaller sample, the overall analysis still showed significant statistical differences, suggesting that the reduction in operative time with increased case experience reflects a reliable learning curve for RATs. These results reinforce the notion that RATs efficiency improves with surgeon experience, offering valuable insights for understanding the stages of proficiency in clinical practice.
30- and 90-day mortality
Figure 6a indicates that 30-day postoperative mortality occurred less often in RATs compared with VATs (OR = 0.37; 95% CI, 0.12–1.08; P = 0.07), showing little variability (I² = 0%; P = 0.89; constant-effects model), although the difference failed to reach a significant level in statistical testing [30, 32, 36, 39]. Analysis of 90-day mortality across three studies (RATs: 930;VATs: 823; Fig. 6b) revealed no significant difference (OR = 0.62; P = 0.57; CI:0.12–3.23), with moderate heterogeneity (I² = 57%; P = 0.10; random-effects model) [30, 31, 39]. Overall, these findings indicate comparable safety profiles for RATs and VATs at both 30 and 90 days postoperatively.
Fig. 6. Forest plots comparing 30-day and 90-day mortality (panels a-b) and total hospitalization costs (panel c)
Total Hospitalization Costs.
As illustrated in Fig. 6c, pooled data from eight studies involving 1,157 patients (RATs: 544; VATs: 613) indicated that overall hospitalization expenses were markedly greater for RATs (MD = 0.45, representing the mean difference in cost, 95% CI: 0.35–0.55; P < 0.05). Substantial heterogeneity was observed (I² = 98%), so a random-effects model was applied. Individual study differences were notable (MD: 0.20–1.56), with Cheng 2024 reporting the largest excess cost (MD = 1.56) and Qing 2024 the smallest (MD = 0.20), indicating considerable variability in effect size across settings [25–27, 29, 36, 37, 41, 42]. Despite these variations, the overall trend of higher costs in the robot-assisted group remains consistent. The pronounced heterogeneity suggests that contextual factors—such as regional pricing structures, choice of consumables, length of stay, and patient comorbidities—likely modulate the magnitude of cost differences and should be accounted for when interpreting these findings and balancing cost versus clinical benefit in practice.
Table 1. Main characteristics of the included studiesStudy ID (Author, Year)InterventionsSample size (n)Gender (M\F)(n)Age(Year)Mean ± SDMedian tumor sizeMean ± SD(cm)Who histological classification *(n)*A, AB, B1, B2, B3, OtherBMI(kg/m2)Mean ± SDApproach(Right/Left)nMyastheniaGravis n(%)Yeke 2025RAT107612267\5555.75 + 10.593.14 + 1.88NANANA6(4.92)VAT954431\52352.78 + 13.853.06 + 1.5411(1.15)Akshay 2024RAT894366161\20561 ± 124.9 ± 3.1481766049161726.22 ± 5.30NA7 (2)VAT528295\23360 ± 135.1 ± 2.8922297571421927.36 ± 5.429 (2)Bin 2023RAT976163\3446.10 ± 14.108.45 ± 1.45131513128023.01 ± 2.9234/205 (8.20)VAT3647.60 ± 14.607.54 ± 0.96310594522.98 ± 3.3518/22 (5.56)Cheng 2024RAT1608064\9650.44 ± 13.404.10 ± 2.66NA25.14 ± 3.8751/29NAVAT8050.39 ± 12.433.71 ± 2.1825.30 ± 3.3251/29Yoshiki 2022RAT57207\1355.00 ± 27.003.73 ± 2.8227551024.45 ± 6.7516/44 (20.0)VAT3716\2161.00 ± 26.003.95 ± 3.054121074024.31 ± 8.3328/911 (29.7)Hai 2021RAT588325243\34563.00 ± 34.004.52 ± 0.86488545634044NANANAVAT26364.00 ± 34.005.12 ± 1.22416441582732Ali 2021RAT523932\758 ± 20.54.82 ± 1.42NANANANAVAT139\468 ± 13.04.85 ± 0.85Abidin 2020RAT452110\1141.29 ± 7.053.22 ± 0.46936210NA19/24(19.4)VAT248\1642.52 ± 7.452.73 ± 0.5784561024/05(20.8)Xiaokun 2020RAT2956030\3053.72 ± 13.115.50 ± 2.3846122495NANA4(6)VAT235114\12152.23 ± 12.566.05 ± 3.752520498943913(5.5)Bartlomiej 2021RAT1515429\2544.9 ± 15.8NA9261541830.5 ± 8.3NANAVAT9742\5547.4 ± 15.28211912201732.4 ± 7.9Mohamed 2019RAT580300151\14963.00 ± 9.004.72 ± 1.63NANANANAVAT280149\13162.00 ± 8.505.65 ± 2.15Liqiang 2017RAT865121\3048.8 ± 13.33.8 ± 1.11014121122NAFull lateralapproach4 (7.8)VAT3519\1650.3 ± 13.13.9 ± 1.141575311 (2.9) Kamel 2017RAT777023\47NA4.72 ± 1.23NANAFull lateralapproach19(27.1)VAT75\24.29 ± 1.441(14.2)Takashi 2016RAT8072NA53.4 ± 14.83.2 ± 1.711219158822.8 ± 3.7NA13 (18.1)VAT855.5 ± 9.94.1 ± 2.121230023.8 ± 5.12 (25.0)Phillip 2015RAT56116\552.20 ± 25.50NANA29.02 ± 8.85Full lateralapproach2(18.1)VAT4519\2650.60 ± 32.0033.82 ± 13.9712(26.1)BO 2013RAT46219\1252.7 ± 7.82.91 ± 0.77NANAFull lateralapproachNAVAT2513\1253.4 ± 5.43.04 ± 0.79Yi 2014RAT1155525\3041.38 ± 9.5NANANAFull lateralapproachNAVAT6028\3243.53 ± 8.8Haoran 2024RAT1906128\3158.00 ± 6.5013.21 ± 3.5242271331223.92 ± 2.14NA5(8.2)VAT12966\6356.00 ± 7.009.23 ± 3.771051191862524.46 ± 1.929(7.0)Beatrice 2025RAT804014\2662.26 ± 8.576.14 ± 1.8651355120NANA8 (20)VAT4015\2561.28 ± 9.84.71 ± 0.4881478307 (17.5) Qian 2024RAT1725734\2348 ± 134.22 ± 1.18NA24.83 ± 3.47NANAVAT11567\4843 ± 143.47 ± 0.9825.33 ± 2.97Hao 2024RAT1799247\4550.4 ± 13.54.4 ± 1.9NANANANAVAT8739\4851.5 ± 14.24.5 ± 2.2Qing 2024RAT22611351\6250.91 ± 5.243.27 ± 0.62NA24.31 ± 1.53NANAVAT11359\5450.41 ± 2.673.24 ± 0.6024.15 ± 1.46 Zheng 2024RAT853316\1753.91 ± 13.328.74 ± 2.393717411NANA3 (9.09)VAT5221\3151.73 ± 13.237.93 ± 1.97610678155 (9.62) Chao 2024RAT31212061\5951.62 ± 13.705.44 ± 2.87NA24.18 ± 4.13NA10 (8.3)VAT19270\12253.36 ± 13.804.36 ± 2.6524.37 ± 3.4817 (8.9) Li 2022RAT212106122\9045.38 ± 11.634.91 ± 1.44NA24.90 ± 2.15NANAVAT10647.88 ± 8.135.23 ± 1.7824.77 ± 2.45Takahiro 2023RAT1904628\1853.00 ± 25.00NANANA24/14NAVAT14484\6446.50 ± 36.5056/51Zi 2023RAT703414\2041.03 ± 7.383.70 ± 1.16NA23.41 ± 4.12Full lateralapproachNAVAT3617\1943.06 ± 6.824.07 ± 1.2023.28 ± 3.75Christine 2022RAT856454223\23162.50 ± 7.504.85 ± 1.65NANANANAVAT402196\20661.00 ± 10.005.65 ± 2.15Liping 2021RAT935227\2549.00 ± 27.004.75 ± 3.95NANAFull lateralapproach4 (7.7)VAT4118\2348.50 ± 22.504.00 ± 3.200 (0.0)Chi-Fu 2020RAT317176117\5959 ± 12.364.9 ± 1.4204327391433NANANAVAT14166\7562 ± 9.565.7 ± 2.1143524262121
Table 2. Results from Thirty studiesStudy ID (Author, Year)InterventionsConversion to thoracotomy, n(%)Operative time (min)R0 resection n(%)intraoperative blood loss Mean ± SD(mL)Chest tube placement time Mean ± SD(Days)Total drainage volume (mL)Postoperative stay Mean ± SD(Days)Total complications n(%)Arrhythmia n(%)Total in-hospital costs Mean ± SD($)Pulmonary infection n(%)30 days mortality n(%)90 days mortality n(%)Yeke2025RATNANANANA2.59 ± 0.36208.87 ± 84.483 ± 1.52NANANANANANAVAT3.6 ± 0.49260.56 ± 105.263.75 ± 1.48Akshay2024RATNA108.78 ± 46.29NA63.75 ± 6.353.4 ± 1.2245.69 ± 30.564.26 ± 1.3NANANA2(0.5)NANAVAT126.55 ± 58.4171.68 ± 20.884.8 ± 2.01295.84 ± 58.465.17 ± 1.920(3.8)Bin2023RATNA118.75 ± 26.2558 (95.08)62.50 ± 37.503.85 ± 1.51350.78 ± 89.364.75 ± 1.75NANA10,483.63 ± 3,317.862(3.28)NANAVAT128.125 ± 41.8734 (94.44)108.75 ± 78.752.76 ± 1.35286.31 ± 92.035.5 ± 1.55434.00 ± 2,652.801(2.78)Cheng2024RAT1 (1.3)NANANA2.83 ± 1.08268.00 ± 104.274.25 ± 1.42NANA29,596.96 ± 12,260.85NA0(0)NAVAT03.04 ± 1.42265.38 ± 120.304.91 ± 1.9414,097.24 ± 7,054.000(0)Yoshiki2022RATNA188.95 ± 145.2NA52.50 ± 47.501.41 ± 0.79NA6.33 ± 2.324 (20.0)0(0)NANANANAVAT226.5 ± 158.568.21 ± 30.252.97 ± 1.857.16 ± 2.108 (21.6)1 (2.7)Hai2021RAT17 (5.0)NA12(71.4)NANANANANANANANA2 (0.6)NAVAT41 (13.4)25(61.3)3 (1.1)Ali2021RATNA94.94 ± 38.8635 (89.7)85.46 ± 23.232.5 ± 1.5NA3.91 ± 1.47NANANANANANAVAT80.36 ± 65.6113 (100.0)68.72 ± 18.261.50 ± 0.53.67 ± 2.28Abidin2020RATNA75.70 ± 38.08NA68.4 ± 18.63.10 ± 2.2210.34 ± 20.224.16 ± 1.152(14.2)NANA1(4.76)0(0)NAVAT106.52 ± 26.6892.6 ± 30.15.10 ± 3.21325.45 ± 25.385.76 ± 1.273(12.5)0(0)0(0)Xiaokun2020RAT1(1.66)102.10 ± 14.12NANA2.23 ± 0.50209.50 ± 52.384.48 ± 2.372(3.33)NANANANANAVAT8(3.40)107.83 ± 15.612.34 ± 0.64217.04 ± 54.214.64 ± 2.6710(4.26)Bartlomiej2021RATNA187.5 ± 78.3NANANANA1.3 ± 0.82NA0(0)14,075 ± 4,439NANANAVAT161.1 ± 82.52.4 ± 2.175 (5)10,743 ± 3,113Mohamed2019RAT17 (6)NA236 (77)NANANA3.23 ± 1.12NANANANA2 (1)2 (1)VAT37 (13)204 (70)2.73 ± 0.893 (1.5)4 (2)Liqiang2017RATNA71.2 ± 39.8NA77.5 ± 69.52.9 ± 0.8352.2 ± 193.44.3 (1.1)NANANANANANAVAT79.1 ± 41.0127.1 ± 115.23.8 ± 1.1343.9 ± 206.95.5 (1.2)Kamel2017RAT5(7)101 ± 24NA32.05 ± 22.701.18 ± 0.73NA2.68 ± 1.27NANANANANANAVAT0(0)85.50 ± 26.5037.74 ± 16.961.95 ± 0.642.88 ± 1.15Takashi2016RATNA145.77 ± 42.36NANANANA4.3 ± 3.6NA1(1.39)NANANANAVAT135.34 ± 48.514.0 ± 2.00(0)Phillip2015RAT0178.07 ± 53.78NA160.46 ± 75.23NANANANA2(18.1)NANANANAVAT0156.23 ± 45.2565.11 ± 41.860(0)BO2013RAT096.2 ± 39.8NA58.6 ± 20.61.13 ± 1NA3.7 ± 1.1NANA8,662 ± 2,375NANANAVAT1(4)103.6 ± 3686.8 ± 97.13.6 ± 1.26.7 ± 1.46,097 ± 1,342Yi2014RATNA139.80 ± 45.32NANA3.24 ± 1.57NA6.98 ± 3.25NANANANANANAVAT121.07 ± 20.563.67 ± 1.157.12 ± 2.23Haoran2024RAT2(3.3)114 ± 29NA33.85 ± 14.271.85 ± 1.13NA2.32 ± 1.270(0)0NA0(0)NANAVAT3(2.3)102 ± 2337.84 ± 13.252.5 ± 1.492.58 ± 1.364(3.1)3 (2.3)1(0.77)Beatrice2025RAT0 (0)70.60 ± 8.1339 (97.5)NANANA3.36 ± 1.73NANANANANANAVAT6 (15)90 ± 11.5539 (97.5)3.64 ± 1.38Qian2024RAT0(0)118.30 ± 30.5657(100)39.06 ± 10.571.38 ± 0.86275.32 ± 175.033.55 ± 1.45NANA9,583.78 ± 1,704.49NANANAVAT4 (3.5)106.25 ± 24.56113(98.3)45.23 ± 9.583.07 ± 1.51320.54 ± 184.234.81 ± 1.883,888.57 ± 1,208.42Hao2024RATNANANA75.9 ± 39.61.99 ± 0.9125.2 ± 34.52.3 ± 1.0NANANA5(5.4)NANAVAT97.4 ± 35.82.16 ± 0.75128.8 ± 40.23.4 ± 1.47(8.0)Qing2024RATNA84.91 ± 19.41NA45.97 ± 12.46NA203.36 ± 42.544.31 ± 1.43NA2(1.8)7,302.17 ± 430.474(3.5)NANAVAT89.74 ± 18.8155.09 ± 12.99282.74 ± 33.446.12 ± 1.173(2.7)5,297.98 ± 821.256(5.3)Zheng2024RATNA133.79 ± 56.06NA27.12 ± 24.913.24 ± 1.33NA4.12 ± 1.47NANANANANANAVAT150.56 ± 36.3156.73 ± 36.944.06 ± 1.674.94 ± 1.97Chao2024RAT1 (0.8)220.39 ± 66.7197 (94.2)52.75 ± 18.391.99 ± 0.99NA3.07 ± 1.740NANANANANAVAT1 (0.5)138.09 ± 72.9998 (98)60.36 ± 27.982.46 ± 1.893.81 ± 4.932 (1)Li2022RAT0(0)NANA57.50 ± 12.50NANA3.36 ± 1.386 (5.7)1 (0.9)7,122.22 ± 403.563 (2.8)0NAVAT0(0)62.35 ± 11.174.78 ± 1.5415 (14.2)2 (1.9)4,688.54 ± 601.7110 (9.4)1 (0.9)Takahiro2023RAT0(0)130.56 ± 99.78NA53.87 ± 23.541.36 ± 0.75NA4.12 ± 1.261 (2.2)NANANANANAVAT1 (0.7)225.45 ± 221.8645.27 ± 10.641.53 ± 0.874.23 ± 1.088 (5.6)Zi2023RAT075.32 ± 17.80NA15.57 ± 10.532.23 ± 0.86NA4.25 ± 2.252 (5.9)NANA1 (2.9)NANAVAT1 (2.8)102.22 ± 19.8019.42 ± 11.583.12 ± 0.555.15 ± 2.273 (8.3)0(0)Christine2022RAT22 (4.9)NANANANANA3.12 ± 1.34NANANANANA7 (2.3)VAT59 (14.7)3.15 ± 1.533 (1.0)Liping2021RAT0(0)78.08 ± 32.58NA23.75 ± 18.202.21 ± 1.11NA3.61 ± 1.193(5.9)1 (1.9)9,099.81 ± 2,168.02NANANAVAT2 (5.0)69.18 ± 32.9118.08 ± 16.731.78 ± 1.223.26 ± 0.953(7.4)03,503.03 ± 844.66Chi-Fu2020RAT8(4.55)NA131 (74.4)NANANA2.23 ± 1.07NANANANA0(0)0(0)VAT26 (18.4)98 (69.5)3.24 ± 1.252(1.1)4(2.8)
Table 3. Risk of bias assessmentStudy IDSelectionComparabilityOutcomeTotalYeke 2025✩✩✩✩✩✩✩✩✩✩✩✩✩✩✩✩Akshay 2024✩✩✩✩✩✩✩✩✩✩✩✩✩✩✩✩Bin 2023✩✩✩✩✩✩✩✩✩✩✩✩✩✩✩✩Cheng 2024✩✩✩✩✩✩✩✩✩✩✩✩✩✩✩✩Yoshiki 2022✩✩✩✩✩✩✩✩✩✩✩✩✩✩✩✩Hai 2021✩✩✩✩✩✩✩✩✩✩✩✩✩✩Ali 2021✩✩✩✩✩✩✩✩✩✩✩✩✩✩✩✩Abidin 2020✩✩✩✩✩✩✩✩✩✩✩✩✩✩✩✩Xiaokun 2020✩✩✩✩✩✩✩✩✩✩✩✩✩✩Bartlomiej 2021✩✩✩✩✩✩✩✩✩✩✩✩✩✩✩✩Mohamed 2019✩✩✩✩✩✩✩✩✩✩✩✩✩✩✩✩Liqiang 2017✩✩✩✩✩✩✩✩✩✩✩✩✩✩✩✩ Kamel 2017✩✩✩✩✩✩✩✩✩✩✩✩✩✩✩✩Takashi 2016✩✩✩✩✩✩✩✩✩✩✩✩✩✩Phillip 2015✩✩✩✩✩✩✩✩✩✩✩✩✩✩✩✩BO 2013✩✩✩✩✩✩✩✩✩✩✩✩✩✩✩✩Yi 2014✩✩✩✩✩✩✩✩✩✩✩✩✩✩✩✩Haoran 2024✩✩✩✩✩✩✩✩✩✩✩✩✩✩✩✩Beatrice 2025✩✩✩✩✩✩✩✩✩✩✩✩✩✩✩✩ Qian 2024✩✩✩✩✩✩✩✩✩✩✩✩✩✩✩✩Hao 2024✩✩✩✩✩✩✩✩✩✩✩✩✩✩Qing 2024✩✩✩✩✩✩✩✩✩✩✩✩✩✩✩✩ Zheng 2024✩✩✩✩✩✩✩✩✩✩✩✩✩✩✩✩ Chao 2024✩✩✩✩✩✩✩✩✩✩✩✩✩✩✩✩ Li 2022✩✩✩✩✩✩✩✩✩✩✩✩✩✩✩✩Takahiro 2023✩✩✩✩✩✩✩✩✩✩✩✩✩✩✩✩Zi 2023✩✩✩✩✩✩✩✩✩✩✩✩✩✩✩✩Christine 2022✩✩✩✩✩✩✩✩✩✩✩✩✩✩Liping 2021✩✩✩✩✩✩✩✩✩✩✩✩✩✩Chi-Fu 2020✩✩✩✩✩✩✩✩✩✩✩✩✩✩✩✩
Table 4. Evaluation of the risk of bias in the studies included in the analysis through the use of the ROBINS-I toolStudy IDBias due to confoundingBias in selection of participantsBias in classification of interventionsBias due todeviations from intended interventionsBias due to missing dataBias in measurement of outcomesBias in selection of the reported resultOverall risk of biasYeke 2025ModerateModerateLowLowLowLowModerateModerateAkshay 2024ModerateLowLowLowLowLowModerateModerateBin 2023ModerateLowLowLowLowLowModerateModerateCheng 2024ModerateLowLowLowLowModerateLowModerateYoshiki 2022ModerateLowLowLowLowLowModerateModerateHai 2021ModerateLowLowLowLowModerateModerateModerateAli 2021ModerateModerateLowLowLowLowModerateModerateAbidin 2020ModerateLowLowLowLowLowModerateModerateXiaokun 2020ModerateLowLowLowLowModerateLowModerateBartlomiej 2021ModerateLowLowLowLowLowModerateModerateMohamed 2019ModerateLowLowLowLowModerateModerateModerateLiqiang 2017ModerateModerateLowLowLowLowModerateModerate Kamel 2017ModerateLowLowLowLowLowModerateModerateTakashi 2016ModerateLowLowLowLowModerateLowModeratePhillip 2015ModerateLowLowLowLowLowModerateModerateBO 2013ModerateLowLowLowLowModerateModerateModerateYi 2014ModerateModerateLowLowLowLowModerateModerateHaoran 2024ModerateLowLowLowLowModerateLowModerateBeatrice 2025ModerateLowLowLowLowLowModerateModerate Qian 2024ModerateLowLowLowLowModerateLowModerateHao 2024ModerateLowLowLowLowLowModerateModerateQing 2024ModerateLowLowLowLowModerateLowModerate Zheng 2024ModerateLowLowLowLowModerateModerateModerate Chao 2024ModerateModerateLowLowLowLowModerateModerate Li 2022ModerateLowLowLowLowModerateLowModerateTakahiro 2023ModerateLowLowLowLowLowModerateModerateZi 2023ModerateLowLowLowLowModerateModerateModerateChristine 2022ModerateModerateLowLowLowLowModerateModerateLiping 2021ModerateModerateLowLowLowLowModerateModerateChi-Fu 2020ModerateLowLowLowLowModerateLowModerate
Discussion
This systematic review and meta-analysis included a comprehensive evidence base (30 articles, 7,347 patients), providing stronger evidence compared to earlier reviews that were limited by smaller sample sizes and focused on selective perioperative outcomes. Our study expanded the scope by including key endpoints such as R0 resection rates, hospitalization costs, and the learning curve for RATs [51–53]. This study followed PRISMA guidelines, was prospectively registered in PROSPERO, and incorporated bias and sensitivity analyses to enhance result reliability. These methods support a balanced evaluation of robotic surgery and may inform future clinical research.
Our findings highlight the clear advantages of RATs over VATs in key clinical outcomes. Specifically, RATs reduced the risk of conversion to open surgery by 66% (OR = 0.34; P < 0.05), increased R0 resection rates by 65% (OR = 1.65; P = 0.01), decreased overall complications by 47% (OR = 0.53; P = 0.02), and reduced postoperative pulmonary infections by 61% (OR = 0.39; P = 0.0006). These improvements are attributed to the enhanced three-dimensional visualization, tremor filtration, and increased instrument flexibility provided by the robotic platform, which together improve precision and safety during thymoma resection. The differences in blood loss (MD = − 6.5 mL) and drainage volume (MD = − 31.6 mL) were small and may have limited clinical relevance, though they might contribute modestly to postoperative recovery and potentially lower the risk of postoperative complications. Given the challenges of measuring these small changes, we suggest that their clinical impact should be considered in the broader context of recovery and patient outcomes. Furthermore, RATs was associated with shorter chest tube duration and postoperative length of stay, particularly for full lateral-approach procedures [8], although these differences may seem small, they are clinically relevant as they can lead to reduced in-hospital stay and overall healthcare costs, particularly in the context of rapid recovery and minimizing hospital resource utilization. These findings highlight the broader potential benefits of RATs, despite the seemingly modest magnitude of differences.
A focused analysis of the RATs learning curve showed a significant reduction in operative time by 33 min once surgeons surpassed 20 cases (MD = − 33.19 min; P < 0.05). This finding aligns with previous reports that proficiency is achieved after approximately 25 robotic thymectomy procedures, emphasizing the importance of structured training programs to facilitate the safe adoption of RATs. Moreover, RATs demonstrates clear advantages in larger thymomas (≥ 5 cm), where precise dissection and 3D visualization are crucial for safe resection, particularly when tumors are closely adhered to critical structures [54, 55]. Although RATs incurred higher hospitalization costs, the high heterogeneity suggests that regional pricing and healthcare factors strongly influence these outcomes. Standardized cost-effectiveness analyses are required to clarify economic implications.
Another important consideration is the evolution of robotic platforms. While the Da Vinci system is commonly used for thymectomy with both multi-portal and single-port approaches, newer platforms may offer greater flexibility, enhanced visualization, and reduced invasiveness, potentially improving outcomes, particularly for complex or large tumors. Additionally, combining RATs with neoadjuvant therapy, especially for larger or advanced tumors, may improve outcomes by reducing tumor size and enhancing respectability [56], leading to higher R0 resection rates and lower recurrence risks. Future studies comparing the Da Vinci system with newer robotic platforms, as well as exploring RATs in conjunction with neoadjuvant therapy, are crucial for fully assessing the potential of robotic surgery in thymoma resection.
Limitations and future directions
Despite adherence to PRISMA and PICOS frameworks, several limitations should be acknowledged. Mortality analyses were underpowered because of few events. Second, high heterogeneity in hospitalization costs and drainage outcomes underscores the need for standardized reporting of economic and perioperative data. Third, most of the included studies were non-randomized, and residual confounding related to surgeon experience, institutional protocols, and patient selection cannot be excluded. Given regional differences in healthcare systems and insurance policies, country-specific analyses may be more informative than global pooling. The learning curve for RATs should also be interpreted cautiously, particularly for large (≥ 5 cm) or complex tumors, where size and stage can influence surgical proficiency. In addition, variation in surgical approaches—often not clearly distinguished as unilateral or bilateral—limits the feasibility of further stratified analysis. Finally, few studies reported long-term outcomes, and inconsistent statistical methods prevented reliable synthesis of 3- and 5-year survival data.
Conclusion
This meta-analysis compared perioperative outcomes between RATs and VATs for thymoma. RATs was associated with fewer complications, shorter recovery, and higher R0 resection rates in the included studies. Although it involves a steeper learning curve and higher costs, its potential benefits warrant further confirmation through prospective randomized trials. Additionally, its potential to reduce postoperative resource utilization and improve patient outcomes supports the continued application of RATs. Future high-quality randomized trials are needed to optimize patient selection, refine economic models, and set standardized training benchmarks for broader clinical adoption.
Supplementary Information
Supplementary Material 1
Supplementary Material 2
The reference list from the paper itself. Each links out to its DOI / PubMed record.
- 1Cleophas TJ, Zwinderman AH. Meta-analysis and Random Effect Analysis, in Modern Meta-Analysis: Review and Update of Methodologies, T.J. Cleophas and A.H. Zwinderman, Editors, Springer International Publishing: Cham. 2017; 51–62.