Multi-hit TP53 confers the poorest survival in multiple myeloma in the era of novel therapies
Romana Nesnadna, Anna Petrackova, Jiri Minarik, Vojtech Latal, Jirina Manakova, Tomas Papajik, Eva Kriegova

TL;DR
This study finds that multiple TP53 gene abnormalities in multiple myeloma patients lead to the worst survival outcomes, even with modern treatments.
Contribution
The study identifies multi-hit TP53 as the most detrimental high-risk genetic abnormality in multiple myeloma patients treated with novel therapies.
Findings
Patients with multi-hit TP53 had the shortest progression-free and overall survival compared to other high-risk abnormalities.
The relative risk of early progression was nearly three times higher for multi-hit TP53 patients.
TP53 alterations, especially multi-hit TP53, were more prevalent in later disease stages and associated with distinct blood markers.
Abstract
Multiple myeloma (MM) with high-risk (HR) genetic abnormalities has poor prognosis, despite the use of novel therapeutic agents. However, the individual contribution of specific HR genetic abnormalities or their co-occurrence to poor outcomes, especially in the era of novel agents, remains unclear. This study evaluated the impact of multi-hit TP53 (del(17p) and TP53 mutation or ≥ 2 TP53 mutations) compared with other HR abnormalities on progression-free survival (PFS), overall survival (OS) and blood signature in a real-world cohort of 204 patients with MM treated with novel agents (median follow-up 28 months). Patients with multi-hit TP53 (10.4%) had the shortest PFS and OS compared with those with single HR abnormalities (p ≤ 0.011) or with co-occurrence of ≥ 2 other HR abnormalities (p ≤ 0.002), regardless of therapy line. The relative risk of early progression in patients with…
Genes, proteins, chemicals, diseases, species, mutations and cell lines named across the full text — each resolved to its canonical identifier and authoritative record.
Click any figure to enlarge with its caption.
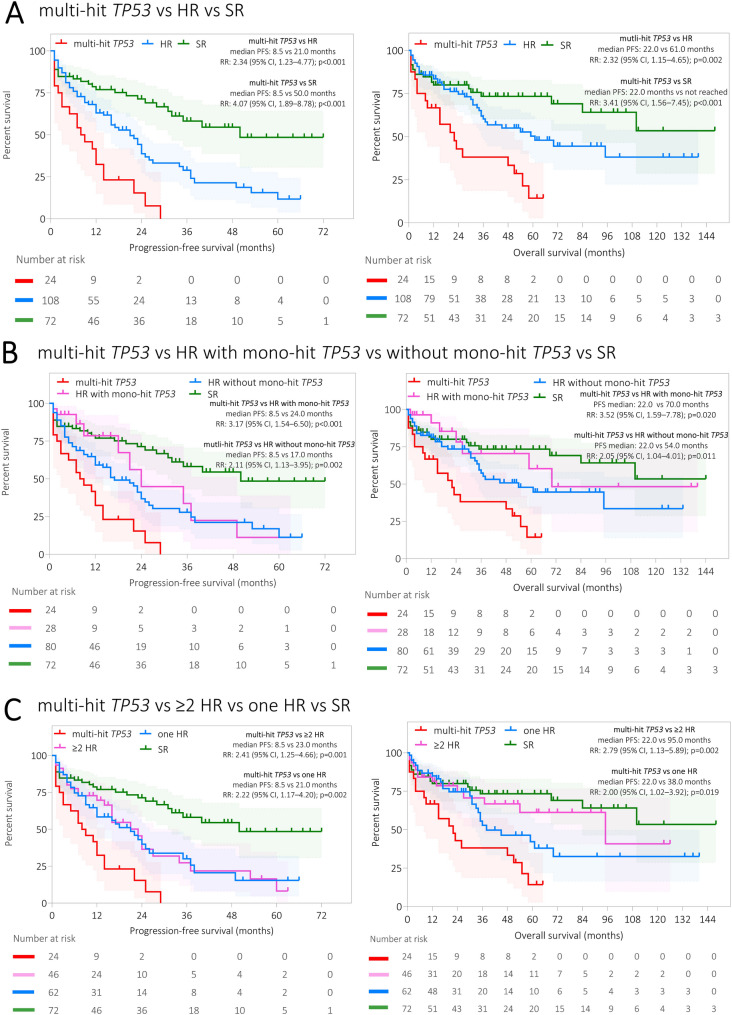 Figure 1
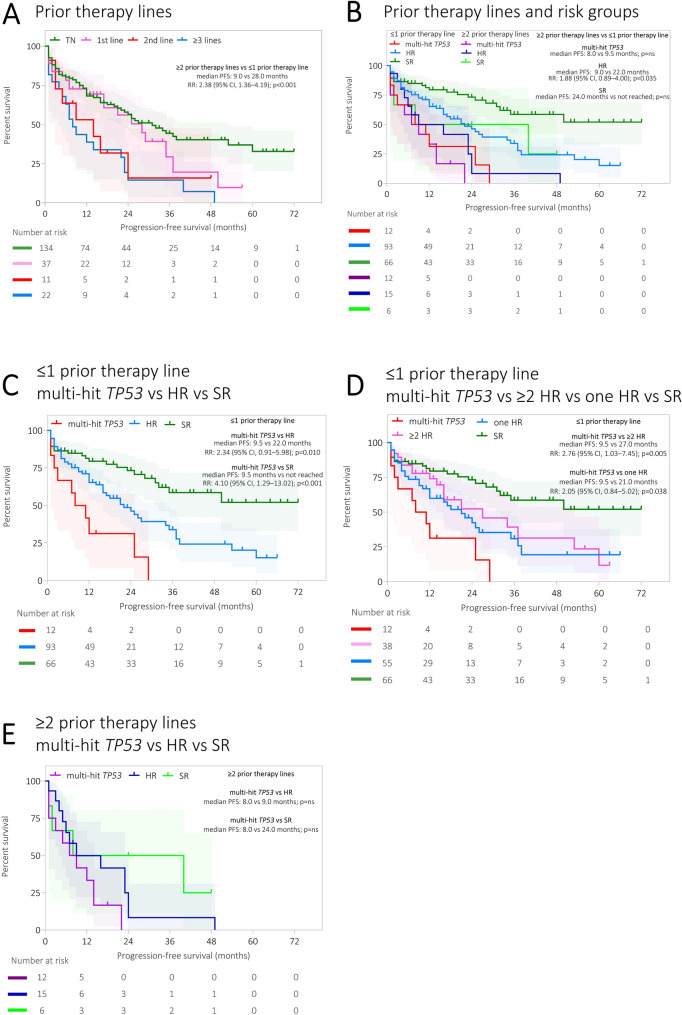 Figure 2
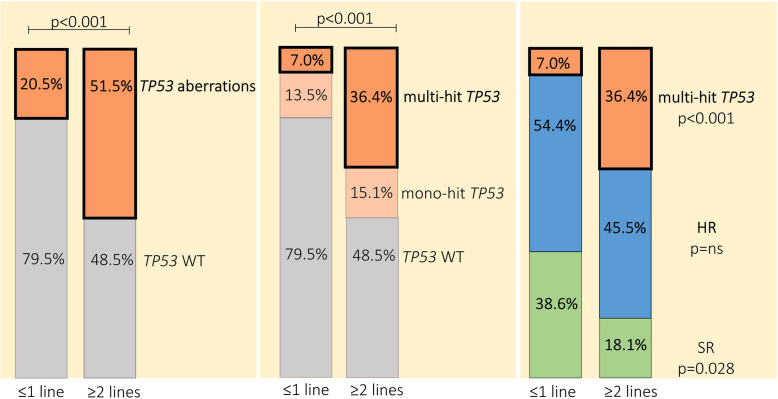 Figure 3
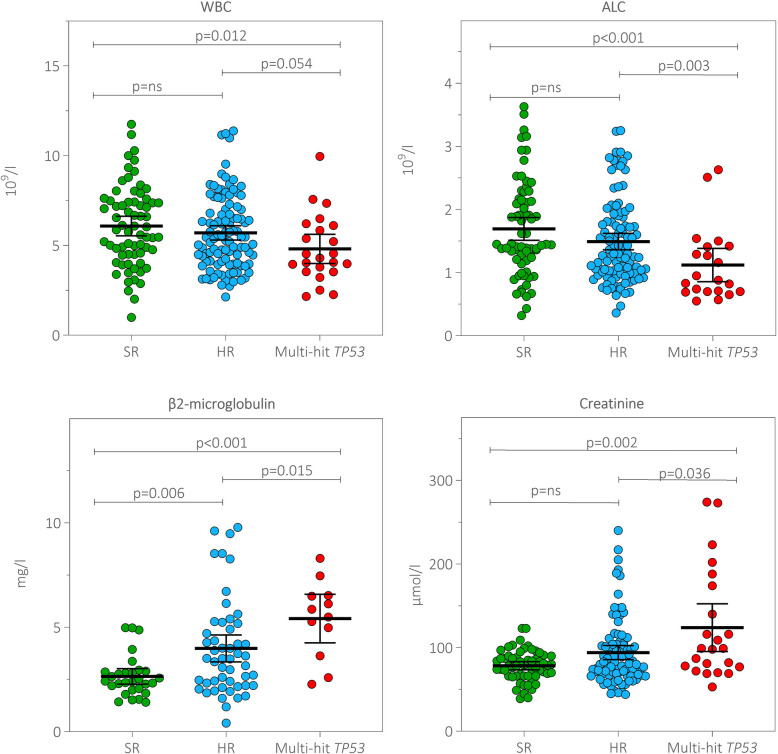 Figure 4
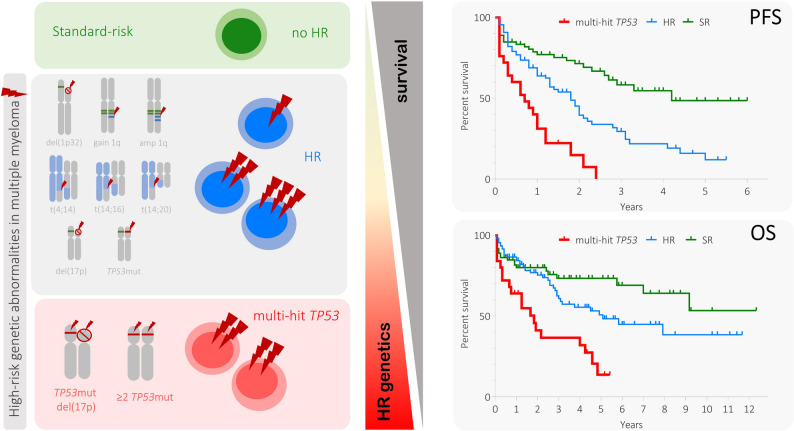 Figure 5
- —https://doi.org/10.13039/501100007059Univerzita Palackého v Olomouci
- —https://doi.org/10.13039/501100003243Ministerstvo Zdravotnictví Ceské Republiky
Peer Reviews
No public reviews on file for this paper yet. If you reviewed it on a platform where reviews are public (OpenReview, ICLR, NeurIPS, ICML), you can paste yours below so the community can read it here.
Videos
No videos yet. Explain this paper in a talk, walkthrough, or lecture? Add one.
Taxonomy
TopicsMultiple Myeloma Research and Treatments · Cancer Treatment and Pharmacology · Cancer, Stress, Anesthesia, and Immune Response
Introduction
Multiple myeloma (MM) is the second most frequent haematological malignancy in adults in Western countries (Donk et al. 2021). The prognosis of patients with MM has improved substantially because of the novel drug agents approved in the last 20 years. Nevertheless, patients with high-risk (HR) disease continue to have poor survival and represent an unmet clinical need (Corre et al. 2021).
Recent studies have defined HR disease as the presence of any of the following genetic abnormalities: t(4;14), t(14;16), t(14;20), del(1p), del(17p) or TP53 mutation (TP53mut) or combination of gain/amplification (amp) 1q with other HR abnormalities (Rajkumar 2024; Rees et al. 2024; Avet-Loiseau et al. 2025). Moreover, the co-occurrence of any two (double-hit), three or more (triple-hit) HR abnormalities has been termed ultra-HR MM (Rajkumar 2024), as these patients have worse clinical outcomes than those with one HR abnormality (Kaiser et al. 2025; Rajkumar 2020). However, it remains unclear to what extent different HR abnormalities, or their co-occurrence, contribute to treatment resistance and disease progression.
Among HR genetic abnormalities, del(17p) is considered a key prognostic factor in MM (Rees et al. 2024). Although detection of TP53mut using next-generation sequencing (NGS) is still not part of many studies (Rees et al. 2024; Petrackova et al. 2020), new International Myeloma Society/International Myeloma Working Group (IMS/IMWG) Consensus 2025 recommends investigation of TP53 mutations as part of routine practice (Avet-Loiseau et al. 2025). Moreover, data have demonstrated that multi-hit TP53, defined as a combination of del(17p) with TP53mut, or the presence of at least two TP53muts, is associated with less favourable prognosis, even in the era of novel agents (Sreedharanunni et al. 2024).
In this real-world study, we aimed to explore the impact of multi-hit TP53 compared with other HR abnormalities and their co-occurrence on the survival of patients with MM treated with novel agents.
Methods
Patients’ characteristics and study design
The real-world cohort consisted of 204 patients diagnosed with MM according to the International Myeloma Working Group criteria (Rajkumar et al. 2014) who were diagnosed and treated between October 2017 and September 2024; a median follow-up was 28 months (range 1–219). In total, 134 (65.7%) bone marrow (BM) aspirates were obtained from newly diagnosed patients who were treatment naïve (TN) and 70 (34.3%) BM aspirates from patients who were relapsed/refractory (a median of one prior therapy line, range 1–9). All patients were treated with novel agent combinations: proteasome inhibitor (PI) based (bortezomib and carfilzomib), monoclonal antibodies (MoAb; daratumumab and isatuximab), immunomodulatory drugs (lenalidomide, pomalidomide and thalidomide) and bispecific antibodies (elranatamab and teclistamab). In addition, 43 patients received novel drugs with high-dose therapy with the support of autologous stem cell transplantation (ASCT). A comprehensive review based on medical records was conducted to collect demographic, clinical and genetic data related to MM. For 35 patients with MM, paired BM aspirates collected at progression were available (Supplementary Figure S1).
Patients were divided into three groups according to their genetic abnormalities: 1) HR with multi-hit TP53 (subsequently referred to as multi-hit TP53), which included patients with concomitant del(17p) and TP53mut and/or carrying at least two TP53muts; 2) HR without multi-hit TP53 (subsequently referred to as HR); and 3) standard risk (SR). Subanalysis was performed in the HR subgroup based on the number of HR genetic abnormalities (1 vs ≥ 2 HR abnormalities) and HR with/without mono-hit TP53 (i.e. only del(17p) or one TP53mut).
All patients provided written informed consent to sample and data collection for the purpose of this study, which was conducted in accordance with the Helsinki Declaration and approved by the Ethics Committee.
Genetic analyses
A combination of FISH with immunophenotyping, called fluorescence-immunophenotyping and interphase cytogenetics as a tool for investigation of neoplasms (FICTION), was used to assess the cytogenetic abnormalities using following probes: LSI RB1 (Abbott Molecular, IL, USA), SPEC IGH, SPEC CKS1B/CDKN2C, TP53/c17, CCND1/IGH, FGFR3/IGH (Zytovision, Bremerhaven, Germany), XL MAF/IGH, CCND3/IGH, MAFB/IGH (MetaSystems, Altlussheim, Germany) and centromeric probes for chromosomes 7, 9, 11 and 15 (Cytocell, Cambridge, United Kingdom) as reported previously (Kriegova et al. 2021). A threshold of 10% was used as the cut‐off for translocations and 20% for numerical aberrations.
The full coding sequence of the TP53 gene (exons 2–10 including 2 bp intronic overlaps, 5′ and 3′UTRs; NM_000546) was analysed from enriched CD138‐positive cells, as reported previously (Petrackova et al. 2020). Amplicon-based libraries were sequenced as paired-end on MiSeq (2 × 151, Illumina) with minimum target read depths of 5,000x. The limit of detection of TP53mut was set up to 1%, and the variants in the range 1–3% were confirmed by replication. After mapping to the human reference genome (GRCh38) using the Burrows–Wheeler Aligner–MEM algorithm (version 0.7.19, http://bio-bwa.sourceforge.net/), variant calling was performed using the Genome Analysis Toolkit (version 3.8, https://software.broadinstitute.org/gatk/): Unified Genotyper, Haplotype Caller, and MuTect (version 1.1.7). All detected sequence variants were manually checked using Integrative Genomics Viewer and annotated using clinical databases/tools (COSMIC, ClinVar, Ensemble Variant Effect Predictor tool). Only pathogenic or likely pathogenic variants were reported as assessed by ACMG criteria (Richards et al. 2015).
Statistical analyses
The primary endpoint included the impact of HR genetic abnormalities on the progression-free survival (PFS) and overall survival (OS) of patients with MM. PFS was defined as the time between the start of treatment and disease progression or death. OS was defined as the time from diagnosis to the date of the last follow-up (censoring) or date of death. Event-free patients were censored in the analysis. The Kaplan–Meier model was used to represent the survival data, which were compared using the log-rank test. Relative risks (RRs) with 95% confidence intervals (CIs) are presented for the outcomes tested. Multivariable Cox hazards regression models were used to estimate associations of factors with time to event outcomes. Continuous laboratory and clinical variables are presented as medians and compared between groups using Mann–Whitney U test for two groups and the Kruskal–Wallis test for three or more groups. Categorical laboratory and clinical variables are compared between groups using Fisher's exact test. No adjustment for multiple comparisons was performed. A p-value of 0.05 was considered statistically significant. All statistical analyses were performed using Prism (GraphPad Software v10.2.3; Boston, MA, USA) or RStudio Software v2025.05.01 (Boston, MA, USA). GraphPad and Windows PowerPoint software were used for graphical representations of statistical analyses.
Results
Patient characteristics
Of the 204 patients with MM, twenty-four patients (11.9%) harboured multi-hit TP53 aberrations, 108 (52.9%) belonged to HR group and 72 (35.2%) to SR group. For details on the demographic and clinical characteristics and treatment with novel agents see Table 1 and Supplementary Table S1.Table 1. Clinical characteristics of enrolled patients with multiple myeloma and its subgroupsCharacteristicsAll cases^a^(n = 204)Multi-hit TP53(n = 24)HR(n = 108)SR(n = 72)Age (years), median69 (34–89)69 (41–83)69 (34–89)69 (34–89)Sex, n (%) Female97 (47.5)13 (54.2)52 (48.1)32 (44.4) Male107 (52.5)11 (45.8)56 (51.9)40 (55.6)ISS stage, n (%) Stage 162 (30.4)5 (20.8)24 (22.2)33 (45.8) Stage 249 (24.0)7 (29.2)28 (25.9)14 (19.4) Stage 389 (43.6)12 (50.0)54 (50.0)23 (31.9) NA4 (2.0)-2 (1.9)2 (2.8)Ig subtype, n (%) Light chain only39 (19.1)4 (16.7)17 (15.7)18 (25.0) IgA43 (21.1)4 (16.7)29 (26.9)10 (13.9) IgG120 (58.8)16 (66.7)61 (56.5)43 (59.7) IgD1 (0.5)-1 (0.9)- NA1 (0.5)- -1 (1.4)Laboratory parameters, median (min–max) White blood cell counts (10^9^/l)5.46 (0.99–11.75)4.30 (2.16–9.96)5.42 (2.13–11.38)5.96 (0.99–11.75) Red blood cell counts (10^12^/l)3.31 (2.10–5.34)3.13 (2.25–4.10)3.24 (2.36–4.84)3.58 (2.10–5.34) Haemoglobin (g/l)107.0 (72.0–163.0)100.5 (75.0–126.0)105.5 (72.0–146.0)115.0 (74.0–163.0) Thrombocytes (10^9^/l)186 (12–366)168 (12–336)165.5 (28–348)207 (92–366) Lymphocyte counts (10^9^/l)1.38 (0.32–3.63)0.88 (0.55–2.63)1.30 (0.36–3.25)1.45 (0.32–3.63) Monocyte counts (10^9^/l)0.48 (0.04–1.04)0.46 (0.08–0.99)0.47 (0.05–0.97)0.50 (0.04–1.04) Neutrophil counts (10^9^/l)3.21 (0.54–8.46)2.70 (0.83–6.41)3.21 (0.69–8.05)3.52 (0.54–8.46) Eosinophil counts (10^9^/l)0.08 (0.01–0.28)0.03 (0.01–0.21)0.08 (0.01–0.28)0.08 (0.01–0.28) Basophil counts (10^9^/l)0.02 (0.01–0.08)0.02 (0.01–0.08)0.02 (0.01–0.06)0.02 (0.01–0.04) Urea (mmol/l)6.20 (0.98–21.10)6.90 (3.30–19.50)6.50 (2.00–21.10)5.75 (0.98–13.00) Creatinine (µmol/l)81 (39–274)99 (53–274)82 (44–240)79 (39–123) β2-microglobulin (mg/l)2.96 (0.41–9.78)5.68 (2.27–8.30)3.50 (0.41–9.78)2.42 (1.41–4.98) Uric acid (µmol/l)356 (83–660)366 (235–456)365 (159–660)342 (83–585) Bilirubin (µmol/l)7 (2–17)7 (3–12)7 (3–16)7 (2–17) ALT (µkat/l)0.39 (0.15–1.21)0.38 (0.15–0.68)0.39 (0.16–1.21)0.37 (0.15–1.08) AST (µkat/l)0.37 (0.13–0.93)0.38 (0.13–0.78)0.34 (0.13–0.90)0.42 (0.13–0.93) ALP (µkat/l)1.17 (0.44–2.49)1.30 (0.61–2.29)1.14 (0.44–2.21)1.22 (0.54–2.49) GGT (µkat/l)0.47 (0.12–2.39)0.64 (0.19–2.39)0.44 (0.12–2.27)0.50 (0.19–1.54) LDH (µkat/l)3.19 (1.10–5.86)3.30 (1.54–5.14)3.00 (1.10–5.86)3.34 (1.66–5.15) Total protein (g/l)75.15 (43.30–119.90)69.50 (51.40–99.40)78.10 (45.30–119.90)73.40 (43.30–108.90) Albumin (g/l)39.05 (21.50–52.50)39.00 (26.00–44.30)38.55 (21.50–48.00)40.00 (27.20–52.50)Genetic aberrations, n (%) t(4;14)26 (12.7)2 (8.3)24 (22.2)- t(14;16)8 (3.9)1 (4.2)7 (6.5)- 1q21 gain/amp91 (44.6)13 (54.2)78 (72.2)- del(17p)35 (17.6)15 (62.5)20 (18.5)- del(1p)26 (12.8)4 (16.7)22 (20.4)- t(11;14)35 (17.6)5 (20.8)14 (13.0)16 (22.2) Hyperdiploidy107 (52.5)13 (54.2)50 (46.3)44 (61.1)* TP53mut32 (15.7)24 (100.0)8 (7.4)- 1 HR abnormality/≥ 2 HR abnormalities62/70 (47.0/53.0)0/24 (0.0/100.0)62/46 (57.4/42.6)-Treatment lines, n (%) TN/1/2/≤ 3134/37/11/22 (65.7/18.1/5.4/10.8)6/6/5/7 (25.0/25.0/20.8/29.2)75/18/5/10 (69.4/16.7/4.6/9.3)53/13/1/5 (73.6/18.1/1.4/6.9)Treatment regimen, n (%) PI based(bortezomib/carfilzomib)98 (48.0)88/10 (89.8/10.2)8 (33.3)5/3 (62.5/37.5)56 (51.9)52/4 (92.9/7.1)34 (47.2)31/3 (91.2/8.8) ASCT43 (21.1)3 (12.5)21 (19.4)19 (26.4) MoAb based (daratumumab/isatuximab)41 (20.1)29/12 (70.7/29.3)10 (41.7)9/1 (90.0/10.0)19 (17.6)11/8 (57.9/42.1)12 (16.7)9/3 (75.0/25.0) Bispecfic antibodies(elranatamab/teclistamab)11 (5.4)7/4 (63.6/36.4)1 (4.2)-/1 (0.0/100.0)7 (6.5)4/3 (57.1/42.9)3 (4.2)3/0 (100.0/0.0) IMID based(lenalidomide/ pomalidomide/thalidomide)11 (5.4)7/3/1 (63.6/27.3/9.1)2 (8.3)1/1/0 (50.0/50.0/0.0)5 (4.6)3/2/0 (60.0/40.0/0.0)4 (5.6)3/0-/1 (75.0/0.0 /25.0)^a^Patients are included only onceALP* Alkaline phosphatase, ALT Alanine aminotransferase, ASCT Autologous stem cell transplantation, AST Aspartate aminotransferase, FLC Free light chains, GGT Gamma-glutamyl transferase, HR High-risk, IG Immunoglobulin, IMID Immunomodulatory drug, ISS International staging system, LDH Lactate dehydrogenase, MoAb Monoclonal antibody, NA Not available, PI Proteasome inhibitor, SR Standard risk, TN Treatment-naïve
In the HR group, 62 patients (57.4%) had one HR abnormality: gain/amp 1q was detected in 38 patients (61.3%), del(17p) in 12 (19.3%), TP53mut in 5 (8.1%) and t(4;14) in 5 (8.1%); one patient (1.6%) had only t(14;16) and one (1.6%) had only del(1p32). Moreover, 46 patients (42.6%) had ≥ 2 co-occurring HR abnormalities. In the multi-hit TP53 group, 9 patients (37.5%) had no other HR abnormality, 10 patients (41.7%) had one HR abnormality (8 patients with gain/amp 1q, 1 patient with t(4;14) and 1 patient with t(14;16) and 5 patients (20.8%) had two co-occurring other HR abnormalities. Of the patients with multi-hit TP53 abnormalities, 87.5% and 12.5% were classified as patients with triple-hit and double-hit HR abnormalities (Rajkumar 2024), respectively.
Without TP53mut NGS analysis, 3.9% (8/204) of patients would have been misclassified into the SR group. Based on NGS, 20.8% (5/24) of patients were assigned to the multi-hit TP53 group, as they carried ≥ 2 TP53muts and had no other HR abnormalities and 2.7% (3/108) to HR group, as they carried one TP53mut and had no other HR abnormality. The TP53mut, type, variant allele frequency (VAF), cancer clonal fraction and positions of the detected variants are listed in Supplementary Tables S2–S5, Figure S2. The majority of TP53mut detected were missense (80.0%), while nonsense, frameshift, and splice-site variants were relatively rare (4.6%, 7.7%, 7.7%, respectively; Supplementary Table S4). TP53mut were predominantly located within the DNA-binding domain (80.0%) and proline-rich domain (6.2%; Supplementary Figure S2).
Patients with multi-hit TP53 have the shortest survival
Aberrations of the TP53 gene were detected in 52 (25.5%) patients. Of these, multi-hit TP53 was identified in 24 (46.2%) patients. In the multi-hit TP53 group, 15 (62.5%) patients exhibited concurrent del(17p) and ≥ 1 TP53mut and 9 (37.5%) had ≥ 2 TP53mut. To identify independent HR genetic abnormalities predicting short survival, Cox proportional hazard analysis was performed. Of all HR abnormalities, multi-hit TP53 was a significant predictor of shorter OS (hazard ratio: 2.84, 95% CI: 1.29–6.23, p = 0.009; Supplementary Figure S3). Neither only del(17p) nor mono-hit TP53mut were significantly associated with reduced OS. Of the other clinical and laboratory characteristics included in the Cox analysis, only treatment other than ASCT was associated with reduced OS (Supplementary Figure S3).
Patients with multi-hit TP53 had the shortest PFS and OS compared with the HR group (median PFS: 8.5 vs 21.0 months, RR: 2.34, 95% CI: 1.23–4.77, p < 0.001; median OS: 22.0 vs 61.0 months, RR: 2.32, 95% CI: 1.15–4.65, p = 0.002; Fig. 1) and the SR group (median PFS: 8.5 vs 50.0 months, RR: 4.07, 95% CI: 1.89–8.78, p < 0.001; median OS: 22.0 months vs not reached, RR: 3.41, 95% CI: 1.56–7.45, p < 0.001; Fig. 1). Patients with multi-hit TP53 also had shorter PFS and OS than those with mono-hit TP53 (only del(17p) or only TP53mut; median PFS: 8.5 vs 24.0 months, RR: 3.17, 95% CI: 1.54–6.50, p < 0.001; median OS: 22.0 vs 70.0 months, RR: 3.52, 95% CI: 1.59–7.78, p = 0.020; Fig. 1) and patients who were HR without TP53 aberrations (median PFS: 8.5 vs 17.0 months, RR: 2.11, 95% CI: 1.13–3.95, p = 0.002; median OS: 22.0 vs 54.0 months, RR: 2.05, 95% CI: 1.04–4.01, p = 0.011; Fig. 1). In the mono-hit TP53 group, 20 (71.4%) patients exhibited only del(17p) and 8 (28.6%) had one TP53mut. Patients with multi-hit TP53 with a co-occurrence of other HR abnormalities did not differ in PFS to those with multi-hit TP53 and without other HR abnormalities (p = 0.900).Fig. 1. Progression-free survival (PFS) and overall survival (OS) of patients with MM with multi-hit TP53. A Patients with multi-hit TP53 compared with the HR and SR groups (left panel PFS, right panel OS). B Patients with multi-hit TP53 compared with patients with mono-hit TP53 aberrations, patients who are HR without TP53 aberrations and SR. C Patients with multi-hit TP53 compared with ≥ 2 HR abnormalities, one HR abnormality and SR. The median PFS/OS (months) and 95% CI are mentioned in each graph. Mono-hit TP53 is defined as patient with only del(17p) or one TP53mut. The distributions of OS and PFS were estimated by the Kaplan–Meier method. The log-rank test was used to determine statistically significant differences between the survival of different subgroups of patients. The Kaplan–Meier analysis was conducted in RStudio. Number of patients in particular subgroups are presented below the Kaplan–Meier curve. Abbreviations: CI: confidence interval; HR: high risk; MM: multiple myeloma; OS: overall survival; PFS: progression-free survival; SR: standard risk
Subsequently, the comparison of multi-hit TP53 with ≥ 2 other HR abnormalities and one HR revealed that multi-hit TP53 had shortest PFS and OS among the groups compared (multi-hit TP53 vs ≥ 2 HR: median PFS: 8.5 vs 23.0 months, RR: 2.41, 95% CI: 1.25–4.66, p = 0.001; median OS: 22.0 vs 95.0 months, RR: 2.79, 95% CI: 1.13–5.89, p = 0.002; multi-hit TP53 vs one HR: median PFS: 8.5 vs 21.0 months, RR: 2.22, 95% CI: 1.17–4.20, p = 0.002; median OS: 22.0 vs 38.0 months, RR: 2.00, 95% CI: 1.02–3.92, p = 0.019; Fig. 1). No difference in PFS (p = 0.807) and OS (p = 0.185; Fig. 1) was observed between patients with ≥ 2 other HR abnormalities and patients with one HR.
In major treatment groups (PI based, MoAb based), patients with multi-hit TP53 consistently had inferior PFS (Supplementary Table S6 and S7). Patients with multi-hit TP53 treated with PI based therapy had the shortest PFS compared to patients with HR (median PFS: 5.5 vs 21.0 months, RR: 2.35, 95% CI: 0.70–7.91, p = 0.040) and SR (median PFS: 5.5 months vs not reached, RR: 3.53, 95% CI: 0.87–14.31, p = 0.004; Supplementary Figure S4). Within MoAb based therapy, patients with multi-hit TP53 had shorter PFS compared to patients with HR (median PFS: 7.0 vs 23.0 months, RR: 2.32, 95% CI: 0.86–6.27, p = 0.034) and SR (median PFS: 7.0 vs 28.0 months, RR: 3.71, 95% CI: 1.21–11.37, p = 0.002; Supplementary Figure S4). As only three patients with multi-hit TP53 received ASCT, comparison could not be performed. Nevertheless, patients with HR had shorter PFS compared to those with SR within patients who received ASCT (median PFS: 34.0 months vs not reached, RR: 5.02, 95% CI: 1.81–13.90, p = 0.005; Supplementary Figure S4).
Patients with high-risk abnormalities with ≥ 2 prior therapies show less favourable prognosis similarly to multi-hit TP53
We were interested in whether PFS is dependent on the number of prior treatment lines in patients with MM. Because newly diagnosed patients did not differ in PFS from those with one prior therapy line (p = 0.299, Fig. 2), we grouped these patients for further analysis. In a whole cohort, patients with ≥ 2 prior therapy lines had shorter PFS than patients with ≤ 1 prior therapy line (median PFS: 9.0 vs 28.0 months, RR: 2.38, 95% CI: 1.36–4.19, p < 0.001; Fig. 2), irrespective of genetic risk. In the multi-hit TP53 group, no difference in PFS was observed in patients with ≥ 2 prior therapy lines compared with patients with ≤ 1 prior therapy line (p = 0.442; Fig. 2). A reduced PFS in patients with ≥ 2 prior therapy lines compared with patients with ≤ 1 prior therapy line was observed in the HR group (median PFS: 9.0 vs 22.0 months, RR: 1.88, 95% CI: 0.89–4.00, p = 0.035; Fig. 2). Despite worse outcomes in patients in the SR group with ≥ 2 prior therapy lines compared with patients with ≤ 1 prior therapy line, significant difference in PFS was not observed (median PFS: 24.0 months vs not reached, RR: 2.22, 95% CI: 0.52–9.47, p = 0.125; Fig. 2). In patients with ≥ 2 prior therapy lines, no difference in PFS was detected between the multi-hit TP53 and HR and SR groups (median PFS: 8.0 vs 9.0 vs 24.0 months, p = 0.140; Fig. 2).Fig. 2. Progression-free survival (PFS) of patients with MM stratified by the number of prior therapy lines and genetic risk.** A** Patients with MM stratified by the number of prior therapy lines. B Patients with MM stratified by genetic risk and by the number of prior therapy lines. C Patients with multi-hit TP53 compared with the HR and SR groups treated with ≤ 1 prior line of therapy. D Patients with multi-hit TP53 compared with the ≥ 2 HR and one HR and SR groups treated with ≤ 1 prior line of therapy. E Patients with multi-hit TP53 compared with patients in the HR and SR groups treated with ≥ 2 prior therapy lines. The median PFS/OS (months) and 95% CI are mentioned in each graph. The distributions of OS and PFS were estimated by the Kaplan–Meier method. The log-rank test was used to determine statistically significant differences between the survival of different subgroups of patients. The Kaplan–Meier analysis was conducted in RStudio. Number of patients in particular subgroups are presented below the Kaplan–Meier curve. Abbreviations: CI: confidence interval; HR: high risk; MM: multiple myeloma; PFS: progression-free survival; SR: standard risk; TN: treatment naïve
For patients with ≤ 1 prior therapy line, multi-hit TP53 (12; 7.0%) had the shortest PFS compared with the HR group (93; 54.4%) (median PFS: 9.5 vs 22.0 months, RR: 2.34, 95% CI: 0.91–5.98, p = 0.010; Fig. 2) and SR group (66; 38.6%) (median PFS: 9.5 months vs not reached, RR: 4.10, 95% CI: 1.29–13.02, p < 0.001; Fig. 2). Patients with multi-hit TP53 and with ≤ 1 prior therapy line also had the shortest PFS compared with patients with ≥ 2 HR abnormalities (median PFS: 9.5 vs 27.0 months, RR: 2.76, 95% CI: 1.03–7.45, p = 0.005; Fig. 2) and one HR abnormality (median PFS: 9.5 vs 21.0 months, RR: 2.05, 95% CI: 0.84–5.02, p = 0.038; Fig. 2). When only TN patients were considered, the multi-hit TP53 group had the shortest PFS compared with the HR group (median PFS: 9.5 vs 24.0 months, RR: 2.63, 95% CI: 0.65–10.72, p = 0.030) and the SR group (median PFS: 9.5 months vs not reached, RR: 3.92, 95% CI: 0.76–20.13, p = 0.003; Supplementary Figure S5).
Accumulation of TP53 aberrations in patients with multiple myeloma during treatment
The frequency of TP53 aberrations was higher in patients with ≥ 2 prior therapy lines than in patients with ≤ 1 prior therapy line (51.5% vs 20.5%, RR: 2.52, 95% CI: 1.57–3.83, p < 0.001). Also, higher multi-hit TP53 frequency was detected in patients with ≥ 2 prior therapy lines than in those with ≤ 1 prior therapy line (36.4% vs 7.0%, RR: 5.18, 95% CI: 2.54–10.25, p < 0.001; Fig. 3). Regarding other HR abnormalities, a higher frequency of t(4;14) abnormality was detected in patients with ≥ 2 prior therapy lines than in those with ≤ 1 prior therapy line (27.3% vs 9.9%, RR: 2.74, 95% CI: 1.32–5.40, p = 0.018; Supplementary Table S8). No difference was observed in the frequency of patients in the HR group with ≥ 2 prior therapy lines compared to patients with ≤ 1 prior therapy line (Fig. 3). Of note, compared with TN, a higher frequency of patients with multi-hit TP53 was observed in relapsed/refractory patients (4.5% vs 25.7%, RR: 5.74, 95% CI: 2.46–13.51, p < 0.001; Supplementary Table S9).Fig. 3. Accumulation of multi-hit TP53 in patients with MM with ≥ 2 prior therapy lines. Frequency of multi-hit and mono-hit TP53 aberrations in patients treated with ≤ 1 prior line of therapy (n = 171) and ≥ 2 prior therapy lines (n = 33). P-values were estimated using Fisher’s exact test. Abbreviations: HR: high risk; MM: multiple myeloma; SR: standard risk; TN: treatment naïve
Next, we considered the paired BM samples (baseline and progression) available for 35 patients with MM. At baseline sampling, TP53 aberrations were present in nine patients (25.7%), three with del(17p) and six with TP53mut. The majority (83.0%) of patients with TP53mut at baseline exhibited higher VAF in the TP53mut at relapse, and 50% acquired additional TP53muts at relapse (Supplementary Table S5). For eight patients without TP53 aberration at baseline, six acquired TP53mut and two del(17p) at relapse (Supplementary Table S10). No difference was observed between number of patients who acquired TP53 aberrations after receiving ASCT (22.2%) compared to other therapies (33.3%; p = 0.676).
Blood counts and laboratory parameters in multi-hit TP53 multiple myeloma
Next, we investigated the blood counts and laboratory parameters in patients in the multi-hit TP53, HR and SR groups. Among the three groups, patients with multi-hit TP53 had the lowest white blood cell (median 10^9^/l: 4.30 vs 5.42 vs 5.96, p ≤ 0.054) and lymphocyte (median 10^9^/l: 0.88 vs 1.30 vs 1.45, p ≤ 0.003; Fig. 4) counts, with all values being within physiological values. Moreover, patients with multi-hit TP53 had the highest serum levels of β2-microglobulin (median mg/l: 5.68 vs 3.50 vs 2.42, p ≤ 0.015) and creatinine (median µmol/l: 99.00 vs 82.00 vs 79.00, p ≤ 0.036; Fig. 4).Fig. 4. Distribution of blood counts, creatinine and β2-microglobulin serum levels in patients with MM within the multi-hit TP53, HR and SR groups. The Mann–Whitney U test was used to estimate p-values using RStudio. Group means are indicated by horizontal bars; error bars indicate 95% CIs. Abbreviations: ALC: absolute lymphocyte count; CI: confidence interval; HR: high-risk myeloma; MM: multiple myeloma; SR: standard-risk myeloma; WBC: white blood cell count
Discussion
Despite therapeutic advances in MM, a subset of patients continues to experience disease progression, highlighting the need for refined risk stratification and individualised treatment approaches (Rees et al. 2024; Kaiser et al. 2025; Abu Za’nouneh et al. 2023). The present study provides a real-world analysis addressing the impact of different HR genetics and their co-occurrence, particularly the impact of multi-hit TP53 on PFS, OS and the blood signature of patients with MM.
A myriad of prognostic factors has been identified and incorporated into risk stratification models, but they still fail to identify many patients with MM developing early relapse (Rees et al. 2024). Evidence exists regarding the ultra-HR group with ≥ 2 HR genetic abnormalities (Rajkumar 2024; Rees et al. 2024), but it remains unclear whether specific HR abnormalities and their co-occurrence are less favourable than others. We assessed the impact of HR genetic abnormalities, such as t(4;14), t(14;16), t(14;20), gain/amp 1q, del(1p), del(17p) and TP53mut, and their co-occurrences in a real-world cohort, revealing that patients with a multi-hit TP53 constitute the poorest prognostic group within the whole MM cohort. Patients with multi-hit TP53 had very short PFS, independently on a number of therapy lines and major therapy strata. The relative risk of early progression in patients with multi-hit TP53 is almost three times higher than that of patients with HR abnormalities and four times higher than that of patients in the SR group. Multi-hit TP53 had the shortest survival within all the risk groups (multi-hit TP53 vs HR vs SR; median PFS: 8.5 vs 21.0 vs 50.0 months; median OS: 22.0 vs 61.0 months vs not reached, respectively). Importantly, multi-hit TP53 had the shortest survival when compared with the co-occurrence of ≥ 2 other HR genetic abnormalities (median PFS: 8.5 vs 23.0 months; median OS: 22.0 vs 95.0 months), a poor prognostic factor nominated by several studies (Fig. 5) (Rajkumar 2024; Rees et al. 2024; Kaiser et al. 2025). Our results are consistent with previous studies, including CoMMpass study (Ramón et al. 2022), which show that patients with multi-hit TP53 and patients with biallelic TP53 inactivation have inferior PFS and OS, but unlike our analysis, none of them provided a comparison with other HR abnormalities (Sreedharanunni et al. 2024; Martello et al. 2022; Walker et al. 2019).Fig. 5. Results study overview. Abbreviations: HR: high risk, OS: overall survival, PFS: progression-free survival
Regarding functional impact of multi-hit TP53, a study using a MM cell line model observed abolished p53 activity and increased resistance to genotoxic drugs in cells harbouring two TP53 hits, compared to cells with one or two wild-type TP53 alleles (Munawar et al. 2019). TP53 suppresses tumor development by regulating genes involved in apoptosis, cell-cycle arrest, and DNA repair, and to perform its transcription factor function, four p53 molecules self-assemble on DNA to form a tetramer. While some TP53 mutations cause loss of the p53 protein, most are missense substitutions in the DNA-binding domain that impair protein function (Joerger et al. 2025; Wang et al. 2024). Mutant p53 proteins have been proposed to promote malignancy through three processes: (i) loss-of-function, i.e., the inability of mutant p53 to activate the expression of genes that are transcriptionally activated by wild type (WT) p53 to suppress tumorigenesis; (ii) exerting a dominant-negative effect over the WT protein through the formation of mixed tetramers with weakened DNA-binding; and (iii) gain-of-function, which is mediated by co-aggregation of mutant p53 with other transcriptional regulators, including the paralogs p63 and p73 (Joerger et al. 2025; Wang et al. 2024). In thermolabile p53 mutants, a series of aggregation-prone sequence motifs are exposed, driving aberrant interactions and cellular responses not normally affected by WT p53. For example, binding to p73 has been postulated as one possible gain-of-function mechanism of mutant p53, thereby reducing the possibility of a salvage pathway (Li and Prives 2007). In our study, distributions and types of TP53mut were in line with previously published results in MM (Sreedharanunni et al. 2024; Walker et al. 2019; Chin et al. 2017; Leroy et al. 2013).
We observed an increased frequency of TP53 abnormalities in patients with ≥ 2 prior therapy lines, further supporting the concept that treatment pressure drives clonal evolution in MM, favouring the outgrowth of TP53-aberrant populations (Sreedharanunni et al. 2024; Martello et al. 2022; Chin et al. 2017; Jovanović et al. 2019; Kortüm et al. 2016). Importantly, multi-hit TP53 was 5 times more frequent in patients with ≥ 2 prior therapy lines compared to patients with less therapy lines. In our cohort, the same frequency of patients who acquired TP53 aberrations after receiving ASCT was observed compared to other therapies. Notably, our analysis of longitudinal samples identified that the majority of patients with TP53mut at baseline exhibited higher VAF of the TP53mut at relapse, and half acquired additional TP53mut, as demonstrated also by others (Sreedharanunni et al. 2024; Martello et al. 2022). Considering that TP53 alterations increase during progression of MM and are associated with drug resistance, it might be necessary to interact with TP53 pathway to be able to significantly improve outcomes of MM patients, or at least develop treatment strategies that do not select TP53 subclones (Jovanović et al. 2019). Based on ex vivo drug screening, MM with TP53mut may be targetable by approved inhibitors of mitosis, topoisomerase, HDAC, HSP90, IGF1R and PI3K/AKT/mTOR pathways (Tsallos et al. 2024). Another study revealed that a BH3 mimetics combination may be beneficial for patients with biallelic TP53 disruption (Durand et al. 2024).
When we investigated the relationship between HR genetic abnormalities and treatment lines, patients with HR who had received ≥ 2 prior lines had shorter PFS than those with ≤ 1 prior therapy line (median PFS: 9.0 vs 22.0 months), having an equally detrimental effect on survival as multi-hit TP53 (median PFS: 8.0 vs 9.5 months). As the study cohort included modest number of patients who received ≥ 2 prior lines, this result should be confirmed in larger cohorts. However, the influence of treatment lines on survival in MM has been already reported (Avet-Loiseau et al. 2010; Wang et al. 2023) and may be linked to the dysfunctional microenvironment (Visram et al. 2021 Mar 1).
Recent studies suggest that the co-occurrence of ≥ 2 HR (double-hit and triple-hit MM) genetic abnormalities form an ultra-HR group (Kaiser et al. 2025; Baysal et al. 2020; Shen et al. 2021). However, these studies have not assessed TP53mut status. In our cohort, the co-occurrence of ≥ 2 HR abnormalities, excluding multi-hit TP53, was not associated with reduced PFS and OS when compared with patients with one HR abnormality. By contrast, the co-occurrence of ≥ 2 HR abnormalities had longer PFS and OS than multi-hit TP53 in MM. In our cohort, 87.5% and 12.5% of patients with multi-hit TP53 could be classified as having triple-hit and double-hit HR abnormalities, respectively. These observations suggest that the shorter survival of double-hit and triple-hit MM is more likely attributed to the presence of underlying multi-hit TP53 than to the co-occurrence of other multiple HR abnormalities. Future studies should confirm our observation in larger cohorts.
We further emphasise the importance of TP53mut assessment in MM. In our cohort, ~ 4% of the patients would have been misclassified into the SR group without NGS analysis of TP53mut. Moreover, without NGS, we would have missed all patients with multi-hit TP53 that occurred at a frequency of ~ 7% in those with ≤ 1 prior therapy line and at ~ 36% in those with ≥ 2 prior therapy lines. Our data further support current IMS/IMWG consensus, which has updated MM prognostic classification and recommends that TP53mut, identified using NGS-based methods on CD138-positive/purified cells, should be included in the HR MM definition (Avet-Loiseau et al. 2025). Routine assessment of TP53 mutational status in MM is particularly crucial for patients with multi-hit TP53 and those with TP53mut but without del(17p), as they will not be correctly risk stratified and are thus less likely to be prioritised for novel therapies within trials or for earlier or optimised therapeutic intervention (Berdeja et al. 2021; Moreau et al. 2022; Munshi et al. 2021; Pasvolsky et al. 2023).
In examining the circulating immune microenvironment, we found that patients with multi-hit TP53 had the lowest counts of white blood cells and lymphocytes and the highest serum creatinine and β2-microglobulin levels compared with patients in the HR and SR groups. A recent study evaluating 11,427 patients with MM found that lymphopenia at diagnosis and during treatment and follow-up was associated with inferior OS (Ferri et al. 2025). However, this study did not evaluate TP53 and other HR abnormalities, and we may only hypothesise that, in some patients, the underlying lymphopenia might be associated with multi-hit TP53 abnormalities. In addition, our patients with multi-hit TP53 exhibited elevated levels of β2-microglobulin, a prognostic factor of poor prognosis, and creatinine, an indicator of renal impairment, when compared with the HR and SR groups. These findings further support the association of multi-hit TP53 with more aggressive disease phenotypes.
This study has several limitations. Despite the modest size of the patient cohort, especially in group of patients with ≥ 2 prior therapies, this is a well-clinically characterised, real-world cohort of patients with the full spectrum of evaluated genetic HR abnormalities, including TP53mut. Moreover, the study covers patients with MM who are newly diagnosed as well as those who are relapsed/refractory, which enables us to evaluate the impact of treatment lines and the accumulation of TP53 abnormalities. Our results are consistent with previously published results (Sreedharanunni et al. 2024; Ramón et al. 2022; Martello et al. 2022; Walker et al. 2019) but future studies on larger cohorts would strengthen our findings. In multi-hit TP53 cases, we could not determine the allelic configuration (cis or trans) or whether the aberrations occurred within the same clone, as TP53 mutations were identified by diagnostic NGS using short-read sequencing. We included all patients on novel agents, but a subanalysis of patients with bispecific antibodies could not be performed because only one patient had multi-hit TP53. Similarly, we were not able to evaluate the benefit of ASCT because of the small number of patients in the multi-hit TP53 group treated using this modality. Furthermore, it cannot be excluded that patients treated with combination of one novel agent had the least favourable prognosis of all the diagnostic groups because they were clinically frail and had a higher risk of treatment-related toxicity.
This study demonstrates that patients with multi-hit TP53 represent the poorest prognostic group in MM, even when compared with patients with ≥ 2 other HR genetic abnormalities and independently of the number of prior lines of therapy. The relative risk of early progression in patients with multi-hit TP53 is almost three times higher than that of patients with other HR abnormalities and four times higher than that of patients in the SR group. The frequency of patients with multi-hit TP53 increases in later disease stages even in the context of novel therapies. We also emphasize the importance of TP53mut assessment in routine practice and studies in MM. Our real-world study highlights the value of redefining HR stratification in MM and the need for novel therapeutic strategies for patients with multi-hit TP53.
Supplementary Information
Supplementary Material 1.
The reference list from the paper itself. Each links out to its DOI / PubMed record.
- 1Abu Za’nouneh FJ, Ababneh O, Schinke C, Thanendrarajan S, Zangari M, Shaughnessy JD, et al. Variability of definition of high-risk multiple myeloma across phase III clinical trials. EJ Haem. 2023;4(2):454–8. 10.1002/jha 2.67510.1002/jha 2.675PMC 1018847037206288 · doi ↗ · pubmed ↗
- 2Leroy B, Fournier JL, Ishioka C, Monti P, Inga A, Fronza G, Soussi T. The TP 53 website: an integrative resource centre for the TP 53 mutation database and TP 53 mutant analysis. Nucleic Acids Res. 2013; 41(Database issue):D 962–9. 10.1093/nar/gks 103310.1093/nar/gks 1033 PMC 353117223161690 · doi ↗ · pubmed ↗