Patulin Biodegradation by Rhodosporidiobolus ruineniae and Meyerozyma guilliermondii Isolated From Fruits
Yidan Ji, Sung‐Yong Hong, Jinhuan Qu, Qing Chu, Shuxian Ma, Ae‐Son Om

TL;DR
Two yeast strains were found to effectively break down patulin, a harmful substance in fruits, into a less toxic compound.
Contribution
The study identifies two yeast strains capable of degrading patulin into (E)-ascladiol through intracellular mechanisms.
Findings
Both yeast strains degraded 1 μg mL−1 of patulin to below regulatory limits within 60 hours at 35°C.
Patulin degradation occurs inside the yeast cells and results in the production of (E)-ascladiol.
Patulin degradation ability was inducible in Meyerozyma guilliermondii.
Abstract
Patulin (PAT) is a toxic secondary metabolite produced by certain species of Penicillium and Aspergillus on pome fruits. In this study, we isolated Rhodosporidiobolus ruineniae (R. ruineniae) and Meyerozyma guilliermondii (M. guilliermondii) from a peach and an apple as candidates for PAT degradation, respectively, and investigated the effects of three key parameters (incubation time and temperature, and initial PAT concentration) on PAT removal rates, and the mechanism involved in PAT degradation by the yeast strains. The PAT degradation rate by the yeast strains was dependent on the three key parameters. Both yeast strains were able to degrade 1 μg mL−1 of PAT to below the regulatory limit (50 µg L−1) at 60 h when they were incubated at 35°C. The PAT removal by the yeast strains was not due to either binding onto yeast cell walls or degradation by extracellular fractions of the yeast…
Genes, proteins, chemicals, diseases, species, mutations and cell lines named across the full text — each resolved to its canonical identifier and authoritative record.
Click any figure to enlarge with its caption.
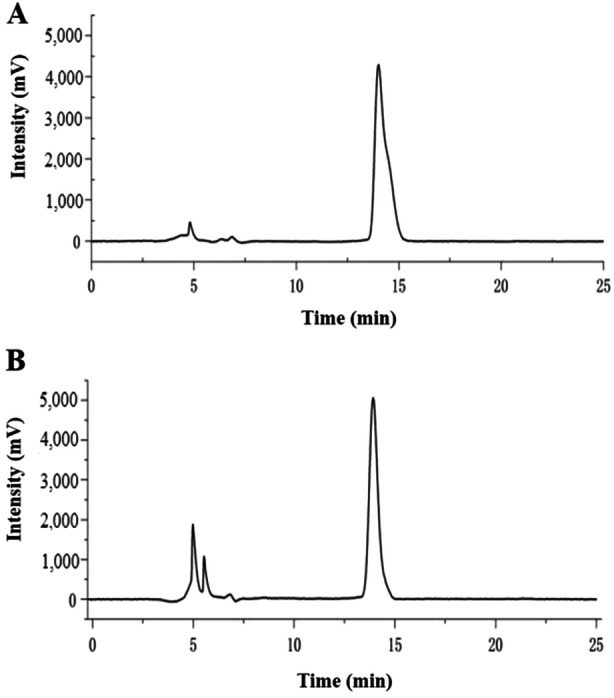 Figure 1
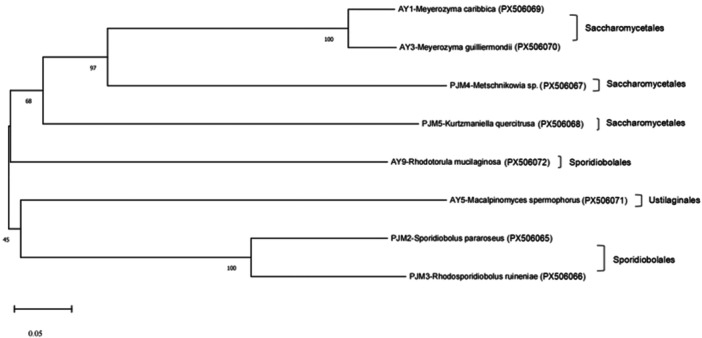 Figure 2
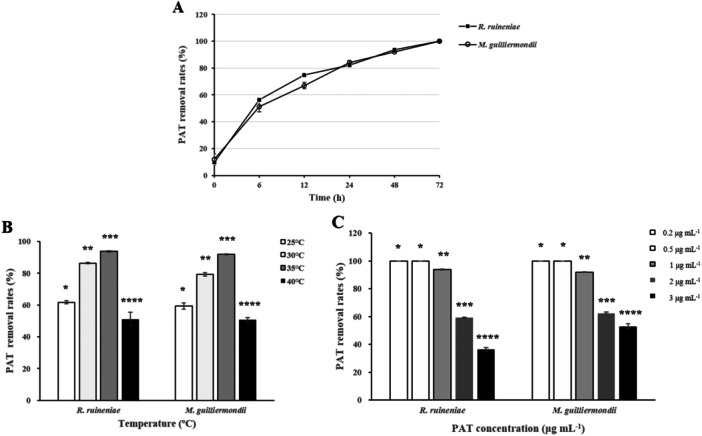 Figure 3
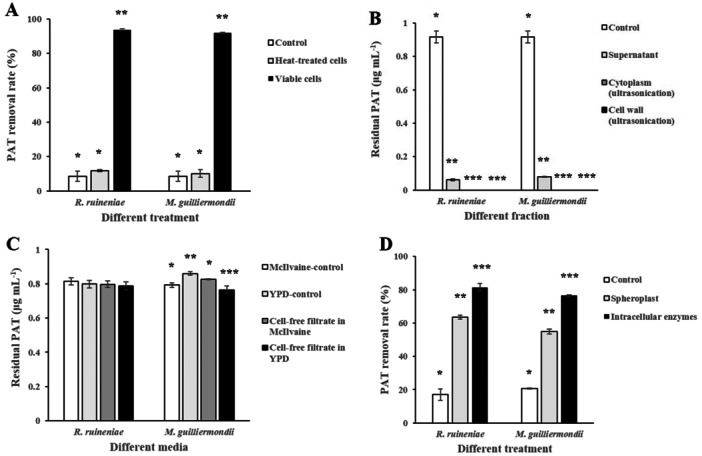 Figure 4
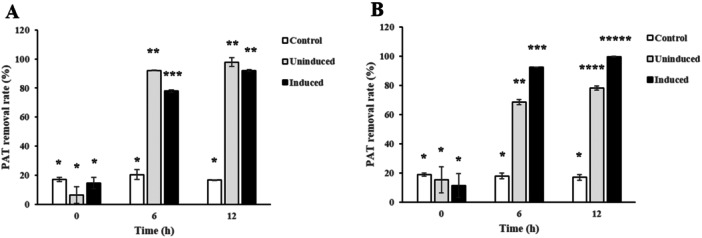 Figure 5
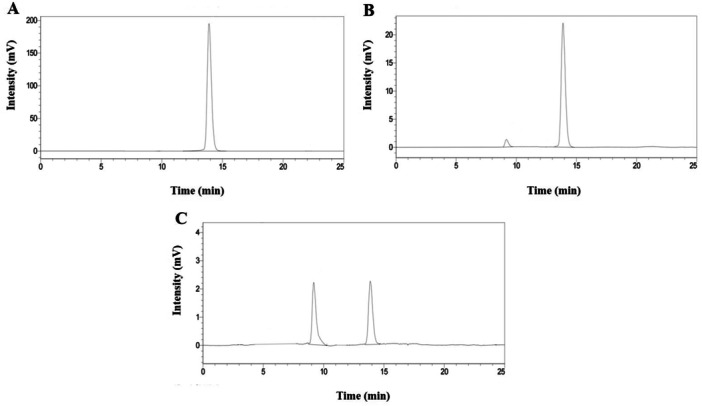 Figure 6
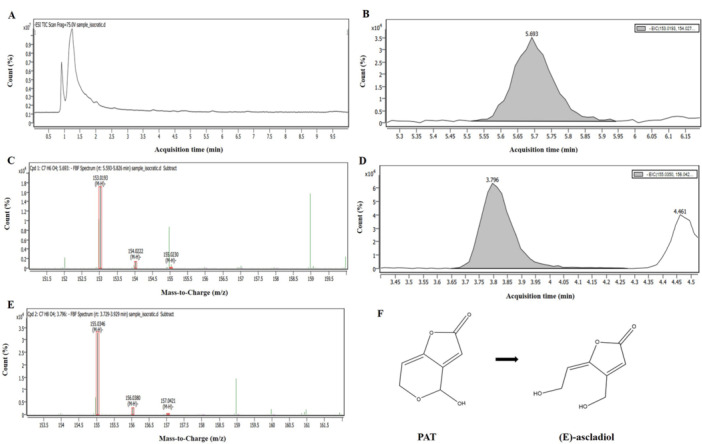 Figure 7
| PAT level (μg mL−1) | Recovery (%) | RSDr |
|---|---|---|
| 0.2 | 89.18 ± 2.54 | 2.85 |
| 0.5 | 89.99 ± 3.03 | 3.37 |
| 1.0 | 89.93 ± 1.18 | 1.32 |
| Type of fruit | Sample ID | Scientific name (BLASTn accession no. | Sequence similarity (%) |
|---|---|---|---|
| Peach | PJM1 |
( | 96.34 |
| Peach | PJM2 |
( | 98.75 |
| Peach | PJM3 |
( | 99.17 |
| Peach | PJM4 |
( | 96.94 |
| Peach | PJM5 |
( | 96.47 |
| Peach | PJM6 |
( | 93.45 |
| Apple | A‐Y1 |
( | 99.68 |
| Apple | A‐Y2 |
( | 99.24 |
| Apple | A‐Y3 |
( | 99.83 |
| Apple | A‐Y4 |
( | 97.34 |
| Apple | A‐Y5 |
( | 96.55 |
| Apple | A‐Y6 |
( | 94.63 |
| Apple | A‐Y7 |
( | 98.97 |
| Apple | A‐Y8 |
( | 94.63 |
| Apple | A‐Y9 |
( | 99.44 |
| Apple | A‐Y10 |
( | 98.24 |
| Yeast strain (Sample ID, GenBank accession number) | Biomass (OD600nm) | PAT removal rate (%) |
|---|---|---|
|
(PJM2, | 0.26 ± 0.01* | 90.59 ± 0.14* |
|
(PJM3, | 0.29 ± 0.01*, **** | 92.40 ± 0.32** |
|
(PJM4, | 0.15 ± 0.01** | 89.90 ± 0.40* |
|
(PJM5, | 0.28 ± 0.01*, **** | 87.58 ± 0.98*** |
|
(A‐Y1, | 0.38 ± 0.02*** | 87.08 ± 0.90*** |
|
(A‐Y3, | 0.42 ± 0.01*** | 91.69 ± 0.37** |
|
(A‐Y5, | 0.30 ± 0.02*, **** | 81.16 ± 1.25**** |
|
(A‐Y9, | 0.35 ± 0.05***, **** | 85.85 ± 1.02*** |
| Control (sterile DW without yeast) | — | 12.86 ± 3.23***** |
Peer Reviews
No public reviews on file for this paper yet. If you reviewed it on a platform where reviews are public (OpenReview, ICLR, NeurIPS, ICML), you can paste yours below so the community can read it here.
Videos
No videos yet. Explain this paper in a talk, walkthrough, or lecture? Add one.
Taxonomy
TopicsMycotoxins in Agriculture and Food · Antioxidant Activity and Oxidative Stress · Plant Surface Properties and Treatments
Introduction
1
Patulin (4‐hydroxy‐4H‐furo[3,2c]pyran‐2[6H]‐one, PAT) is a toxic secondary metabolite produced by various fungi such as Penicillium sp., Aspergillus sp., and Byssochlamys sp. on mainly fruits and vegetables, including apples, peaches, pears, and their products (Moake et al. 2005). PAT contamination occurs in rotten fruits and vegetables decayed by the postharvest pathogens when they are stored under relatively high moisture and moderate temperature for a long period of time. The PAT contamination of fruits and vegetables poses a serious health risk to consumers and is a major issue in food safety because it is classified as a Group 3 carcinogen by the International Agency for Research on Cancer (IARC) (Ianiri et al. 2017; Tannous et al. 2018). The PAT toxicity includes immunotoxic, neurotoxic, genotoxic, teratogenic, and carcinogenic effects as a chronic health risk, whereas it can cause edema, ulceration, inflammation, and gastrointestinal and alveolar hemorrhage as acute poisoning (Fu et al. 2021; Moake et al. 2005; Puel et al. 2010; Tannous et al. 2018). The underlying mechanism of PAT toxicity has been proposed due to adduct formation with thiol‐containing cellular components such as glutathione and cysteine‐containing proteins, leading to inhibition of protein and DNA syntheses and disruption of transcription and translation (Fliege and Metzler 1999, 2000; Moake et al. 2005). Thus, the Codex Alimentarius Commission (CAC), along with the US Food and Drug Administration (FDA) and European Commission (EC), has established a maximum tolerable limit (50 µg L^−1^) of PAT in apple‐based products (Codex Alimentarius Commission [CAC] 2003; European Commision [EC] 2023; US Food and Drug Administration [FDA] 2005). Thereafter, many regulatory agencies worldwide, such as Korea Ministry of Food and Drug Safety (MFDS), started to place limitations on the PAT content in single‐strength and reconstituted apple juice (Kang et al. 2010).
The PAT is also highly stable under acidic conditions and resistant to thermal denaturation, which makes it difficult to remove it from food products (Moake et al. 2005). Several strategies have been proposed for PAT detoxification, including physical methods such as adsorption by activated charcoal, chemical decontamination such as degradation by food‐grade additives, and biological control methods such as degradation by enzymes or microorganisms, and adsorption by cell walls (Moake et al. 2005; Wright 2015; Zheng et al. 2021). However, there may be some problems in the use of physical and chemical methods for PAT detoxification. Both methods can cause adverse effects on the organoleptic, physicochemical, and nutritional quality of food as well as limited efficacy and high cost (Kabak et al. 2006). Thus, the use of biological control methods is considered a powerful potential alternative method.
In recent years, several microorganisms, including some bacteria such as Lactobacillus sp. and Gluconobacter sp., and some yeasts such as Saccharomyces sp., Pichia sp., and Candida sp., and a filamentous fungus Acremonium sp. have shown PAT detoxification ability (Fu et al. 2021; Mita et al. 2023; Zheng et al. 2021). Lactobacillus rhamnosus and Gluconobacter oxydans were able to remove 70%–94% of PAT by binding onto their cell walls, whereas Saccharomyces cerevisiae (S. cerevisiae), Meyerozyma caribbica (M. caribbica; formerly Pichia caribbica [P. caribbica]), Candida guilliermondii (C. guilliermondii), Kluyveromyces marxianus (K. marxianus), Acremonium sp., Cyberlindnera sp., and Wickerhamomyces sp. were able to degrade 92%–100% of PAT by their enzymes (Chen et al. 2017; M. Li et al. 2018; J. Li et al. 2020; Markov et al. 2019; Mita et al. 2023; Song et al. 2024; Yang et al. 2024; Zhang et al. 2025; Zheng et al. 2016; Zhou et al. 2025). Many of the yeasts were isolated from soil and only a few were from food products such as apples. Since yeasts isolated from food products are considered favorable for application to PAT‐contaminated foods, in this study, we isolated two PAT‐degrading yeast strains, Rhodosporidiobolus ruineniae (R. ruineniae) and Meyerozyma guilliermondii (M. guilliermondii; formerly Pichia guilliermondii, anamorph C. guilliermondii), from a peach and an apple, respectively, and investigated the mechanism involved in PAT degradation and the major biodegradation product. Our results showed that PAT (1 μg mL^−1^) was completely degraded (100%) by each yeast strain at 72 h and 35°C, and that intracellular enzymes from the yeast strains produced (E)‐ascladiol as a PAT degradation product. This study reports conversion of PAT to (E)‐ascladiol, a less toxic product, by R. ruineniae.
Materials and Methods
2
Chemicals and Reagents
2.1
PAT standard (≥ 98.0% purity), HPLC grade acetic acid, Tween 80, proteinase K, lyticase, ethanol, chloramphenicol, tetracycline, and disodium ethylenediaminetetraacetic acid (Na_2_EDTA) were purchased from Sigma‐Aldrich Co. (St. Louis, MO, USA). Ethyl acetate and d‐sorbitol were obtained from Daejung Chemical Co. (Seoul, South Korea), whereas sodium carbonate (Na_2_CO_3_) and potassium acetate were from Samchun Chemical Co. (Seoul, South Korea). Tris base and sodium dodecyl sulfate (SDS) were obtained from Bio‐Rad (Hercules, CA, USA). Anhydrous sodium sulfate (Na_2_SO_4_), sodium acetate, and isopropanol were purchased from Junsei Chemical Co. (Tokyo, Japan), while acetonitrile (ACN, HPLC grade) was from Supelco (Darmstadt, Germany).
PAT Standard Solutions
2.2
A PAT stock solution (200 μg mL^−1^) was prepared by mixing 5 mg of PAT powder with 25 mL of ethyl acetate and stored at −20°C. Five levels of PAT standard solutions (0.1, 0.2, 0.5, 1.0, and 2.0 μg mL^−1^) were prepared freshly by dilutions of the stock solution with ethyl acetate. Then, 1 mL of each standard solution was evaporated to dryness under nitrogen at 60°C. The residue was dissolved in 1 mL of acidified sterile distilled water (DW; pH 4.0, adjusted with acetic acid), filtered through a 0.2 μm sterile syringe filter (Hyundai Micro Co. Seoul, Korea), and stored at −20°C until use.
Isolation of Yeasts From Peaches and Apples
2.3
Fresh peaches (cultivar Daewol) and apples (cultivar Aori) were collected from Yeongcheon and Yeongju, respectively, Gyeongsangbuk‐do in Korea and used to search for PAT‐degrading yeast strains. After microorganism suspensions were obtained from the surface of the peaches and apples by the cotton swab method using 0.85% sterile NaCl solution, they were inoculated onto potato dextrose agar (PDA; MB Cell, Seoul, Korea) plates containing 0.5 μg mL^−1^ of chloramphenicol and 0.5 μg mL^−1^ of tetracycline. The PDA plates were then incubated at 30°C for 3 days. Yeast colonies were isolated by inoculation onto yeast extract peptone dextrose (YPD; MB Cell, Seoul, Korea) agar plates, which were then incubated at 30°C for 3 days.
Identification of Isolated Yeasts
2.4
For yeast genomic DNA isolation, a small‐scale miniprep method was used according to a Cold Spring Harbor Laboratory course manual with minor modifications (Amberg et al. 2005). Briefly, yeast cells were cultured in 5 mL of YPD at 30°C with shaking at 150 rpm overnight. After centrifugation at 2000 rpm for 5 min, the yeast cells were resuspended in 0.5 mL of sorbitol solution containing 1 M sorbitol and 0.1 M Na_2_EDTA (pH 7.5). Then, 0.02 mL of lyticase (0.5 mg mL^−1^) was added to it and it was incubated at 37°C for 1 h. After centrifugation at 2000 rpm for 1 min, yeast cells were resuspended in 0.05 mL of 10% SDS plus 0.5 mL buffer solution containing 50 mM Tris·Cl (pH 7.4) and 20 mM Na_2_EDTA (pH 7.5), and it was incubated at 65°C for 30 min. Next, after 0.2 mL of 5 M potassium acetate was added to it, it was incubated on ice for 1 h. Finally, one volume of 100% isopropanol was added to the supernatant after centrifugation at 2000 rpm for 5 min, and it was incubated at room temperature for 5 min. After centrifugation for 5 min, the air‐dried DNA pellet was resuspended in 0.3 mL of TE (pH 7.4).
Yeast isolates were identified using DNA sequencing of the internal transcribed spacer 1 (ITS1)‐5.8S rDNA‐ITS2 region on yeast rDNA (White et al. 1990). Briefly, the ITS region of the isolated genomic DNA was amplified using two specific primers (ITS1 and 4) for identification of yeast species. The primer sequences are as follows: ITS1 (5′‐TCCGTAGGTGAACCTGCGG‐3′, forward) and ITS4 (5′‐TCCTCCGCTTATTGATATGC‐3′, reverse). Polymerase chain reaction (PCR) was performed at 95°C for 5 min, followed by 35 cycles of 95°C for 1 min (denaturation), 55°C for 1 min (annealing), and 72°C for 2 min (extension), and 72°C for 10 min (final extension). After the PCR products were separated on 1.2% (w/v) agarose gels by electrophoresis and purified using AccuPep PCR/Gel Purification Kit (Bioneer, Daejeon, Korea), they were sequenced by Biofact Co. (Daejeon, South Korea). Then, the yeast isolates were identified by the local similarity between DNA sequences of the PCR products and DNA sequences of yeast strains retrieved from GenBank in National Center for Biotechnology Information (NCBI) using BLASTn (Basic Local Alignment Search Tool nucleotide).
The phylogenetic tree was constructed using MEGAX program (v 11) based on the neighbor‐joining (NJ) method (Saitou and Nei 1987) along with DNA sequences of identified yeast species.
PAT Extraction and Determination of the Levels of PAT by HPLC
2.5
PAT was extracted from samples, which were used for measuring PAT recovery and removal rates, by the AOAC official method 995.10 with slight modifications as described previously (AOAC International 2000; X. Wei et al. 2022). Briefly, each sample was extracted twice with 5 mL of ethyl acetate and washed with 1 mL of 1.5% sodium carbonate solution. Then, it was dried over anhydrous sodium sulfate and evaporated to dryness under nitrogen at 60°C. The residue was dissolved in 1 mL of acidified sterile DW (pH 4, adjusted with acetic acid) and filtered through a 0.2 μm syringe filter (Hyundai Micro Co., Seoul, Korea) prior to injection onto a high‐performance liquid chromatography (HPLC).
A HPLC system (LC‐20AT; Shimadzu, Tokyo, Japan), which was equipped with a UV detector (UVD, SPD‐10A, Shimadzu, Tokyo, Japan), was used to detect and quantify PAT at 276 nm. Separation of analytes was carried out on a ZORBAX Eclips plus C18 column (4.6 mm × 250 mm, 5 μm particle size; Agilent, Santa Clara, CA, USA) with a flow rate of 0.5 mL min^−1^. The column oven temperature was set at 32°C, and the injection volume of the samples was 20 μL. The mobile phase was composed of 10% ACN (ACN: DW = 10:90, v/v), giving a total run time of 30 min.
The linearity of a series of PAT concentrations in the HPLC method was evaluated by a calibration curve using five levels of PAT standard solutions (0.1, 0.2, 0.5, 1, and 2 μg mL^−1^). The calibration curve of PAT was constructed by plotting the peak areas (y‐axis) versus PAT concentrations (x‐axis) in HPLC‐UVD analysis. The linearity was then determined by linear regression analysis and expressed as a coefficient of determination (r ^2^).
To determine the recovery rate of PAT, McIlvaine buffer (citric acid‐Na_2_HPO_4_, pH 4) solution was spiked with PAT standard solution (200 μg mL^−1^) to give concentrations of 0.2, 0.5, and 1 μg mL^−1^ PAT. PAT extraction from the spiked samples was performed by the procedures described above. After levels of PAT in the samples were analyzed by HPLC‐UVD, the recoveries were calculated by the following equation and expressed as mean ± standard deviation (SD):
The repeatability (within‐day precision) was determined by three consecutive injections of PAT solutions, which were extracted from the spiked samples, within a day. The within‐day precision was expressed as relative standard deviation (RSDr) of PAT levels measured in triplicate.
The sensitivity of the HPLC‐UVD method was determined by a limit of detection (LOD) and limit of quantification (LOQ). They were calculated by the following equation using the slope (S) of the calibration curve, which was obtained from assessment of recovery rates, and the standard deviation (SD) of the response.
Screening for PAT Removal Yeasts
2.6
Each yeast strain was cultured at 28°C with shaking at 150 rpm for 48 h after inoculation of 100 μL of an overnight seed culture (OD_600nm_ = 0.01) into 5 mL YPD (pH 4) spiked with 1 μg mL^−1^ of PAT. Five milliliters of YPD (pH 4) spiked with 1 μg mL^−1^ of PAT, to which sterile DW (100 μL) was added, was used as a control. PAT was then extracted and analyzed by the procedure described above. PAT removal rates were calculated and expressed as mean ± standard deviation (SD).
PAT Removal Rates by R. ruineniae or M. guilliermondii Under Different Conditions
2.7
The effects of incubation time, incubation temperature, and initial PAT concentration on PAT removal rates by yeast strains were tested using McIlvaine buffer solution (pH 4). After each yeast strain was cultured in YPD at 28°C with shaking at 150 rpm overnight, it was washed with sterile DW twice and resuspended in a sterile McIlvaine buffer solution (pH 4). Then, to investigate the effect of incubation time, 100 μL of yeast cell suspension, which was adjusted to 1 × 10^9^ cells mL^−1^, was inoculated into 5 mL of sterile McIlvaine buffer solution (pH 4) containing 1 μg mL^−1^ of PAT, and it was incubated at 35°C with shaking at 150 rpm for 0, 6, 12, 24, 48, and 72 h. A sterile McIlvaine buffer solution (pH 4) containing only PAT without yeast was used as a control.
To examine the effect of incubation temperature, 5 mL of sterile McIlvaine buffer solution (pH 4) containing 1 μg mL^−1^ of PAT was incubated at 25°C, 30°C, 35°C, and 40°C with shaking at 150 rpm for 48 h after inoculation of 100 μL of yeast cell suspension (1 × 10^9^ cells mL^−1^). A sterile McIlvaine buffer solution (pH 4) containing only PAT without yeast was used as a control.
To analyze the effect of initial PAT concentration, 5 mL of sterile McIlvaine buffer solution (pH 4) was spiked with 0.2, 0.5, 1, 2, and 3 μg mL^−1^ of PAT. After inoculation of 100 μL of yeast cell suspension (1 × 10^9^ cells mL^−1^), it was incubated at 35°C with shaking at 150 rpm for 48 h. A sterile McIlvaine buffer solution (pH 4) containing only PAT without yeast was used as a control. After centrifugation at 4000 rpm for 10 min, PAT was extracted from supernatant and the amount of PAT was analyzed by HPLC‐UVD as described above.
Mechanism of PAT Removal by R. ruineniae or M. guilliermondii
2.8
As described above, 5 mL of sterile McIlvaine buffer solution (pH 4) containing 1 μg mL^−1^ of PAT was incubated at 35°C with shaking at 150 rpm for 48 h after inoculation of 100 μL of yeast cell suspension (1 × 10^9^ cells mL^−1^). Then, after centrifugation at 4000 rpm for 10 min, PAT was extracted from supernatant and the level of PAT was analyzed by the procedure described above. Then, in order to test whether PAT was adsorbed onto yeast cell wall, two different methods were used as follows: (1) after the yeast cell pellet was washed twice with sterile DW and resuspended in a sterile McIlvaine buffer solution (pH 4), the yeast cells were disrupted by ultrasonication using a Ultrasonic processor (GE 50, GE Healthcare, Chicago, IL, USA) for 30 min at a 40% amplitude and a 20 kHz frequency. Next, yeast cell walls were precipitated by centrifugation at 4000 rpm for 10 min and washed twice with sterile DW. After the yeast cell wall was resuspended in 5 mL of sterile McIlvaine buffer solution (pH 4), PAT was extracted from the yeast cell wall suspension and the amount of PAT was analyzed as described above; (2) after the yeast cell pellet was washed twice with sterile DW, the yeast cells were ground under liquid N_2_ and the disrupted yeast cells were resuspended in sterile McIlvaine buffer solution (pH 4). Then, after centrifugation at 4000 rpm for 10 min, the yeast cell wall fraction was washed twice with sterile DW. Next, after the yeast cell walls were resuspended in 5 mL of sterile McIlvaine buffer solution (pH 4), PAT was extracted from the yeast cell wall suspension and the amount of PAT was analyzed by HPLC‐UVD as described above.
For PAT removal test using heat‐treated cells (dead cells), yeast cell suspension (1 × 10^9^ cells mL^−1^) was autoclaved at 121°C for 15 min. Then, 5 mL of sterile McIlvaine buffer solution (pH 4) containing 1 μg mL^−1^ of PAT was incubated at 35°C with shaking at 150 rpm for 48 h after inoculation of 100 μL of dead yeast cell suspension. A sterile McIlvaine buffer solution (pH 4) containing only PAT without yeast was used as a control. After centrifugation at 4000 rpm for 10 min, PAT was extracted from supernatant and the level of PAT was determined by HPLC‐UVD as described above.
For PAT removal test using yeast cell‐free filtrate, the cell‐free filtrate was prepared as follows. After 100 μL of yeast cell suspension (1 × 10^9^ cells mL^−1^) was inoculated into 5 mL of YPD medium (pH 4) or sterile McIlvaine buffer solution (pH 4), they were incubated at 35°C with shaking at 150 rpm for 48 h. Then, after centrifugation at 4°C and 4000 rpm for 10 min, 100 μL of supernatant from each culture was added to 5 mL of new YPD medium (pH 4) or sterile McIlvaine buffer solution (pH 4) containing 1 μg mL^−1^ of PAT, and they were incubated at 35°C with shaking at 150 rpm for 48 h. YPD medium (pH 4) and McIlvaine buffer solution (pH 4) without the yeast culture, which were spiked with 1 μg mL^−^ ^1^ of PAT, were used as controls after addition of YPD or McIlvaine buffer solution (100 μL). Finally, PAT was extracted from the samples and the amount of PAT was analyzed as described above.
For PAT removal test using yeast spheroplast, the spheroplast was prepared by treatment of yeast cell suspension containing 1 M sorbitol with lyticase (0.5 mg mL^−^ ^1^) at 37°C for 1 h. The spheroplast pellet was resuspended in 5 mL of sterile McIlvaine buffer solution (pH 4) containing 1 μg mL^−1^ of PAT after centrifugation at 4°C and 4000 rpm for 10 min. Then, the buffer solution (pH 4) containing 1 μg mL^−1^ of PAT was incubated at 35°C with shaking at 150 rpm for 48 h after inoculation of 100 μL of spheroplast suspension (1 × 10^9^ cells mL^−1^). After centrifugation at 4000 rpm for 10 min, PAT was extracted from supernatant and the level of PAT was determined by HPLC‐UVD as described above. Also, for identification of PAT degradation products, 5 mL of sterile McIlvaine buffer solution (pH 4) containing 5 μg mL^−1^ of PAT was used instead of the use of 1 μg mL^−1^ of PAT, and it was incubated at 35°C with shaking at 150 rpm for 0, 12, and 24 h after inoculation of the spheroplast suspension.
For PAT removal test using intracellular enzymes from yeast cells, the yeast cells, which had been cultured in YPD, were ground under liquid N_2_ as described above for isolation of yeast cell wall fractions. Then, after centrifugation at 4°C and 4000 rpm for 10 min, 100 μL of supernatant was added to 5 mL of sterile McIlvaine buffer solution (pH 5) containing 1 μg mL^−1^ of PAT, and they were incubated at 35°C with shaking at 150 rpm for 48 h. Next, PAT was extracted from the samples and the amount of PAT was analyzed as described above. For induction of PAT degradation enzymes by PAT, the yeast cells were cultured in YPD containing 1 μg mL^−1^ of PAT at 28°C with shaking at 150 rpm overnight. Then, PAT degradation analysis followed the same procedure as described above for PAT removal test using yeast spheroplast except the use of sterile McIlvaine buffer solution (pH 4) containing 5 μg mL^−1^ of PAT instead of 1 μg mL^−1^ of PAT.
LC/MS/MS Analysis
2.9
PAT degradation products were identified using liquid chromatography‐tandem mass spectrometry (LC/MS/MS). The LC/MS/MS analysis was performed using an Agilent 1290 Infinity UHPLC (Santa Clara, CA, USA), which was coupled to an Agilent 6545XT LC/Quadrupole Time‐of‐Flight (Q‐TOF) LC/MS equipped with a dual‐spray Agilent Jet Stream electrospray ionization source. Separation was carried out on an Agilent ZORBOX Eclipse Plus C18 column (2.1 mm × 100 mm, 1.8 μm particle size) with a mobile phase at a constant flow rate of 0.25 mL min^−1^. The mobile phase was an online mixture (solution A:solution B = 95:5 [v/v]) of solution A (0.1% formic acid containing 5 mM NH_4_ acetate) and solution B (100% methanol). Alternatively, 100% pure water was used as a solution A, whereas 100% ACN was used as a solution B. The injection volume of samples was 20 μL, while the column temperature was maintained at 30°C.
The MS spectrometer was operated in the negative electrospray ionization (ESI) mode, and the peak spectrum was obtained by the Find by Formula data‐mining algorithm. The main MS parameters were optimized and set as follows: mass range, 50–500 amu; scan rate, 1 spectra s^−1^; gas temperature, 325°C; gas flow rate, 6 L min^−1^; nebulizer gas pressure, 45 psi; sheath gas temperature, 350°C; sheath gas flow rate, 11 L min^−1^; capillary voltage, 3500 V; skimmer, 65 V; and octupole radiofrequency voltage, 750 V. Data processing were carried out using Agilent MassHinter Qualitative Analysis Software, rev. 10.0 (Santa Clara, CA, USA).
Statistical Analyses
2.10
Data were statistically analyzed by a one‐way analysis of variance (ANOVA), followed by Duncan's post hoc test, and expressed as the mean ± SD using SigmaStat software (Jandel Corporation, San Rafael, CA). A p value < 0.05 was considered statistically different.
Results and Discussion
3
Validation of the Analytical Method for Determination of PAT Using HPLC‐UVD
3.1
The analytical method for determination of PAT using HPLC‐UVD was validated for analytical parameters such as linearity, accuracy, precision, and sensitivity. The linearity of the calibration curve using five levels of PAT standard solutions was determined by linear regression analysis. The curve showed r ^ 2 ^ value of 0.997 (Appendix Figure A1). Therefore, it was concluded that the calibration curve was linear in the range of 0–2 μg mL^−1^ PAT.
The accuracy of the method was evaluated by the recovery of PAT extracted from McIlvaine buffer (citric acid‐Na_2_HPO_4_, pH 4) solution spiked with three levels of PAT standard solutions (0.2, 0.5, and 1 μg mL^−1^). The recovery for PAT in McIlvaine buffer (citric acid‐Na_2_HPO_4_, pH 4) solution was in the range of 89.18%–89.99% (Table 1). The recovery rates in all of the samples were higher than 75%, which is in good agreement with the recovery rates (75%–105%) recommended by Official Journal of the European Union (European Commission [EC] 2006). Hence, we concluded that the analytical method had good recoveries of PAT in McIlvaine buffer solution (pH 4).
The precision of the HPLC method was assessed by repeatability (within‐day precision). The RSDr obtained from extraction of PAT in McIlvaine buffer solution (pH 4) was in the range of 1.32%–3.37% (Table 1). They were consistent with the reference level (≤ 15%) recommended by Official Journal of the European Union (European Commission [EC] 2006). Thus, it was concluded that the analytical method showed good precision in determination of PAT in McIlvaine buffer solution (pH 4).
The sensitivity of the HPLC‐UVD method was determined by LOD and LOQ. The LOD and LOQ for PAT in McIlvaine buffer solution (pH 4) were 0.03 and 0.11 μg mL^−1^, respectively. Since they were as low as those for detection of trace amounts of PAT, we concluded that the method was highly sensitive for determination of PAT in McIlvaine buffer solution (pH 4). Figure 1 shows the representative chromatograms of PAT in standard solution and after extraction from McIlvaine buffer solution (pH 4). As shown in Figure 1, the PAT peak at 13.9 min was well separated from the interfering peaks at 5 and 5.5 min.
Chromatograms of PAT using HPLC‐UVD. Chromatograms of (A) PAT standard solution (1 μg mL−1) and of (B) PAT extracted from McIlvaine buffer solution (pH 4). The retention time (RT) of the PAT peak was 13.9 min.
Isolation of Yeast Strains From Peaches and Apples, and Identification of the Yeast Strains
3.2
A total of 6 and 10 yeasts were isolated from peaches and apples, respectively. Genetic identification based on ITS1‐5.8S rDNA‐ITS2 region on yeast rDNA was performed for all 16 isolated yeasts. The ITS plus 5.8S rDNA region was successfully amplified by PCR using yeast genomic DNA from all 16 yeast strains. BLASTn‐based analysis showed that sequence similarity of the yeast isolates to database in NCBI ranged from 93.45% to 99.83% (Table 2). The results exhibited that four types of yeast strains were isolated from peaches and apples, respectively, and that the yeast strains, which were isolated from peaches, were not found in those from apples and vice versa (Table 2). Of the six yeast strains isolated from peaches, R. ruineniae was the most predominant species (3 CFU and 50%), whereas Sporidiobolus pararoseus, Metschnikowia sp., and Kurtzmaniella quercitrusa were the rest of the strains (1 CFU and 16.7% for each). In contrast, of the 10 yeast strains isolated from apples, M. guilliermondii was the most prevalent species (5 CFU and 50%), followed by M. caribbica (2 CFU, 20%) and Rhodotorula mucilaginosa (R. mucilaginosa; 2 CFU, 20%), and Macalpinomyces spermophorus (1 CFU, 10%). When we further categorized the yeast strains, those from peaches belonged to two orders (Sporidiobolales and Saccharomycetales), whereas those from apples belonged to three orders (Saccharomycetales, Sporidiobolales, and Ustilaginales). These yeast strains, isolated from peaches and apples, differ slightly from those in previous studies (Janisiewicz et al. 2014; J. Wei et al. 2017; S. Zhu et al. 2023). One study reported that Aureobasidium pullulans was the most predominant species, followed by Hanseniaspora uvarum, Rhodotorula glutinis, Cryptococcus flavescens, and M. guilliermondii among yeast isolated from apples at 43 different sites in China (J. Wei et al. 2017). In particular, their study showed that geographical location was associated with the diversity of yeast genera isolated from apples. Also, Janisiewicz and co‐workers documented that Rhodotorula sp., Sporidiobolus sp., and Aureobasidium sp. constituted approximately 80% of all yeast isolated from plum (cultivars President and Stanley) in the United States, while Zhu and collaborators described that Aureobasidium sp., Hanseniaspora sp., Metschnikowia sp., Saccharomyces sp., Pichia sp., Rhodotorula sp., Sporobolomyces sp. were dominant species isolated from fruits, leaves, and flowers of peach trees (Amygdalus persica L. Compressa) (Janisiewicz et al. 2014; S. Zhu et al. 2023). In addition, one study from Slovenia reported that natural yeast flora on grape berries depends on different grape vine varieties as well as different geographical locations (Raspor et al. 2006). Thus, the discrepancy in our study may have been attributed to differences in geographical location and/or cultivars of peaches and apples. The phylogenetic tree based on ITS plus 5.8S rDNA sequences from eight isolates is shown in Figure 2.
Phylogenetic relationship based on sequences of ITS1‐5.8S rDNA‐ITS2 region from yeasts isolated from peaches and apples. The number in parentheses indicates GenBank accession number. The phylogenetic tree of 8 yeasts isolated from peaches and apples was constructed using the neighbor‐joining (NJ) method.
Selection of PAT Removal Yeast Strains
3.3
In order to compare PAT removal rates by the isolated yeast strains, a total of eight yeast strains from peaches and apples were cultured in YPD (pH 4) containing 1 μg mL^−1^ of PAT at 28°C for 48 h after selection of one yeast stain from several same strains. The PAT removal rates from the eight yeast strains ranged from 81.16% to 92.4% (Table 3). R. ruineniae, which was isolated from a peach, produced the highest PAT removal rate (92.4%), and it was followed by M. guilliermondii (91.69%), which was isolated from an apple. However, the difference between their rates was not statistically significant (p < 0.05). The control without yeast strains also showed 12.86% of PAT removal rates, which were in line with other studies (15.4% after incubation at 28°C for 24 h in Dong and collaborators' study, and 5%–7.7% at 25°C for 48 h in Reddy and co‐workers' study) (Dong et al. 2015; Reddy et al. 2011). In addition, biomass (OD at 600 nm) of the eight yeast strains was in the range of 0.15–0.42 (Table 3). M. guilliermondii showed the highest cell mass (0.42), indicating that it had strong tolerance to PAT, but R. ruineniae showed the medium level of cell mass (0.29). Thus, we selected R. ruineniae, which belongs to Sporidiobolales (Basidiomycota), and M. guilliermondii, which belongs to Saccharomycetales (Ascomycota), for further study.
PAT Removal Rates by R. ruineniae or M. guilliermondii Under Different Conditions
3.4
Since several parameters such as incubation time and temperature, and initial PAT concentration affect PAT removal rates, we investigated the effects of the different environmental factors on PAT removal rates by R. ruineniae and M. guilliermondii. When the two yeast strains were incubated in 5 mL of McIlvaine buffer solution (pH 4) containing 1 μg mL^−1^ of PAT over 72 h, PAT removal rates were similar between the yeast strains (Figure 3A). The rates in both strains reached the lower level than the regulatory limit (50 µg L^−1^) at 60 h and PAT was completely degraded (100%) at 72 h. To analyze the effect of incubation temperature on PAT removal rates by the two yeast strains, we incubated the yeast strains in 5 mL of McIlvaine buffer solution (pH 4) containing 1 μg mL^−1^ of PAT at four different temperature conditions (25°C, 30°C, 35°C, and 40°C) for 48 h. The PAT removal rates showed a similar pattern between R. ruineniae and M. guilliermondii. They were highest (93.8% in R. ruineniae and 91.98% in M. guilliermondii) at 35°C, followed by 30°C, 25°C, and 40°C (Figure 3B). These results were in agreement with those by Dong and co‐workers' study, in which a marine yeast strain Kodameae ohmeri (K. ohmeri) produced the highest PAT degradation rate (93%) at 35°C, followed by 30°C, 25°C, and 40°C after 20 h incubation (Dong et al. 2015). Another study reported that R. mucilaginosa had the highest PAT degradation rate (90%) after 21 h incubation, which is similar to our results (X. Li, Tang, et al. 2019). To assess the effect of initial PAT concentrations on PAT removal rates by the two yeast strains, they were incubated in 5 mL of McIlvaine buffer solution (pH 4) containing 0.2–3 μg mL^−1^ of PAT at 35°C for 48 h. With an increase in initial PAT concentrations, PAT removal rates in both yeast strains gradually decreased (Figure 3C). The rates in R. ruineniae and M. guilliermondii were 100% when 0.2 or 0.5 μg mL^−1^ of the initial PAT concentration was used, while they were 36.22% and 52.9%, respectively, when 3 μg mL^−1^ of the initial PAT concentration was used. Thus, our data showed that both yeast strains reduced the levels of PAT in buffer solutions in an incubation time and temperature‐ and initial PAT concentration‐dependent manner.
Effects of different environmental factors on PAT removal rates by R. ruineniae or M. guilliermondii in McIlvaine buffer solution (pH 4) containing PAT with shaking at 150 rpm. (A) Effect of incubation time on PAT removal rates in the buffer containing 1 μg mL‐1 of PAT at 35°C, (B) effect of incubation temperature on PAT removal rates in the buffer containing 1 μg mL‐1 of PAT after 48 h, and (C) effect of initial PAT concentration on PAT removal rates in the buffer containing different levels of PAT after 48 h at 35°C. The PAT removal rates were measured in triplicate. Data are expressed as the mean ± standard deviation (SD). The different number of the asterisk in the same group indicates statistically significant differences (p < 0.05).
Mechanism of PAT Removal by R. ruineniae or M. guilliermondii
3.5
Some previous studies reported that heat‐inactivated yeast strains using S. cerevisiae or Rhodosporidium paludigenum (R. paludigenum) had significant PAT removal rates, which were comparable to those by viable yeast cells (Chen et al. 2017; Guo et al. 2012; Yue et al. 2011; R. Zhu, Yu, et al. 2015). Thus, after autoclaving live yeast cells at 121°C for 15 min, we used the heat‐treated yeast cells (dead yeast cells) to compare their PAT removal rates with those by viable yeast cells. The viable yeast cells of R. ruineniae or M. guilliermondii showed 93.8% and 91.98% of PAT degradation rates, respectively, after 48 h incubation, whereas the heat‐treated yeast cells showed 11.68% and 10.13% of PAT degradation rates, which were not different from that of a control without yeast strains (8.4%) (Figure 4A). These results are consistent with those from several previous studies (Fu et al. 2021; Zheng et al. 2016). One previous study documented that heat‐inactivated M. guilliermondii did not reduce much PAT content (10% reduction) after 48 h incubation (Fu et al. 2021). Another study described that PAT removal rate by heat‐killed P. caribbica after 36 h culture was similar to that by a control without the yeast strain (30% reduction) (Zheng et al. 2016). However, our data are different from those of the other previous studies (Chen et al. 2017; Guo et al. 2012; Yue et al. 2011; R. Zhu, Yu, et al. 2015). Guo and co‐workers reported that there was no significant difference between PAT removal rates of heat‐inactivated yeast cells (51.71%) and viable cells (53.28%) after 24 h incubation (Guo et al. 2012). Other studies also showed 40%–60% of PAT degradation rates using heat‐inactivated yeast cells after 24 or 48 h incubation (Chen et al. 2017; Yue et al. 2011; R. Zhu, Yu, et al. 2015). This discrepancy may have resulted from the use of different yeast strains (S. cereviaise, R. paludigenum, and C. guilliermondii). Also, in Guo and co‐workers' study they described that most of the PAT removal was due to adsorption onto cell walls of activated or inactivated S. cereviaise (Guo et al. 2012). In our study, PAT removal by viable cells of R. ruineniae or M. guilliermondii could have resulted from physical adsorption of PAT onto yeast cell walls or degradation of PAT by the yeast strains. Thus, in order to isolate yeast cell walls, we disrupted yeast cells by ultrasonication or grinding under liquid N_2_ and isolated the yeast cell walls. After PAT extraction, HPLC‐UVD analysis showed that PAT was not detected from the cell walls and cytoplasms of both yeast strains, which were prepared by either method (Figures 4B and Appendix B1). It is in agreement with several other studies (Dong et al. 2015; Reddy et al. 2011). One study showed that no PAT was detected in the cell wall and cytoplasm of K. ohmeri, which were isolated by grinding under liquid N_2_ (Dong et al. 2015). Another study described that no detectable level of PAT was observed in the cell wall of Metschnikowia pulcherrima, which was isolated by ultrasonication (Reddy et al. 2011). Our data suggested that PAT was degraded by the yeast strains instead of binding of PAT onto yeast cell walls. Hence, we first investigated PAT removal rates by yeast cell‐free filtrates. However, the yeast cell‐free filtrates from yeast culture in YPD (pH 4) or McIlvaine buffer solution (pH 4) did not increase PAT removal rates in the media or buffer solution (pH 4) compared to the controls without cell‐free filtrates after 48 h incubation (Figure 4C). These results are consistent with several previous studies, which showed that extracellular filtrates of M. guilliermondii or R. paludigenum culture did not show any difference from PAT removal rate (approximately 10%) by a control without the yeast strain after 48 h culture and that cell‐free filtrates of C. guilliermondii produced the similar PAT removal rate (approximately 20%) to that by a control after 24 h incubation (Chen et al. 2017; Fu et al. 2021; R. Zhu, Feussner, et al. 2015). However, one study reported different results (Zheng et al. 2016). Zheng and collaborators described that cell‐free filtrates of P. caribbica reduced PAT level significantly (45% reduction) compared to a control without the yeast strain (25% reduction) after 24 h incubation (Zheng et al. 2016). Again, this result may have come from the use of different yeast strains. Nevertheless, our results indicated that the PAT degradation is an enzyme‐mediated mechanism inside yeast cells. Because our data suggested that PAT removal by both yeast strains was not due to either binding onto yeast cell walls or degradation by extracellular enzymes in cell‐free filtrates, we next analyzed PAT removal rates using yeast spheroplast, in which cell walls are deficient. In contrast to the results from the use of yeast cell walls or cell‐free filtrates, PAT removal rates by yeast spheroplast were 63.49% in R. ruineniae and 54.95% in M. guilliermondii (Figure 4D). It indicates that intracellular enzymes in yeast strains degraded PAT. Thus, to confirm PAT degradation by intracellular enzymes, we analyzed PAT removal rates using intracellular enzymes isolated from the yeast strains after cell disruption by grinding under liquid N_2_. The PAT removal rates using intracellular enzymes were approximately 1.3‐fold higher than those using spheroplast from both yeast strains (Figure 4D). These results are in line with those from some previous studies (Chen et al. 2017; Fu et al. 2021; M. Li et al. 2018). One previous study described that the PAT degradation process occurred inside C. guilliermondii cells (Chen et al. 2017). Another study showed that the protoplasts, in which cell walls are completely removed, of M. guilliermondii produced lower PAT removal rates than its viable cells after 48 or 60 h incubation (Fu et al. 2021). Moreover, Li and co‐workers reported that both intracellular and extracellular enzymes from S. cerevisiae CITCC 93161 were responsible for PAT degradation (M. Li et al. 2018).
PAT removal rates by different cell treatment or different cell fractions of R. ruineniae or M. guilliermondii after 48 h at 35°C with shaking at 150 rpm. (A) Heat‐treated or viable yeast cells, (B) yeast cell walls or cytoplasms isolated after cell disruption by ultrasonication, (C) yeast cell‐free filtrates in McIlvaine buffer solution (pH 4) or YPD (pH 4) after culture in either medium, and (D) yeast spheroplast and intracellular enzymes. The PAT removal rates were measured in triplicate. Data are expressed as the mean ± standard deviation (SD). The different number of the asterisk in the same group indicates statistically significant differences (p < 0.05).
Several previous studies documented that PAT degradation ability using yeast strains was induced by addition of PAT to culture media (Fu et al. 2021; Ianiri et al. 2017; Zheng et al. 2016; R. Zhu, Feussner, et al. 2015). Hence, we cultured R. ruineniae or M. guilliermondii in YPD containing 5 μg mL^−1^ of PAT and prepared spheroplasts of the yeast strains. Then, PAT degradation test was performed using the spheroplast of each strain. HPLC analysis showed that PAT degradation enzymes were not induced in R. ruineniae, whereas they were induced in M. guilliermondii (Figure 5A,B). The result on the induced PAT degradation ability in M. guilliermondii is consistent with those from previous studies (Fu et al. 2021; Ianiri et al. 2017; M. Li et al. 2018; Zheng et al. 2016; Zhu, Feussner, et al. 2015). In one study, Fu and collaborators described that the addition of PAT to culture media enhanced the PAT degradation ability of intracellular enzymes from M. guilliermondii (Fu et al. 2021). Other studies also reported that PAT‐degrading activities of intracellular enzymes from R. paludigenum, P. caribbica, or Sporobolomyces sp. were induced by addition of PAT to culture media (Ianiri et al. 2017; Zheng et al. 2016; R. Zhu, Feussner, et al. 2015). However, one previous study showed that the PAT degradation ability of intracellular enzymes from S. cerevisiae was not induced by culture media supplemented with PAT (M. Li et al. 2018), which is similar to that by R. ruineniae in our results.
PAT removal rates by spheroplast of R. ruineniae or M. guilliermondii after 48 h at 35°C with shaking at 150 rpm when the yeast strains were cultured in YPD supplemented with or without 1 μg mL‐1 of PAT. (A) Spheroplast of R. ruineniae and (B) spheroplast of M. guilliermondii. The PAT removal rates were measured in triplicate. Data are expressed as the mean ± standard deviation (SD). The different number of the asterisk in the same group indicates statistically significant differences (p < 0.05).
PAT Degradation Products by R. ruineniae or M. guilliermondii
3.6
In order to identify PAT degradation products after treatment with the spheroplasts of R. ruineniae or M. guilliermondii, time‐course experiments were performed. After 12 h incubation with the spheroplasts of R. ruineniae, a new peak appeared at 9.2 min, while the PAT peak at 13.9 min decreased (Figure 6A,B). As the incubation time increased to 24 h, the PAT peak decreased further, but the new peak became higher (Figure 6C). Moreover, treatment with the spheroplast of M. guilliermondii showed a similar pattern in HPLC chromatograms to that of R. ruineniae (Appendix Figure C1).
Time‐course HPLC chromatograms of McIlvaine buffer solution (pH 4) containing 5 μg mL‐1 of PAT when treated with spheroplast of R. ruineniae at 35°C with shaking at 150 rpm. (A) 0 h incubation, (B) 12 h incubation, and (C) 24 h incubation. The retention time (RT) of the PAT peak was 13.9 min, whereas that of E‐ascladiol peak was 9.2 min.
LC/MS/MS analysis detected not only [M‐H]^−^ precursor (m/z = 153.0193) at 5.693 min, which corresponds to PAT (molecular mass = 154.0266, C_7_H_6_O_4_) but also [M‐H]^−^ precursor (m/z = 155.0346) at 3.796 min in the same samples as those analyzed by HPLC‐UVD after they were treated with spheroplast of R. ruineniae (Figure 7A–E). It was revealed that the signal associated with the m/z 155.0346 at 3.796 min corresponds to (E)‐ or (Z)‐ascladiol with the formula C_7_H_8_O_4_ ([M‐H]^−^ precursor, theoretical m/z = 155.0352). Also, the LC/MS/MS analysis exhibited a similar pattern in M. guilliermondii to R. ruineniae. It showed [M‐H]^−^ precursor (m/z = 153.0192) at 4.372 min, which corresponds to PAT, and [M‐H]^−^ precursor (m/z = 155.0348) at 2.675 min, which corresponds to (E)‐ or (Z)‐ascladiol, in the same samples as those analyzed by HPLC‐UVD after they were treated with spheroplast of M. guilliermondii (Appendix Figure D1). In addition, the peak of (E)‐ or (Z)‐ascladiol appeared earlier than PAT peak in the HPLC chromatogram as shown in Figure 6. It is in good agreement with the results from several previous studies (Chen et al. 2017; Dong et al. 2015; M. Li et al. 2018; Moss and Long 2002; Yang et al. 2024). Some previous studies reported that S. cerevisiae degraded PAT to the less toxic product (E)‐ascladiol than the parent compound (M. Li et al. 2018; Moss and Long 2002; Yang et al. 2024). Other studies also documented that the major PAT degradation product is (E)‐ascladiol when K. ohmeri or C. guilliermondii was used (Chen et al. 2017; Dong et al. 2015). In particular, in Chen and co‐workers' study, the retention time (RT) of (E)‐ascladiol and PAT peaks was 6.0 and 10.2 min, respectively, when the mobile phase was 10% ACN in DW with a flow rate of 1 mL min^−1^ (Chen et al. 2017). Another previous study showed that the peak of (E)‐ascladiol (RT = 5.85 min) appeared first, followed by those of (Z)‐ascladiol (RT = 9.26 min) and PAT (RT = 9.92 min) when they were analyzed under the similar HPLC condition to that in Chen and co‐workers' study (Dong et al. 2015). Thus, in our study, we assume that the PAT degradation product by R. ruineniae or M. guilliermondii is (E)‐ascladiol (Figure 7E), an immediate precursor of PAT in the biosynthetic pathway (B. Li, Chen, et al. 2019).
Total and extracted ion chromatograms (TIC and EIC) and MS spectra of PAT and (E)‐ascladiol in McIlvaine buffer solution (pH 4) containing 5 μg mL−1 of PAT when treated with spheroplast of R. ruineniae for 24 h at 35°C with shaking at 150 rpm. (A) TIC, (B) PAT peak (RT = 4.372 min) in EIC, (C) MS spectrum for PAT, (D) (E)‐ascladiol peak (RT = 2.675 min) in EIC, (E) MS spectrum for (E)‐ascladiol, and (F) conversion of PAT to (E)‐ascladiol.
To date, two major products have been reported in degradation of PAT by yeast strains: (E)‐ or (Z)‐ascladiol (two different isomers) and desoxypatulinic acid (McCormick 2013). In three previous studies, the authors showed that Rhodosporidium kratochvilovae (R. kratochvilovae), R. paludigenum, or R. mucilaginosa converted PAT to another less toxic product, desoxypatulinic acid, whose peak appeared later than PAT peak in the HPLC chromatogram (Castoria et al. 2011; X. Li, Tang, et al. 2019; R. Zhu, Feussner, et al. 2015). Furthermore, two previous studies documented that a yeast strain converted PAT into two different degradation products (ascladiol and desoxypatulinic acid) (Ianiri et al. 2013; Zhang et al. 2025). One study described that K. marxianus XZ1 was able to degrade PAT to produce both types of the PAT degradation products (Zhang et al. 2025). Ianiri and collaborators also showed the similar results to the study, in which Sporobolomyces sp. strain IAM 13481 converted PAT to form both types of the PAT breakdown products (Ianiri et al. 2013). In their study, the peak of (E)‐ or (Z)‐ascladiol appeared earlier than PAT peak in the HPLC chromatogram, while the peak of desoxypatulinic acid appeared later than the PAT peak in the chromatogram when the mobile phase was 5% methanol in acidified DW containing 1% acetic acid with a flow rate of 1 mL min^−1^.
PAT contamination on pome fruits such as apples and peaches is a serious health risk worldwide (Mahato et al. 2021; Moake et al. 2005). Development of PAT biodegradation strategies using microorganisms has received considerable attention. In this study, we isolated R. ruineniae and M. guilliermondii as PAT‐degrading yeast strains from a peach and an apple, respectively, and investigated the mechanism involved in PAT degradation and the major biodegradation product. Our data showed that several parameters such as incubation time and temperature, and also initial PAT concentration had significant effects on PAT degradation rate in both yeast strains. Both yeast strains were able to degrade 1 μg mL^−1^ of PAT to below the regulatory limit (50 µg L^−1^) at 60 h when they were incubated at 35°C. In addition, PAT was not detected from yeast cell walls of R. ruineniae or M. guilliermondii, whereas it was degraded by spheroplast or intracellular enzyme fractions of the yeast strains. It indicates that PAT was not adsorbed onto the yeast cell walls, but PAT degradation occurred by intracellular enzymes of the yeast strains. Also, PAT degradation ability of intracellular enzymes from M. guilliermondii was induced by addition of PAT to culture media. Furthermore, LC/MS/MS analysis showed that (E)‐ascladiol is a major PAT biodegradation product by spheroplast of R. ruineniae or M. guilliermondii.
Interestingly, Iarniri and co‐workers described that the production of desoxypatulinic acid has been found in the Pucciniomycotina of basidiomycetes to which red yeasts such as Rhodosporidium sp. and Rhodotorula sp. belong, while the ascomycete S. cerevisiae, P. caribbica, or C. guilliermondii converts PAT to ascladiol as a major degradation product (Ianiri et al. 2016, 2017). To the best of our knowledge, this is the first report on PAT biodegradation using R. ruineniae and production of (E)‐ascladiol by the red yeast.
PAT contamination of apples and apple‐based products is a worldwide issue. High PAT levels, which exceed the maximum regulatory limit (50 µg kg^−1^), were detected in apples and apple juice from China, Spain, and Pakistan (Zhong et al. 2018). Since apples are frequently contaminated with PAT, which is produced by infected fungi such as Penicillium expansum, during postharvest storage, crude protein extracts of R. ruineniae and M. guilliermondii, which were isolated as PAT‐degrading yeast strains in this study, could be utilized for PAT decontamination of the stored fruits by spraying them onto the fruits in the future.
Conclusion
4
In summary, our data demonstrated that R. ruineniae and M. guilliermondii isolated from a peach and an apple, respectively, were able to degrade PAT and that their spheroplast formed (E)‐ascladiol as the sole breakdown product. In addition, it showed that PAT degradation rates by each yeast strain were significantly influenced by incubation time and temperature, and initial PAT concentration. Future studies will reveal the enzymes involved in PAT biodegradation and the detailed mechanisms for conversion of PAT to (E)‐ascladiol by the yeast strains. Furthermore, the potential application of the crude protein extracts from R. ruineniae and M. guilliermondii to apples could be helpful for PAT decontamination of the fruits.
Author Contributions
Yidan Ji: investigation (lead), formal analysis (lead), writing – review and editing (equal). Sung‐Yong Hong: conceptualization (equal), formal analysis (lead), writing – original draft (lead), writing – review and editing (equal), supervision (equal). Jinhuan Qu: investigation (supporting), formal analysis (supporting), writing – review and editing (equal). Qing Chu: investigation (supporting), formal analysis (supporting), writing – review and editing (equal). Shuxian Ma: investigation (supporting), formal analysis (supporting), writing – review and editing (equal). Ae‐Son Om: conceptualization (equal), writing – review and editing (equal), supervision (equal), funding acquisition.
Funding
This study was supported by the research program (Development of data application technology for postharvest management of the agricultural and livestock products; Project No. RS‐2022‐RD010281) from Rural Development Administration, Korea.
Ethics Statement
The authors have nothing to report.
Conflicts of Interest
The authors have nothing to report.
The reference list from the paper itself. Each links out to its DOI / PubMed record.
- 1Amberg, D. C. , D. J. Burke , and J. N. Strathern . 2005. Methods in Yeast Genetics. Cold Spring Harbor Laboratory Press.
- 2AOAC International . 2000. “Official Method 995.10.” In Official Methods of Analysis of AOAC International. AOAC International.
- 3Castoria, R. , L. Mannina , R. Durán‐Patrón , et al. 2011. “Conversion of the Mycotoxin Patulin to the Less Toxic Desoxypatulinic Acid by the Biocontrol Yeast Rhodosporidium kratochvilovae Strain LS 11.” Journal of Agricultural and Food Chemistry 59, no. 21: 11571–11578. 10.1021/jf 203098 v.21928828 · doi ↗ · pubmed ↗
- 4Chen, Y. , H. M. Peng , X. Wang , B. Q. Li , M. Y. Long , and S. P. Tian . 2017. “Biodegradation Mechanisms of Patulin in Candida guilliermondii: An i TRAQ‐Based Proteomic Analysis.” Toxins 9, no. 2: 48. 10.3390/toxins 9020048.28208714 PMC 5331428 · doi ↗ · pubmed ↗
- 5Codex Alimentarius Commission (CAC) . 2003. Code of Practice for the Prevention and Reduction of Patulin Contamination in Apple Juice and Apple Juice Ingredients in Other Beverages.
- 6Dong, X. , W. Jiang , C. Li , N. Ma , Y. Xu , and X. Meng . 2015. “Patulin Biodegradation by Marine Yeast Kodameae ohmeri .” Food Additives & Contaminants, Part A: Chemistry, Analysis, Control, Exposure & Risk Assessment 32, no. 3: 352–360. 10.1080/19440049.2015.1007090.25585640 · doi ↗ · pubmed ↗
- 7European Commision (EC) . 2023. Commission Regulation (EU) 2023/915 of 25 April 2023 on Maximum Levels for Certain Contaminants in Food and Repealing Regulation (EC) No. 1881/2006. Official Journal of the European Union, L 119, 103‐157.
- 8European Commission (EC) . 2006. Commission Regulation (EC) No. 401/2006 of 23 February 2006 Laying Down the Methods of Sampling and Analysis for the Official Control of the Levels of Mycotoxins in Foodstuffs. Official Journal of the European Union, L 70.