Prognostic relevance of persistent haematuria in patients with lupus nephritis
Xuan Chen, Lin-Lin Li, Na Li, Pei Wang, Hui-Xia Cao

TL;DR
Persistent haematuria in lupus nephritis patients is linked to worse outcomes, including higher risk of death and need for kidney replacement therapy.
Contribution
This study identifies persistent haematuria as an independent predictor of adverse outcomes in lupus nephritis.
Findings
Persistent haematuria was present in 37.1% of lupus nephritis patients.
Patients with persistent haematuria had significantly higher risk of adverse outcomes.
The risk effect of persistent haematuria increased over time.
Abstract
This study aimed to investigate the significance of persistent haematuria in lupus nephritis (LN). A total of 178 patients with LN were enrolled and regularly followed up from December 2016 to September 2022. Follow-up duration was from LN diagnosis to the patient’s latest visit or terminated at the onset of endpoint events if they occurred. Their clinical and laboratory data as well as outcomes were monitored and analysed from the enrolment point until the final visit. A total of 138 of 178 (77.5%) patients with LN presented with haematuria at the initial diagnosis. During follow-up, 34 patients (19.1%) had no haematuria, 72 (40.4%) patients initially diagnosed but later resolved and 66 (37.1%) exhibited persistent haematuria. Furthermore, patients with persistent haematuria showed higher Systemic Lupus Erythematosus Disease Activity Index scores (12.3 ± 2.9 versus 10.7 ± 3.6; P =…
Genes, proteins, chemicals, diseases, species, mutations and cell lines named across the full text — each resolved to its canonical identifier and authoritative record.
Click any figure to enlarge with its caption.
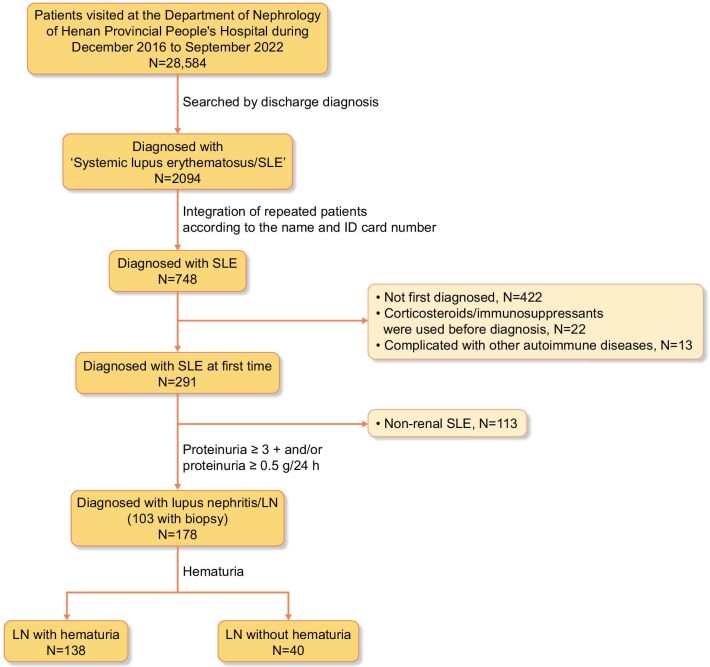 Figure 1
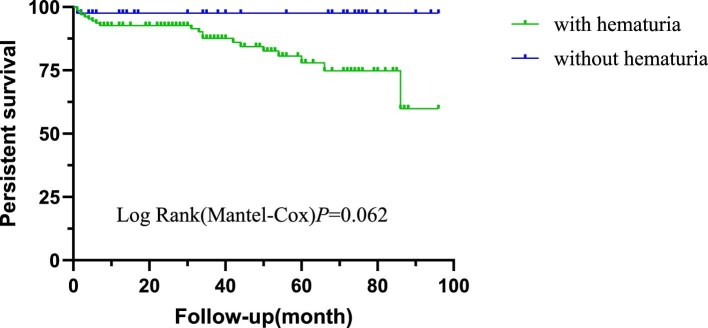 Figure 2
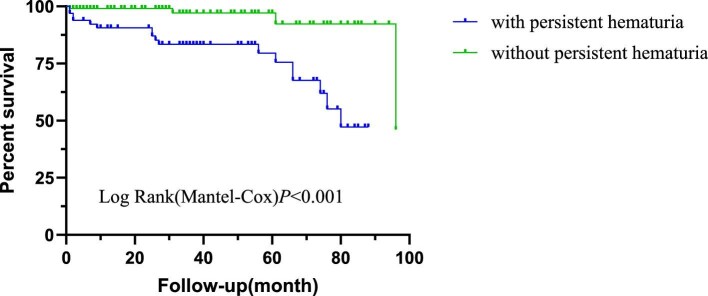 Figure 3
| Characteristics | LN ( | LN without haematuria ( | LN with haematuria |
|
|---|---|---|---|---|
| Clinical evaluation | ||||
| Sex (male/female), | 35/143 | 6/34 | 29/109 | .399 |
| Age (years), mean ± SD | 37 ± 15 | 36.8 ± 13.9 | 37.1 ± 14.8 | .907 |
| SLEDAI (non-renal), median (IQR) | 2.0 (0–4.0) | 2.0 (1.0–4.0) | 2.0 (0–4.0) | .638 |
| SLEDAI, mean ± SD | 11.2 ± 3.5 | 7.9 ± 3.2 | 12.1 ± 2.9 | <.001 |
| Fever (non-infectious), | 47 (26) | 12 (30) | 35 (25) | .558 |
| Malar rash, | 49 (28) | 13 (33) | 36 (26) | .424 |
| Photosensitivity, | 25 (14) | 7 (18) | 18 (13) | .475 |
| Oral ulcer, | 3 (2) | 1 (3) | 2 (1) | .536 |
| Alopecia, | 6 (3) | 2 (5) | 4 (3) | .618 |
| Arthralgia, n (%) | 38 (21) | 11 (28) | 27 (20) | .281 |
| Serositis, | 32 (18) | 4 (10) | 28 (20) | .136 |
| Neurologic disorder, | 5 (3) | 2 (5) | 4 (3) | >.999 |
| AKI, | 32 (18) | 2 (5) | 30 (22) | .015 |
| Laboratory assessment | ||||
| Proteinuria, | 178 (100) | 36 (90) | 132 (96) | .235 |
| Leukocyturia (non-infection), | 59 (33) | 7 (18) | 52 (38) | .017 |
| Haemoglobin (g/l), mean ± SD | 98.6 ± 23.1 | 107.7 ± 19.5 | 97.7 ± 24.1 | .334 |
| Platelets, mean ± SD | 162.9 ± 80.1 | 191.7 ± 76.2 | 154.4 ± 79.5 | .010 |
| Total protein (g/l), mean ± SD | 56.5 ± 13.3 | 60.2 ± 12.6 | 55.4 ± 13.4 | .043 |
| Albumin (g/l), mean ± SD | 26.5 ± 7.4 | 29.8 ± 6.7 | 25.6 ± 7.4 | .002 |
| Globulin (g/l), mean ± SD | 29.7 ± 8.1 | 31.4 ± 6.3 | 29.2 ± 8.5 | .124 |
| BUN (mmol/l), median (IQR) | 6.8 (4.8–10.4) | 4.9 (3.5–6.1) | 7.4 (5.3–11.2) | <.001 |
| SCr (μmol/l), median (IQR) | 69.5 (51.0–99.0) | 51.5 (42.3–58.8) | 75.5 (57.8–110.3) | <.001 |
| Urine protein (g/24 h), median (IQR) | 2.8 (1.3–5.8) | 1.5 (0.7–3.8) | 3.1 (1.6–6.0) | .002 |
| IgA (g/l), median (IQR) | 2.7 (1.9–3.5) | 2.7 (2.0–3.9) | 2.7 (1.9–3.5) | .428 |
| IgG (g/l), mean ± SD | 14.3 ± 6.8 | 14.8 ± 5.8 | 14.1 ± 7.1 | .560 |
| IgM (g/l), median (IQR) | 1.1 (0.7–1.5) | 1.04 (0.62–1.54) | 1.05 (0.68–1.47) | .911 |
| C3 (g/l), median (IQR) | 0.4 (0.3–0.6) | 0.6 (0.4–0.8) | 0.4 (0.3–0.6) | <.001 |
| C4 (g/l), median (IQR) | 0.1 (0–0.1) | 0.1 (0–0.2) | 0.1 (0–0.1) | .018 |
| CRP (mg/l), mean ± SD | 2.6 (0.5–6.7) | 2.2 (0.5–7.5) | 2.7 (0.5–6.0) | .934 |
| ESR (mm/h), mean ± SD | 36.3 ± 23.2 | 37.1 ± 18.37 | 36.1 ± 24.6 | .873 |
| Anti-U1RNP antibody positive, | 82 (46.1) | 15 (38) | 67 (49) | .276 |
| Anti-Smith antibody positive, | 66 (37) | 14 (35) | 52 (38) | .701 |
| Anti-dsDNA antibody positive, | 46 (26) | 7 (18) | 39 (28) | .266 |
| Anti-SSA antibody positive, | 88 (49.4) | 22 (55) | 66 (48) | .475 |
| Anti-SSB antibody positive, | 25 (14) | 5 (13) | 20 (15) | .705 |
| Adverse outcomes, | 21 (11.8) | 20 (14.5) | 1 (2.5) | .049 |
| Characteristics | LN with persistent haematuria ( | LN without persistent haematuria ( |
|
|---|---|---|---|
| Clinical evaluation | |||
| Sex (male/female), | 17/49 | 17/89 | .120 |
| Age (years), mean ± SD | 38.26 ± 17.15 | 36.78 ± 12.96 | .550 |
| SLEDAI (non-renal), median (IQR) | 2.0 (0–4.0) | 2.0 (0–4.0) | .511 |
| SLEDAI, mean ± SD | 12.3 ± 2.9 | 10.7 ± 3.6 | .002 |
| Fever (non-infectious), | 13 (20) | 30 (28) | .205 |
| Malar rash, | 15 (23) | 31 (29) | .348 |
| Photosensitivity, | 9 (14) | 14 (13) | .936 |
| Oral ulcer, | 0 (0) | 3 (3) | .286 |
| Alopecia, | 2 (3) | 4 (4) | >.999 |
| Arthralgia, | 12 (18) | 24 (23) | .484 |
| Serositis, | 16 (24) | 16 (15) | .134 |
| Neurologic disorder, | 2 (3) | 3 (3) | >.999 |
| AKI, | 16 (24) | 16 (15) | .134 |
| Laboratory assessment | |||
| Haemoglobin (g/l), mean ± SD | 92.7 ± 25.4 | 102.0 ± 21.1 | .010 |
| Platelets, mean ± SD | 146.2 ± 75.2 | 170.0 ± 81.4 | .057 |
| Total protein (g/l), mean ± SD | 54.2 ± 14.1 | 57.7 ± 12.9 | .098 |
| Albumin (g/l), mean ± SD | 24.9 ± 6.8 | 27.5 ± 7.6 | .024 |
| Globulin (g/l), mean ± SD | 28.1 ± 8.9 | 30.6 ± 7.6 | .051 |
| BUN (mmol/l), median (IQR) | 8.9 (6.7–14.8) | 5.7 (4.4–8.8) | <.001 |
| SCr (μmol/l), median (IQR) | 90.0 (64.5–132.3) | 62.0 (48.0,80.0) | <.001 |
| Urine protein (g/24 h), median (IQR) | 3.44 (2.02–7.23) | 2.60 (0.95–5.60) | .008 |
| IgA (g/l), median (IQR) | 2.5 (1.8–3.3) | 2.7 (2.0–3.7) | .267 |
| IgG (g/l), mean ± SD | 13.8 ± 6.8 | 14.5 ± 6.94 | .518 |
| IgM (g/l), median (IQR) | 1.1 (0.7–1.4) | 1.0 (0.7–1.5) | .582 |
| C3 (g/l), median (IQR) | 0.4 (0.3–0.5) | 0.5 (0.3–0.6) | .009 |
| C4 (g/l), median (IQR) | 0.1 (0–0.1) | 0.1 (0–0.1) | .122 |
| Anti-Smith antibody positive, | 20 (30) | 45 (43) | .108 |
| Anti-dsDNA antibody positive, | 20 (30) | 25 (24) | .290 |
| Adverse outcomes, | 17 (25.8) | 4 (3.6) | <.001 |
| Treatments | LN ( | LN with persistent haematuria ( | LN without persistent haematuria ( | CYC group ( |
|---|---|---|---|---|
| Induction therapy | ||||
| G + HCQ, | 32 (18.0) | 7 (10.6) | 24 (22.6) | |
| G + HCQ + MMF, | 62 (34.8) | 30 (45.5) | 30 (28.3) | |
| G + HCQ + CYC, | 76 (42.7) | 25 (37.9) | 49 (46.2) | |
| G + HCQ + TAC, | 5 (2.8) | 2 (3) | 3 (2.8) | |
| G + HCQ + MMF + TAC, | 3 (1.7) | 2 (3) | 0 (0) | |
| Maintenance therapy | ||||
| G + HCQ, | 32 (18.0) | 7 (10.6) | 24 (22.6) | |
| G + HCQ + MMF, | 146 (82) | 59 (89.4) | 82 (77.4) | |
| CYC-associated outcomes | ||||
| Initial haematuria, | 138 (77.5) | 66 (100) | 72 (67.9) | 64 (84.2) versus 74 (72.5); χ2 = 3.40; |
| Persistent haematuria, | 66 (37.1) | 66 (100) | 0 (0) | 25 (32.9) versus 41 (40.2); χ2 = 1.00, |
| Adverse outcomes, | 21 (11.8) | 17 (25.8) | 4 (3.6) | 8 (10.5) versus 13 (12.7); χ2 = 0.21, |
| Univariable logistic regression | Multivariable logistic regression | |||
|---|---|---|---|---|
| Variables | OR (95% CI) |
| aOR (95% CI) |
|
| Sex (male versus female) | 0.55 (0.26–1.17) | .119 | ||
| Age (per 1 year) | 1.01 (0.99–1.03) | .400 | ||
| SLEDAI | 1.17 (1.06–1.28) | .001 | 1.09 (0.97–1.23) | .137 |
| C3 | 0.09 (0.02–0.42) | .002 | 0.16 (0.03–0.90) | .037 |
| Anti-dsDNA antibody (yes versus no) | 1.48 (0.74–2.97) | .270 | ||
| Urine protein (per 1 g/24 h) | 1.06 (0.98–1.15) | .138 | ||
| SCr (per 1 mg/dl increase) | 1.73 (1.51–2.60) | .008 | 1.62 (1.04–2.54) | .035 |
| AKI (yes versus no) | 1.92 (0.89–4.16) | .098 | 0.87 (0.33–2.25) | .768 |
| Leukocyturia (non-infection) (yes versus no) | 1.93 (1.02–3.65) | .045 | 1.39 (0.63–3.06) | .417 |
| Bivariate analysis | Multivariable analysis | ||||
|---|---|---|---|---|---|
| Variables | HR (95% CI) |
| Adjusted HR (95% CI) |
| β |
| Age (per year) | 1.03 (1.00–1.06) | .064 | 1.02 (0.99–1.06) | .166 | 0.024 |
| SCR (per 1 mg/dl increase) | 1.42 (1.25–1.61) | <.001 | 1.20 (0.97–1.48) | .090 | 0.181 |
| Urine protein (per 1 g/24 h) | 1.02 (0.91–1.15) | .738 | 0.97 (0.82–1.16) | .744 | −0.029 |
| C3 (per 1 g/l) | 0.41 (0.06–2.93) | .373 | 1.24 (0.06–24.12) | .888 | 0.214 |
| Haemoglobin (per 1 g/l) | 0.98 (0.97–0.99) | .006 | 0.99 (0.97–1.01) | .345 | −0.010 |
| CRP (per 1 mg/l) | 1.02 (1.01–1.04) | <.001 | 1.02 (1.00–1.04) | .016 | 0.019 |
| Leukocyturia (non-infection) (yes versus no) | 2.44 (1.03–5.75) | .042 | 1.63 (0.58–4.60) | .359 | 0.486 |
| AKI (yes versus no) | 3.26 (1.34–7.93) | .009 | 2.34 (0.62–8.94) | .212 | 0.852 |
| Immunosuppressive regimens | 0.93 (0.27–3.16) | .907 | 1.27 (0.22–7.23) | .785 | 0.242 |
| Persistent haematuria (yes versus no) | 8.83 (2.96–26.35) | <.001 | 0.45 (0.04–5.65) | .536 | −0.800 |
| Persistent haematuria (time-dependent variable) | 3.40 (1.06–10.90) | .039 | 1.224 | ||
| Bivariate analysis | Multivariable analysis | |||
|---|---|---|---|---|
| Variables | HR (95% CI) |
| Adjusted HR (95% CI) |
|
| Age (per year) | 1.05 (1.01–1.10) | .014 | 1.06 (1.02–1.10) | .005 |
| SCr (per 1 mg/dl increase) | 2.07 (1.36–3.14) | .001 | 1.85 (1.09–3.15) | .024 |
| Urine protein (per 1 g/24 h) | 1.05 (0.92–1.21) | .465 | 1.03 (0.89–1.20) | .677 |
| Low C3 (yes versus no) | 1.88 (0.24–14.74) | .546 | 0.22 (0.02–2.82) | .243 |
| Pathological classification (proliferative versus non-proliferative) | 51.11 (0.37–7074.52) | .118 | ||
| Persistent haematuria (yes versus no) | 17.47 (2.22–137.23) | .792 | 9.32 (1.05–82.65) | .045 |
- —Key Research and Development Program of Hunan Province of China10.13039/501100019091
- —Youth Science Foundation of Henan Province
Peer Reviews
No public reviews on file for this paper yet. If you reviewed it on a platform where reviews are public (OpenReview, ICLR, NeurIPS, ICML), you can paste yours below so the community can read it here.
Videos
No videos yet. Explain this paper in a talk, walkthrough, or lecture? Add one.
Taxonomy
TopicsRenal Diseases and Glomerulopathies · Vasculitis and related conditions · Renal and Vascular Pathologies
INTRODUCTION
Systemic lupus erythematosus (SLE) is an autoimmune disease characterized by multisystem involvement, with ≈30–60% of patients developing lupus nephritis (LN) during disease progression [1]. While modern immunosuppressive therapy has significantly improved short-term outcomes, studies demonstrate that nearly10–50% of LN patients progress to chronic kidney disease (CKD), with long-term follow-up data revealing 5-year and 10-year end-stage renal disease (ESRD) incidence rates of 3–11% and 16–19%, respectively, in these patients [2, 3]. The development of CKD and ESRD not only substantially increases mortality risk but also exacerbates complication burden, presenting significant challenges for clinical management [4].
Haematuria serves as a common diagnostic indicator for identifying patients with proliferative glomerulonephritis. Moreover, emerging evidence indicates that persistent haematuria independently predicts critical prognostic value in various forms of glomerulonephritis, including immunoglobulin A nephropathy (IgAN), anti-neutrophil cytoplasmic antibody (ANCA)-associated vasculitis (AAV) and primary membranous nephropathy (PMN) [5–8]. Similar findings have been observed in LN, with acanthocytes identified as the optimal biomarker for predicting proliferative LN [area under the curve (AUC) = 0.743] [9]. Moreover, acanthocyte levels also exhibited strong correlations with both the activity index and chronicity index in renal biopsies. Additionally, another study established that a dysmorphic erythrocyte proportion >40% in urinary sediment effectively distinguished proliferative from non-proliferative LN, demonstrating high sensitivity (91.2%) and specificity (79.17%) [10]. Notably, while the majority of patients manifesting isolated haematuria and/or pyuria exhibit demonstrable renal or extrarenal SLE disease activity during initial clinical assessment or within the peri-evaluation period, active urinary sediment components (particularly haematuria) lack sufficient sensitivity and specificity to serve as reliable biomarkers for either LN flare or its severity, warranting further investigation to elucidate their definitive clinical relevance [11, 12].
In current clinical practice, LN monitoring predominantly focuses on proteinuria and renal function. However, a prospective cohort study revealed that even among LN patients achieving sustained clinical remission, 55.3% experienced disease recurrence after a median follow-up of 3.6 years while the role of persistent haematuria in this process remains incompletely elucidated [13]. Accordingly, this study aims to investigate, within a large Chinese cohort of LN patients, whether persistent microscopic haematuria during follow-up can independently predict adverse outcomes—including death, ESRD or doubling of serum creatinine—in initially diagnosed LN patients who have achieved clinical remission with stable conventional indicators such as proteinuria and renal function. The objective is to provide evidence for optimizing long-term LN monitoring and risk stratification strategies.
MATERIALS AND METHODS
Patients
This is a retrospective study of patients with SLE/LN; the flow chart is shown in Fig. 1. A total of 748 patients with SLE were enrolled in Henan Provincial People’s Hospital from December 2016 to September 2022. They all fulfilled the 2019 European League Against Rheumatism/American College of Rheumatology classification criteria for SLE [14]. Considering the influences of glucocorticoids, immunosuppressants and other drugs, 422 patients were previously diagnosed with LN, 22 had medical treatment before diagnosis and 13 cases were complicated with other autoimmune diseases (e.g. rheumatoid arthritis, IgA nephritis, ANCA-associated vasculitis) were excluded. Among the initially identified patients, 291 were confirmed as newly diagnosed with SLE. Following the exclusion of 113 patients with non-renal SLE, 178 patients with complete clinical and laboratory data who were newly diagnosed with LN—defined by proteinuria ≥3+ and/or proteinuria ≥0.5 g/24 h—were ultimately enrolled, among which 103 cases had a renal biopsy.
Enrolment of LN patients from the Henan Provincial People’s Hospital.
The research was in compliance of the Declaration of Helsinki and approved by the local ethical committees of Henan Provincial People’s Hospital [no. 2019(12)]. Written informed consents were obtained from all enrolled individuals.
Clinical and pathological index
The following data were collected and analysed: age, gender, fever (non-infectious), malar rash, photosensitivity, oral ulcer, alopecia, arthralgia, serositis, neurologic disorder, anaemia, acute kidney injury (AKI), nephrotic syndrome, leukocytopenia, thrombocytopenia, haematuria and leukocyturia. Clinical SLE disease activity was assessed using the Systemic Lupus Erythematosus Disease Activity Index 2000 (SLEDAI-2K) [15]. Serum anti-nuclear antibodies (ANAs), anti-double-stranded DNA (dsDNA) antibodies and serum C3 and C4 levels were determined at every visit during follow-up. The estimated glomerular filtration rate (eGFR) was obtained using the Chronic Kidney Disease Epidemiology Collaboration two-level race equation. Treatment regimens, including both induction and maintenance therapies, were collected for a cohort of 178 patients with LN. Haematuria was defined as red blood cells (RBCs) >5 per high-power field (HPF). Persistent haematuria was defined as the presence of >5 RBCs per HPF in urinary sediment on two or more consecutive follow-up visits during the observation period (from LN diagnosis to the last follow-up or endpoint event onset). AKI was diagnosed in accordance with the criteria outlined in the 2012 Clinical Practice Guideline for Acute Kidney Injury issued by the Kidney Disease: Improving Global Outcomes (KDIGO) [16]. Per this guideline, AKI is identified if any of the following three conditions are satisfied within a 7-day window: a rapid increase in serum creatinine (SCr) of ≥0.3 mg/dl (equivalent to ≥26.5 μmol/l) occurring within 48 h, an elevation of SCr to ≥1.5 times the patient’s baseline SCr level or a reduction in urine output to <0.5 ml/kg of body weight/h, sustained for at least 6 h.
The renal biopsy specimens were examined by light microscopy and immunofluorescence. They were all classified according to the International Society of Nephrology and Renal Pathology Society 2018 classification. The pathological parameters, including activity indices and chronicity indices, were assessed by semi-quantitative scoring as previously [17]. In this study, pathological types were categorized into two groups: proliferative lupus nephritis, comprising classes III, IV, III + V and IV + V; and non-proliferative LN, including class II and pure class V (without concurrent class III or IV lesions).
The patients were regularly followed up in outpatient lupus clinics specified for LN patients or by telephone. The primary endpoint was defined as death (for any causes), the secondary endpoint was defined as ESRD or doubling of SCr and a composite endpoint consisted of the primary and secondary endpoints.
Statistical analysis
SPSS 26.0 (IBM, Armonk, NY, USA) was used for statistical analysis. Quantitative data were expressed as mean ± standard deviation (SD) or median [interquartile range (IQR)]. For continuous variables, the unpaired t-test and Mann–Whitney U test were used for comparison of continuous data. For categorical variables, the chi-squared or Fisher’s exact test was used. Univariable and multivariate logistic regression analyses were performed to identify independent determinants of persistent haematuria during disease flares. Kaplan–Meier curves were used to analyse patients’ prognoses. Survival analysis using univariate and multivariable Cox regression was performed to test the association and a composite event. P-values <.05 were considered statistically significant. Confidence intervals (CIs) included 95% of predicted values. All Cox models were verified for proportional hazards (PH) assumptions using Schoenfeld residuals. Standard Cox models were applied when PH assumptions were satisfied; otherwise, non-compliant variables were incorporated as stratification factors or time-dependent Cox models were employed. Analyses included the full cohort (n = 178), adjusted for age, baseline creatinine, proteinuria, C3, haemoglobin, C-reactive protein (CRP), non-infectious leukocyturia, AKI and immunosuppressive regimens; and the biopsy-confirmed subgroup (n = 103), adjusted for age, baseline SCr, proteinuria, low C3 and pathological classification.
RESULTS
Baseline characteristics of the overall cohort (n = 178)
A total of 178 patients with LN were enrolled and regularly followed up. The clinical and laboratory characteristics are presented in Table 1. The cohort exhibited a male:female ratio of 1:4 (35 males:143 females) and a predominance of females (80.3%). The mean age of the participants was 37 ± 15 years. The use of immunosuppressants among the 178 patients with LN, including both induction and maintenance treatment regimens, is presented in Table 3. Among these patients, 103 cases underwent a kidney biopsy and histopathological classifications revealed class II [8 (7.8%)], class III [4 (3.9%)], class IV [26 (25.2%)], class V [35 (34.0%)], class III + V [14 (13.6%)] and class IV + V [16 (15.5%)]. The median follow-up time was 34.0 months (IQR 7.8–59.3). During the disease course, 9 patients died and 12 patients reached the secondary endpoint, including 6 with ESRD and 6 with doubling of SCr.
Comparative analysis of haematuria-associated clinical features
Clinical and laboratory characteristics between patients with and without initial haematuria
All participants were categorized into two groups based on the presence of haematuria (positive versus negative) at the initial diagnosis. A total of 138 patients were classified into the haematuria group and 40 were classified into the non-haematuria group (shown in Fig. 1). Compared with patients without haematuria at the initial diagnosis, those with haematuria exhibited higher SLEDAI scores (12.1 ± 2.9 versus 7.9 ± 3.2; P < .001), a significantly higher prevalence of AKI (22% versus 5%; P = .015), lower levels of C3 [median 0.4 g/l (IQR 0.3–0.6) versus 0.6 (0.4–0.8); P < .001] and C4 [median 0.1 g/l (IQR 0.0–0.1) versus 0.1 (0.0–0.2); P = .018], as well as decreased platelets, total protein and albumin [154.4 ± 79.5 versus 191.7 ± 76.2, 55.4 ± 13.3 g/l versus 60.2 ± 12.6, 25.6 ± 7.4 g/l versus 29.8 ± 6.7; P =.010, .043 and .002, respectively) (shown in Table 1).
Furthermore, patients with haematuria demonstrated a significantly higher prevalence of proteinuria and leukocyturia compared with those without haematuria (96% versus 90%, P = .235; 38% versus 18%, P = .017, respectively). They also had significantly higher values of 24-h urine protein [3.1 g/24 h (IQR 1.6–6.0) versus 1.5 (0.7–3.8); P = .002) and SCr (75.5 μmol/l (IQR 57.8–110.3) versus 51.5 (42.3–58.8); P < .001). There were no differences in other clinical and laboratory features (detailed in Table 1).
Clinical and laboratory characteristics between patients with and without persistent haematuria
A total of 34 of the 178 (19%) patients did not have haematuria throughout the entire course, 72 (40%) patients initially presented with haematuria but later resolved, 66 (37%) exhibited persistent haematuria and 6 (3%) were initially negative for haematuria but developed haematuria later. We classified the patients who had negative haematuria or converted to negative during follow-up as one group and those with persistent haematuria as another group (shown in Table 2). The comparison of treatment regimens between the persistent and non-persistent haematuria groups is presented in Table 3. The results showed a non-significant trend toward a higher initial haematuria rate in the cyclophosphamide (CYC) group than in the non-CYC group (84.2% versus 72.5%; P = .065). In contrast, the CYC group had slightly lower rates of persistent haematuria (32.9% versus 40.2%; P = .318) and endpoint events (12.7% versus 10.5%; P = .650), with no statistical significance for these differences. Compared with 106 patients without persistent haematuria, the 66 patients with persistent haematuria exhibited higher SLEDAI scores (12.3 ± 2.9 versus 10.7 ± 3.6; P = .002), significantly lower levels of haemoglobin (92.7 ± 25.4 g/l versus 102.0 ± 21.1; P = .010), albumin (24.9 ± 6.8 g/l versus 27.5 ± 7.6; P = .024), C3 [0.4 g/l (IQR 0.3–0.5) versus 0.5 (0.3–0.6); P = .009] and C4 [0.1 g/l (IQR 0.0–0.1) versus 0.1 (0.0–0.1); P = .012], as well as higher levels of blood urea nitrogen [BUN; 8.9 mmol/l (IQR 6.7–14.8) versus 5.7 (4.4–8.8); P < .001] and SCr [90.0 μmol/l (IQR 64.5–132.3) versus 62.0 (48.0–80.0); P < .001) (displayed in Table 2).
Binary logistic regression for factors associated with persistent haematuria at onset (n = 178)
Binary logistic regression analysis was conducted to identify significant predictors of persistent haematuria during disease onset. Initial evaluation of nine candidate variables revealed five independent risk factors that were retained in the final predictive model: SLEDAI score, C3 level, SCr level, presence of AKI and non-infectious leukocyturia. Notably, each 0.2 g/l reduction in C3 was associated with an 16.9% increased risk of persistent haematuria [adjusted odds ratio (aOR) 0.16 (95% CI 0.03–0.90), P = .037]. Additionally, every 1 mg/dl increase in SCr corresponded to a 62% higher risk of persistent haematuria [aOR 1.62 (95% CI 1.04–2.54); P = .035) (displayed in Table 4).
Longitudinal association of haematuria with clinical endpoints
Kaplan–Meier survival estimates for haematuria-associated outcomes (n = 178)
In the cohort, 21 of 178 patients (11.8%) experienced the composite outcome, including 9 deaths (42.9%), 6 ESRD (28.6%) and 6 with doubling of SCr (28.6%). Patients with haematuria have a tendency for a poor prognosis, with a median survival time of 80.48 months (95% CI 74.30–86.66) compared with 87.78 months (95% CI 83.47–92.08) in those without haematuria (logrank P = .062; shown in Fig. 2). However, further analysis revealed that persistent haematuria was a stronger predictor of adverse outcomes than the presence of haematuria at the initial diagnosis (P < .001; shown in Fig. 3).
Kaplan–Meier analysis of composite outcomes between patients with and without haematuria at the initial diagnosis of LN.
Kaplan–Meier analysis of composite outcomes for LN patients based on persistent haematuria during the remission of LN.
Adjusted multivariable Cox regression modelling with time-dependent covariates: association between persistent haematuria and composite clinical endpoints (n = 178)
In the full cohort analysis of 178 LN patients, we employed Cox proportional hazards models to evaluate the association between persistent haematuria and adverse outcomes (death or ESRD or doubling of SCr), with covariate adjustment strategies detailed in the Methods section. Schoenfeld residual testing revealed violation of the PH assumption for persistent haematuria stratification (P = .026), while all other variables satisfied the PH assumptions (P > .05). Pearson correlation analysis between covariate residuals and time ranks is presented in the supplementary materials (Supplementary Table S1). We therefore constructed a time-dependent Cox model incorporating time-varying covariates to adjust for temporal bias.
The time-dependent Cox regression demonstrated significant temporal variation in the effect of persistent haematuria on adverse outcomes, characterized by the time-varying coefficient equation: β(t) = −0.8 + 1.224 × ln(t + 1), with the corresponding hazard ratio (HR) formula: HR(t) = exp[−0.8 + 1.224 × ln(t + 1)]. The overall time-averaged effect of persistent haematuria yielded an HR of 3.40 (95% CI 1.06–10.90; P = .039), indicating a significantly elevated risk of adverse outcomes associated with persistent haematuria during follow-up. To quantify short-term risk, at the 12-month follow-up, β(12) = 2.339, corresponding to an HR of 10.37, demonstrating that patients with persistent haematuria had an 10.37-fold higher risk of adverse outcomes compared with non-persistent cases at this time point, reflecting a progressive risk elevation pattern (detailed results are presented in Table 5).
Stratified Cox proportional hazards analysis: association between persistent haematuria and renal outcomes stratified by pathological classification (n=103)
Cox proportional hazards models were employed to evaluate the association between persistent haematuria and adverse outcomes (death or ESRD or doubling of SCr), with covariate adjustment strategies detailed in the Methods section. The Schoenfeld residual test revealed violation of the PH assumption for pathological classification (P = .004), while all other variables satisfied the PH assumptions (P > .05). Consequently, pathological classification was incorporated as a stratified variable to control for potential bias. Pearson correlation analysis results between independent variable residuals and time ranks are presented in the supplementary materials (Supplementary Table S2). Multivariable analysis demonstrated that after covariate adjustment, persistent haematuria remained an independent risk factor for adverse outcomes [adjusted HR 9.32 (95% CI 1.05–82.65); P = .045] (displayed in Table 6).
DISCUSSION
Approximately one-third of LN patients who achieved complete clinical remission according to conventional criteria continue to exhibit histopathological activity upon subsequent renal biopsy [18]. This disconnect implies that standard clinical indicators, such as proteinuria and serological markers, may not adequately capture residual renal inflammation. Although repeat renal biopsy is considered the gold standard for evaluating disease activity, its invasive nature restricts its routine use in clinical practice [19]. These observations highlight that non-invasive biomarkers that can effectively identify ongoing glomerular and tubulointerstitial inflammation and are essential for enhancing long-term therapeutic approaches and prognostic assessments in LN.
The prognostic relevance of haematuria in renal diseases is well documented in the context of IgAN, with substantial evidence linking it to disease activity and adverse outcomes [20–22]. Notably, large cohort studies have shown that patients with persistent haematuria experience significantly higher rates of ESRD or a 50% decline in renal function compared with those with minimal or absent haematuria [23]. However, the clinical implications of persistent haematuria in LN have yet to be thoroughly investigated. This phenomenon is often categorized as a secondary symptom rather than being recognized as a distinct prognostic factor [24]. In our study, we found that 66 of 178 cases (37.1%) still present with persistent haematuria. This subgroup exhibited distinct clinical features, including elevated SLEDAI scores and increased SCr and BUN levels, alongside significantly lower haemoglobin, albumin and complement levels. Further, time-dependent Cox regression analysis further confirmed the association between persistent haematuria and adverse outcomes in LN: during the entire follow-up period, patients with persistent haematuria had a 3.40-fold increased time-averaged risk of adverse outcomes compared with those without persistent haematuria [HR 3.40 (95% CI 1.061–10.90), P = .039]. Notably, this risk effect was not fixed but showed an increasing trend over time—at 12 months of follow-up, the risk of adverse outcomes in patients with persistent haematuria had increased to 10.37-fold. These results not only challenge the traditional proteinuria-centric approach to monitoring LN but also suggest that haematuria may not merely be an epiphenomenon reflecting glomerular inflammation. Rather, it appears to be a clinically significant marker closely associated with an increased risk of adverse outcomes and poor long-term prognosis in LN patients.
Persistent haematuria may serve as a significant differentiator between ‘apparent remission’ and ‘true immunological quiescence’. This distinction is crucial for identifying high-risk patients who continue to experience subclinical nephron injury despite achieving control over proteinuria [25]. This notion aligns with emerging proposals to redefine complete renal remission in LN by integrating both the resolution of haematuria and the normalization of proteinuria [26]. Notably, while recent research has established the prognostic significance of stringent clinical remission as a treatment objective, our findings provide compelling evidence supporting the inclusion of haematuria assessment within this remission framework [13].
Current therapeutic approaches in LN predominantly focus on reducing proteinuria and utilizing immunosuppressive agents, with no evidence-based interventions specifically targeting haematuria [27]. Several critical questions require immediate exploration: Does haematuria in LN signify ongoing immune activation or complement-mediated injury? Are existing therapies, such as hydroxychloroquine, Blys blockade or complement inhibitors, capable of effectively alleviating haematuria? The limited systematic investigation into these inquiries likely arises from a historical underappreciation of the clinical relevance of haematuria. We advocate for the inclusion of haematuria as a secondary endpoint in future clinical trials to evaluate its therapeutic responsiveness and prognostic significance. Furthermore, research on combination therapies aimed at addressing haematuria is warranted, particularly in the context of developing effective management strategies for persistent haematuria.
It should be noted that this study primarily focuses on the association between persistent haematuria and clinical outcomes in LN without delving into its underlying biological mechanisms. Although existing studies suggest that haematuria may contribute to renal injury progression through multiple pathways, the precise role of erythrocyte-mediated kidney injury mechanisms in LN remains unclear and warrants further basic research and translational evidence [19, 28, 29]. Therefore, rather than elaborating on potential mechanisms, this discussion emphasizes the clinical utility of haematuria as a biomarker—regardless of its pathophysiological basis, its robust association with adverse outcomes appears sufficient to justify its inclusion in LN monitoring and remission assessment protocols.
This study has several limitations, including potential biases associated with the retrospective design, the lack of protocol-driven repeated renal biopsies (precluding clarification of the pathological basis of haematuria) and data on disease relapses (including both clinical relapses and those confirmed by biopsy). Future multicentre prospective studies that incorporate non-invasive biomarkers and repeat pathological evaluations are essential to further substantiate the role of haematuria in the management of LN. We further recommend complementary basic research to elucidate the precise mechanistic pathways through which haematuria contributes to LN progression.
CONCLUSION
Persistent haematuria is an independent risk factor for adverse renal outcomes, indicating the need for further exploration. Continuous monitoring of haematuria in clinical practice, along with targeted intervention studies, is essential to improve long-term prognoses for patients with LN.
Supplementary Material
sfaf348_Supplemental_File
The reference list from the paper itself. Each links out to its DOI / PubMed record.
- 1Siegel CH, Sammaritano LR. Systemic lupus erythematosus: a review. JAMA 2024;331:1480–91. 10.1001/jama.2024.231538587826 · doi ↗ · pubmed ↗
- 2Mahajan A, Amelio J, Gairy K et al. Systemic lupus erythematosus, lupus nephritis and end-stage renal disease: a pragmatic review mapping disease severity and progression. Lupus 2020;29:1011–20. 10.1177/096120332093221932571142 PMC 7425376 · doi ↗ · pubmed ↗
- 3Teoh STY, Yap DYH, Yung S et al. Lupus nephritis and chronic kidney disease: a scoping review. Nephrology 2025;30:e 14427. 10.1111/nep.1442739776104 · doi ↗ · pubmed ↗
- 4Anders HJ, Saxena R, Zhao MH et al. Lupus nephritis. Nat Rev Dis Primers 2020;6:7. 10.1038/s 41572-019-0141-931974366 · doi ↗ · pubmed ↗
- 5Yu GZ, Guo L, Dong JF et al. Persistent haematuria and kidney disease progression in Ig A nephropathy: a cohort study. Am J Kidney Dis 2020;76:90–99. 10.1053/j.ajkd.2019.11.008.32197881 · doi ↗ · pubmed ↗
- 6Benichou N, Charles P, Terrier B et al. Proteinuria and haematuria after remission induction are associated with outcome in ANCA-associated vasculitis. Kidney Int 2023;103:1144–55. 10.1016/j.kint.2023.02.02936940799 · doi ↗ · pubmed ↗
- 7Weng M, Lin J, Chen Y et al. Time-averaged haematuria as a prognostic indicator of renal outcome in patients with Ig A nephropathy. J Clin Med 2022;11:6785. 10.3390/jcm 1122678536431262 PMC 9694958 · doi ↗ · pubmed ↗
- 8He P, Yu X, Zha Y et al. Microhaematuria enhances the risks of relapse and renal progression in primary membranous nephropathy. Front Med 2021;8:704830. 10.3389/fmed.2021.704830 PMC 869576134957132 · doi ↗ · pubmed ↗