Reference Curves for Metabolic Syndrome Indicators in Children and Adolescents: A Global Systematic Review
Khalid Iqbal, Ermioni Chatziangelousi, Maike Wolters, Timm Intemann, Katharina Englert, Antje Hebestreit, Krasimira Aleksandrova

TL;DR
This paper reviews global data to create age- and sex-specific reference curves for metabolic syndrome indicators in children and adolescents.
Contribution
The study identifies inconsistencies in reference values for metabolic syndrome indicators and highlights the need for harmonized global standards.
Findings
Reference values for waist circumference and glucose metabolism biomarkers show substantial heterogeneity.
Blood pressure and lipid parameters show comparatively smaller variations.
Limited data exist for children aged 0–4 years, and study methodologies vary widely.
Abstract
We aimed to summarise recent evidence on age- and sex-specific reference curves for metabolic syndrome (MetS) indicators in paediatric populations. There is a lack of consensus regarding diagnostic thresholds for MetS in children and adolescents, leading to challenges in its early identification and intervention. A systematic search was performed in PubMed/Medline, Web of Science and Scopus, covering the period between January 2018 and February 2025. Three researchers evaluated 8,529 studies according to the inclusion criteria. Finally, 46 articles that reported reference values for at least one metabolic indicator: waist circumference, fasting glucose, glycated haemoglobin, homeostatic model assessment for insulin resistance, high-density lipoprotein cholesterol, triglycerides, systolic or diastolic blood pressure, in children aged 0 to 18 years were included in the review and data…
Genes, proteins, chemicals, diseases, species, mutations and cell lines named across the full text — each resolved to its canonical identifier and authoritative record.
Click any figure to enlarge with its caption.
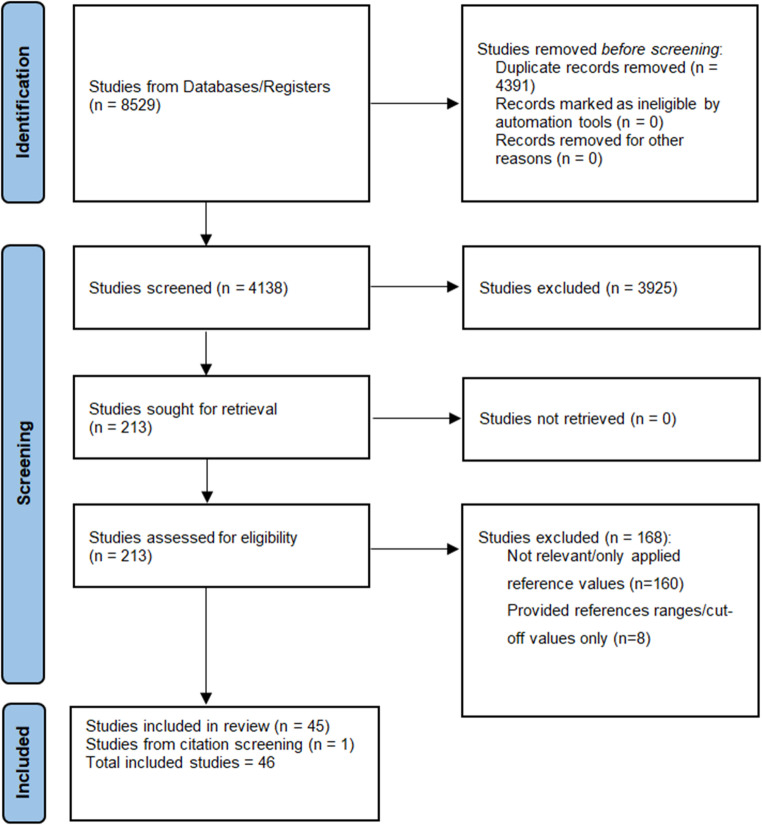 Figure 1
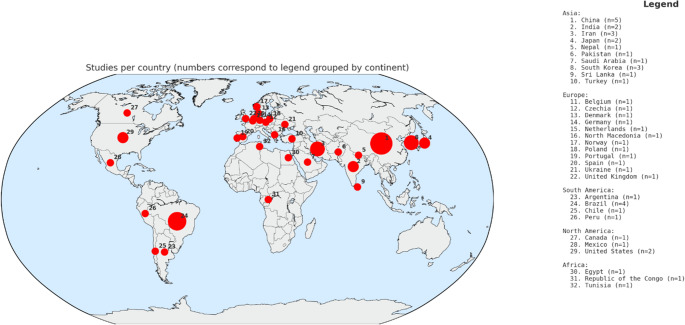 Figure 2
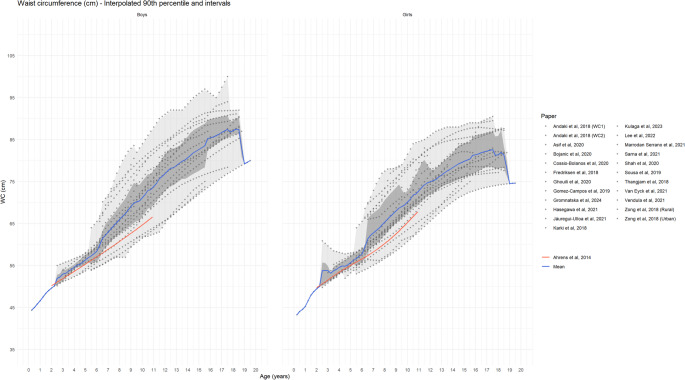 Figure 3
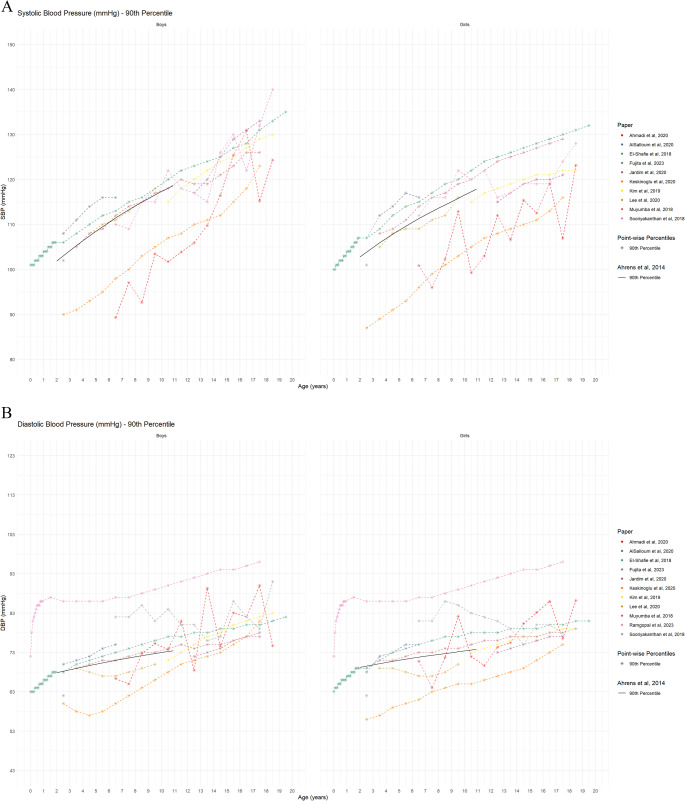 Figure 4
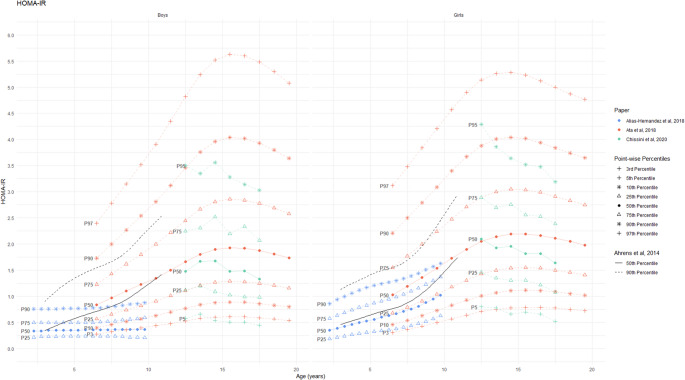 Figure 5
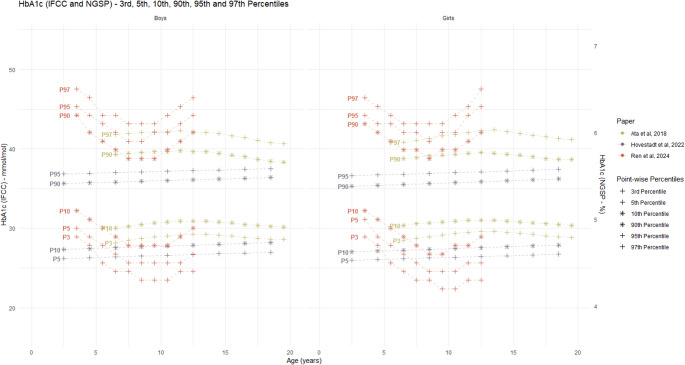 Figure 6
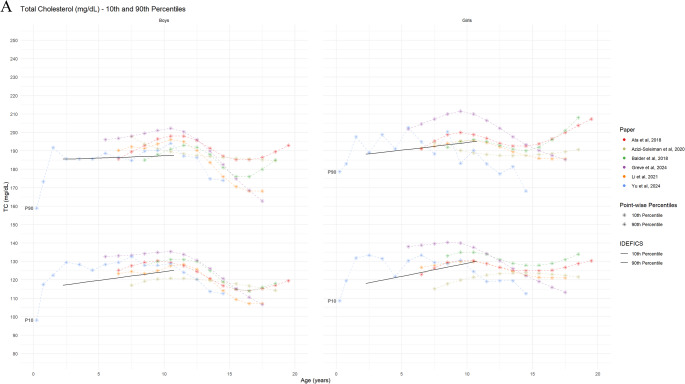 Figure 7
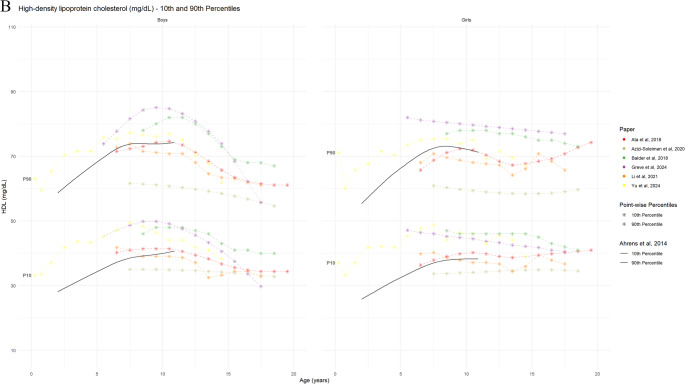 Figure 7
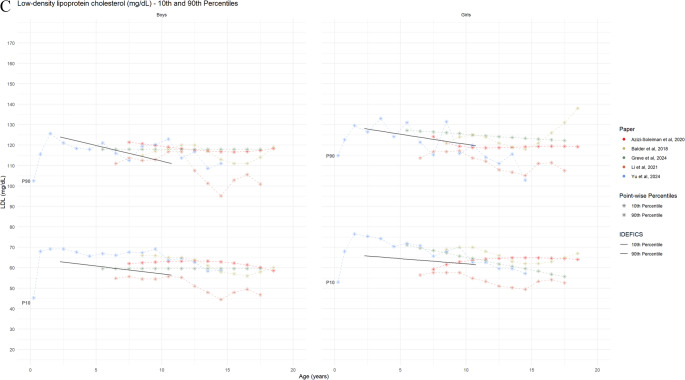 Figure 7
- —Leibniz-Institut für Präventionsforschung und Epidemiologie – BIPS GmbH (5712)
Peer Reviews
No public reviews on file for this paper yet. If you reviewed it on a platform where reviews are public (OpenReview, ICLR, NeurIPS, ICML), you can paste yours below so the community can read it here.
Videos
No videos yet. Explain this paper in a talk, walkthrough, or lecture? Add one.
Taxonomy
TopicsDiabetes, Cardiovascular Risks, and Lipoproteins · Obesity, Physical Activity, Diet · Birth, Development, and Health
Introduction
Metabolic Syndrome (MetS) typically emerges in early life and is strongly linked to an increased risk of developing various chronic diseases throughout a person’s life [1]. MetS is characterized by a cluster of conditions including abdominal obesity, high blood pressure, high blood triglycerides, low levels of high-density lipoprotein cholesterol (HDL-C), and insulin resistance. The increasing prevalence of MetS and related chronic diseases, particularly among younger populations, poses a significant public health challenge. Early identification and intervention are therefore crucial for preventing and managing MetS and its long-term consequences.
A number of paediatric MetS classifications have been suggested previously, proposing a variety of metabolic indicators and cut-off points [2–6]. Among these, the definition of MetS proposed in 2014 by investigators of the Identification and prevention of dietary- and lifestyle-induced health effects in children and infants (IDEFICS) study provided age- and sex-specific (and height-specific in the case of blood pressure) percentiles to identify cut-offs for the components of MetS in children aged 2–11 years [5]. According to the IDEFICS definition, children would require close monitoring if three or more of the metabolic indicators exceed the 90th percentile (or ≤ 10th percentile for HDL-C) whereas intervention would be deemed appropriate if three or more of metabolic indicators exceed the 95th percentile (or ≤ 5th percentile for HDL-C). This definition has been proposed for worldwide use [7] to resolve the currently missing consensus on specific cut-off values for the individual components of MetS in children and adolescents.
Past research has emphasized the need for age- and sex- specific cut-off points and percentiles defining abdominal obesity, dyslipidaemia, elevated BP, and impaired glucose metabolism into account [2, 8–10]. Multiple studies have been published reporting on paediatric reference curves for MetS components [11–13], but still a systematic review of these newly proposed reference curves is lacking.
In order to facilitate the consensus that allows for early diagnosis, effective clinical decision-making, monitoring of changes and prevention efforts, this systematic review aimed to identify reference curves/values for metabolic indicators in relation to MetS in children and adolescents. It further aimed to explore potential differences in the reference values denoting early life metabolic risk by age and sex using the IDEFICS study definition as a reference [5].
Materials and methods
This systematic review was conducted in line with the Preferred Reporting Items for Systematic Reviews and Meta-Analyses (PRISMA) guidelines [14]. The protocol for this systematic review was published in PROSPERO (No CRD420251089483).
Search Strategy
Three independent researchers (EC, KE and KI) conducted a comprehensive search for scientific articles in the following electronic databases (i) PubMed by National Library of Medicine (MEDLINE) (ii) Web of Science and (iii) Scopus by Elsevier. The search was limited to studies that were published in English between January 2018 and February 2025. The population of interest included children and adolescents, with no restriction on age in years to identify maximum studies. The systematic search strategy was organized according to three search blocks depicting terms describing paediatric population, the metabolic components, and reference curves. The keywords and MeSH terms included in the search strategy are provided in the Supplementary Material (Table S1).
A total of 8,529 articles were retrieved, and their titles were checked for duplications and relevance to the review topic. Duplicate references were removed using EndNote (Version 20.2) [15]. Subsequently, the retrieved articles were exported to Covidence (Release 2022; Veritas Health Innovation Ltd, Melbourne, Australia) and screened using the inclusion and exclusion criteria to check their eligibility [16].
Inclusion Criteria
The review questions were defined as follows: (1) What are the metabolic indicators used in the development of reference curves in relation to early life MetS in children and adolescents? (2) Which reference curves exist for individual metabolic indicators? (3) Are there differences in reported reference values denoting early life metabolic risk by age and sex. Thus, articles were considered eligible if they met the following inclusion criteria: (a) based on human participants aged 0 to 18 years (studies with participants older than 18 years were included if the study included the target age range), (b) published in English language, (c) reported age-, and sex-specific percentile values for at least one MetS indicator, i.e. waist circumference (WC), fasting glucose (FG), glycated haemoglobin (HbA1c), homeostatic model assessment for insulin resistance (HOMA-IR), HDL-C, low-density lipoprotein cholesterol (LDL-C), TG, systolic blood pressure (SBP) and diastolic blood pressure (DBP), (d) were peer-reviewed observational studies (i.e. cohort or cross-sectional studies).
Exclusion Criteria
Studies were excluded if they: (a) reported only median or z-scores, fixed cut-off values or reference percentiles values for broader age ranges e.g. 0–5 or 6–10 years (b) were based on clinical (hospital-based) or patient populations or conducted exclusively in athlete populations (to ensure that reference values for apparently healthy pediatric population are identified, (c) conducted exclusively in athlete populations, (d) meta-analyses, systematic reviews, literature reviews, letters to the editor, and conference abstracts, (e) had missing information (age, sex and location), unclear data, or were unavailable in full text.
Quality/Risk of Bias Assessment
The risk of bias of individual studies was assessed using an adapted version of the BIOCROSS tool, that was specifically developed for the purpose of evaluating the reporting quality of epidemiological studies utilizing biomarker data [17]. The tool encompasses five domains: ‘Study rationale’, ‘Design/Methods’, ‘Data analysis’, ‘Data interpretation’, and ‘Biomarker measurement’, assessed using a 10-item scale. In cases of disagreement, a third reviewer (MW or KI) was consulted to reach a final decision.
Data Extraction
Data extraction of selected studies was performed using a prespecified form prepared by the research team. Two reviewers (EC and KE) independently added the extracted data to the file which was then compared to ensure accuracy. The following information was extracted: author names, publication year, study year, country where the research was conducted, study design, sample size, age of participants, sex of the participants, data collection period, and method of reference value estimation. Finally, another researcher (KI) reviewed the extracted data for verification. Articles selected based on the abstracts screening underwent full text review, and only those meeting all eligibility criteria were included. In cases of disagreement between the researchers, a third researcher (KI) made the final decision. References of the included studies were manually searched to identify additional studies.
Data Synthesis
The characteristics of the included studies were summarized descriptively. For comparability, the reference curves of all studies for the single markers were overlaid in a single plot. To assess the overall age-specific trends in these biomarkers, the median reference curves, along with the lower and upper bounds of the 5th, 10th, 50th, 90th, and 95th percentiles from all studies, are presented. The IDEFICS study definition of MetS components proposed by Ahrens et al. [5] were overlaid on the corresponding percentiles of each component for comparison as reference. In order to clearly display the more than 24 waist circumference curves, additional interval bands (covering 50% and 100% curves) and mean values of all studies available for the respective age were derived and displayed. For this purpose, the curves from the individual studies were interpolated to cover all age values in increments of 0.25 years.
Results
A flowchart summarizing the study selection procedure is presented in Fig. 1. The screening process based on searching relevant electronic databases and additional manual search resulted in the retrieval of 8,529 articles. After removing duplicates, a total of 4,391 articles were screened. Following the initial screening based on article titles, 4,199 articles underwent abstract screening, and 213 articles were assessed based on full text, which resulted in inclusion of 46 studies. One study was identified through citation screening. Consequently, a total of 46 studies fulfilled the inclusion criteria and were included in this systematic review.
Fig. 1. Prisma diagram of systematic literature search
Overview of Included Studies
The characteristics of the selected studies according to MetS components are reported in Table 1. An overview of the geographical distribution of studies are shown in Fig. 2. Highest number of studies were conducted in Asia (n = 20; 43.5%) followed by Europe (n = 12; 26.1%), South America (n = 7; 15%), North America 4 (8.7%), and Africa (n = 3; 6.5%). In total, 26 (56.5%) studies were conducted in low- and middle-income countries, whereas 20 (43.5%) studies were conducted in high-income countries. Age of the participants ranged from 0 to 19 years in the included studies. Out of the 46 included studies, 41 (89.1%) included adolescents 10–14 years, whereas only 5 (10.9%) studies included children under 2 years and 18 (39.1%) studies included children aged 2–4 years (Figure S1). Ratio of girls to boys in the included studies ranged from 0.88 to 1.5. Majority (n = 39) of the studies had a cross-sectional design, whereas 6 studies were prospective cohort and 1 study was controlled intervention study. Sample sizes of the included studies ranged from 1,035 [18] to 68,261 [19].
Table 1. General characteristics of included studies according to metabolic syndrome indicatorsStudy NoAuthor, yearCountryPopulationAge range (years)Study typeData collection (years)MethodWaist Circumference1 Kulaga et al., 2023Poland22,370 (girls:11,611/boys:10,759)3–18Cross-sectional2007–2012LMS2 Lee et al., 2022Korea22,495 (girls:10,882/boys:11,613)2–18Cross-sectional2007–2019LMS3Hasegawa et al., 2021Japan9,695 (girls:4,758/boys:4,937)0–6Cross-sectional1978–1981LMS4 Jáuregui-Ulloa et al., 2021Mexico12,979 (girls:6,998/boys:5,981)5–17Cross-sectional2018Quantile regression5Marrodan Serrano et al., 2021Argentina, Cuba, Spain-Mexico -Venezuela13,289 (girls:6,714/boys:6,575)6–18Cross-sectional2005–2011LMS6 Sarna et al., 2021India68,261 (girls:32,814/boys:35,449)5–19Cross-sectional2016–2018LMS7 Van Eyck et al., 2021Belgian20583–18Prospective cohort2012–2020GAMLSS8 Vendula et al., 2021Czech Republic2,093 (girls:1,085/boys:1,008)6–11Cross-sectionalNDGAMLSS9 Asif et al., 2020Pakistan10,668 (girls:5,129/boys:5,539) 2–18Cross-sectional2016LMS10 Bojanic et al., 2020North Macedonia2,490 (girls:1,202/boys:1,288)11–18Cross-sectional2017LMS11 Cossio-Bolaños et al., 2020Peru1,536 (girls:788/boys:748)5- 17.9Cross-sectional2016LMS12 Ghouili et al., 2020Tunisia2,308 (girls:1,186/boys:1,122)6–18Cross-sectional2014–2015LMS13 Shah et al., 2020UK1,562 (girls:910/boys:652)4–13.9Cross-sectional2004–2007LMS14Gomez-Campos et al., 2019Chile9,232 (girls:4,381/boys:4,851)6–18.9.9Cross-sectional2014–2015LMS15 Sousa et al., 2019Portugal6,987(girls:3,532/boys:3,455)6–18Cross-sectional2004–2009LMS16 Andaki et al., 2018Brazil1,397(girls:729/boys:668)6–10Cross-sectional2011–2012LMS17 Fredriksen et al., 2018Norway2,271(girls:1,121/boys:1,150)6–12Controlled intervention2015ND18 Karki et al., 2018Nepal1,1355, 6, 12 and 15Cross-sectional2016LMS19Thangjam et al., 2018India2,334 (girls:1,093/boys:1,241)5–15Prospective cohort2012–2015ND20 Zong et al., 2018China53,172 (girls:26,521/Boys:26,651)3–7Cross-sectional2015ND21 Gromnatska et al., 2024Ukraine1,566 (girls: 807/boys: 759)10–17Cross-sectionalNDND22 Alves Junior et al., 2024Brazil9,665 (girls: 5023/boys: 4642)7–14Cross-sectional2002–2019LMS Systolic and diastolic blood pressure 1 Fujita et al., 2023Japan3,361(girls:1,689/boys:1,672)2Cross-sectional2015–2017LMS2 Ramgopal et al., 2023United States343,1290–17Cross-sectional2020–2021GAMLSS3 Ahmadi et al., 2020Iran1,035(girls:579/boys:456)6–18Cross-sectional2017LMS4AlSalloum et al., 2020Saudi Arabia2,553(girls:1,254/boys:1,299)2–6Cross-sectional2004–2005Mixed-effect linear regression5 Jardim et al., 2020Brazil73,99912–17Cross-sectional2009Polynomial-regression6Keskinoglu et al., 2020Turkey4,984 (girls:2,486/boys:2,498)2–17Cross-sectional2012–2013Polynomial-regression7 Lee et al., 2020Korea1,732 (girls:868/boys:864)3, 5,7,8,9Cross-sectional2001–2006GAMLSS8 Kim et al., 2019Korea10,442 (girls:4,953/boys:5,489)10–18Cross-sectional1998–2016GAMLSS9 El-Shafie et al., 2018Egypt60,025 (girls:28,422/boys:31,603)0–19Cross-sectional2015–2017Regression/ND10 Muyumba et al., 2018Republic Kongo6,883 (girls:3,510/boys:3,373)3–17Cross-sectional2014–2016GAMLSS11 Sooriyakanthan et al., 2018Sri Lanka1,922 (girls:972/boys:950)6–18Cross-sectionalNDLinearregression Biomarkers of glucose metabolism and insulin resistance 1 Hovestadt et al., 2022Germany2,455 (girls:1,190/boys:1,265)0.5–18Prospective cohort2011–2017GAMLSS2 Hu et al., 2021United States7786 (girls:3946/boys:3840)12–20Cross-sectional1999–2018Quantile regression3 Chissini et al., 2020Brazil37,815 (girls:22,682/boys:15,133)12–17Cross-sectional2013–2014ND4Ata et el, 2018Canada6,116 (girls:2,963/boys:3,153)6–19Cross-sectional2007–2013LMS5Alías-Hernández et al., 2018Spain654 (girls:336/boys:318)2–9.9.9Cross-sectional2009GAMLSS6 Ren et al., 2024China4,615 (girls:2293/boys:2322)3–12Cross-sectional2018–2019GAMLSS Biomarkers for lipid metabolism 1Montazeri- Najafabady et al., 2023Iran472 (girls:234/boys:238)9–18Prospective cohortNDLMS2 Li et al., 2021China15,830 (girls:7,757/boys:8,073)6–17Cross-sectional2013LMS3 Azizi-Soleiman et al., 2020Iran3,843 (girls:1,833/boys:2,010)7–18Cross-sectional2015ND4 Xiao et al., 2019China12,875 (girls:6,250/boys:6,625)6–18Cross-sectional2013–2015GAMLSS5Ata et el, 2018Canada6,116 (girls:2,963/boys:3,153)6–19Cross-sectional2007–2013LMS6 Balder et al., 2018Netherlands8,071 (girls:4248/boys:3,823)8–18Cross-sectional2006–2013GAMLSS7 Greve et al., 2024Denmark1,456 (girls:751/boys: 705)5–17Prospective cohort2008–2015GAMLSS8 Yu et al., 2024China5,624 (girls. 2715/boys: 2909)0–15Prospective cohort2017–2022LMS sex specific numbers not provided
Fig. 2. Geographical distribution of studies included in the systematic review
Overall, 22 studies [11, 19–39] reported reference values for WC, 11 studies [12, 13, 18, 40–47] for systolic and diastolic blood pressure, 6 studies [48–53] for HbA1c [48, 51, 53], fasting glucose [49], insulin [51, 52] and HOMA-IR [50–52]) and 8 studies [51, 54–60] for lipid parameters (TC, LDL, HDL, and TG). Majority of the studies focused on single metabolic indicators except Ata N. et al. [51] that reported reference curves for HbA1c, HOMA-IR, TC and HDL-C.
The assessment methods for WC, blood pressure, and individual metabolic biomarkers are summarised in Table 2. WCwas measured consistently across studies, most commonly at the midpoint between the lowest rib and the iliac crest using a non-stretchable tape. In contrast, variations were observed in the methods for blood pressure measurement and biomarker assessments.
Table 2. Measurements used for evaluation of biomarkers/anthropometric indicatorsSNoAuthor, yearMetabolic indicator indicators evaluatedMeasurement methodWaist Circumference1. Kulaga et al., 2023WCMeasured midway between the lowest rib and the iliac crest without clothes at the end of expiration using non-stretch anthropometric tape2. Lee et al., 2022WCMeasured midway between the lowest rib and the iliac crest (highest margin) at the end of expiration using flexible tape (Seca 220)3.Hasegawa et al., 2021WCMeasured at the level of the umbilicus. 0–1 year: Supine position 2–7 years: Standing position4. Jáuregui-Ulloa et al., 2021WCMeasured midway between the lower costal border and the iliac crest at the end of expiration using rigid metal tape (Lufkin W606PM, Lufkin, NC, USA)5.Marrodan Serrano et al., 2021WCMeasured at the umbilical level6. Sarna et al., 2021WCMeasured midway between the lowest rib and the iliac crest (highest margin) at the end of expiration using flexible tape7. Van Eyck et al., 2021WCMeasured approximately 1 cm above the umbilicus at the point of the smallest circumference between the lowest rib and highest hip comb. Standing position8. Vendula et al., 2021WCMeasured at the point just above the uppermost lateral border of the right iliac crest, at the end of a normal exhalation9. Asif et al., 2020WCMeasured midway between the lowest rib and the iliac crest (highest point) at the end of expiration using non-elastic plastic tape10. Bojanic et al., 2020WCMeasured midway between the lowest rib and the iliac crest (highest point) at the end of expiration using non-elastic anthropometric tape11. Cossio-Bolaños et al., 2020WCProcess not described, used metal Seca tape12. Ghouili et al., 2020WCMeasured midway between the lowest rib and the iliac crest (highest margin) using non-elastic flexible tape13. Shah et al., 2020WCMeasured approximately midway between the lowest rib and the iliac crest (highest margin) using non-elastic retractable tape and adjusted for clothing (0.5 cm)14.Gomez-Campos et al., 2019WCMeasured midway between the lowest rib and the iliac crest (highest margin) using metal anthropometric measuring tape (Seca brand)15. Sousa et al., 2019WCMeasured midway between the lowest rib and the iliac crest at the end of expiration using non-extendable tape16. Andaki et al., 2018WCMeasured midway between the lowest rib and the iliac crest at the end of expiration using a flexible and non-elastic tape (Sanny, São Paulo, Brazil)17. Fredriksen et al., 2018WC1, WC2Measured at the umbilicus level after normal expiration using non-elastic measuring tape18. Karki et al., 2018WCMeasured midway between the lowest rib and the iliac crest using inelastic plastic measuring tape (Prym^®^, William Prym Holding GmbH, Stolberg, Germany)19.Thangjam et al., 2018WCMeasured midway between the lowest rib and the iliac crest using non-stretchable tape during end-tidal expiration20. Zong et al., 2018WCMeasured midway between the lowest rib and the iliac crest at the end of expiration using inextensible plastic tapeStanding position21. Gromnatska et al., 2024WCMeasured midway between the lower rib and the ilium crest using flexible measuring tape22. Alves Junior et al., 2024WCMeasured midway between the lower rib and the ilium crest using fibre anthropometric tape (Sanny^®^, model TR4013, São Paulo, Brazil) Systolic and diastolic blood pressure
- Fujita et al., 2023SBP and DBPAneroid sphygmomanometer (DS66 DuraShockTM hand aneroid [Welch Allyn Inc, Syracuse, NY, USA] Sitting positionThree measurements but the average value of two consecutive measurements2. Ramgopal et al., 2023SBP and DBPAutomated blood pressure monitors From Arm or Leg3. Ahmadi et al., 2020SBP and DBPAutomatic digital BP device (Automatic Blood pressure Monitor, Model M3 Comfort, Omron Co., Osaka, Japan).Sitting position, right handThree measurements taken, average of last two used4.AlSalloum et al., 2020SBP and DBPOscillometric techniques readings Children < 2 years: supine position Children > 2 years in sitting position. Recorded the Lower BP level of two measurements5. Jardim et al., 2020SBP and DBPOscillometric deviceThree BP measurements (The mean from the two last measurements were used)6.Keskinoglu et al., 2020SBP and DBPOscillometric deviceRight arm, heart levelThree readings of BP, with a 2-minute intervalAverage of the three measurements7. Lee et al., 2020SBP and DBPAutomated instrument (Dinamap Procare 200; GE Inc., Milwaukee, WI, USA)Right arm, heart levelTwo BP measurements, with a 5-minute intervalAverage of the two measurements8. Kim et al., 2019BP, SBP, DBPMercury sphygmomanometer (Baumanometer sphygmomanometer, W.A. Baum Co Inc., Copiague, NY, USA) & Littmann Stethoscope (3 M, Maplewood, MN, USA) Right arm, heart levelMean of the second and third readings9. El-Shafie et al., 2018SBP and DBPStandard mercury sphygmomanometers (Model 1002/Presameter, Riester, Germany)Infants: supine positionChildren: in sitting positionTwo readings, with 5–10 min intervalThe mean of the readings10. Muyumba et al., 2018SBP and DBPOscillometric measurement (Datascope Accutorr Plus; Datascope Corporation, USA)Sitting position, heart level30 min after physical exercise or last mealThree readings, 1-minute Interval Mean of the second and third reading11. Sooriyakanthan et al., 2018SBP and DBPStandard mercury sphygmomanometerThree readings with 5-minute interval.Average of second and third readings was used Biomarkers of glucose metabolism and insulin resistance
- Hovestadt et al., 2022HbA1cCOBAS 8000 c502 platformTurbidimetric immunological inhibition assay (TINIA) using hemolyzed bloodResults given in NGSP units [%]2. Hu et al., 2021blood glucoseND3. Chissini et al., 2020HOMA-IRBlood samples after 12-h overnight fastHexokinase method for plasma glucose usingADVIA 2400 Clinical Chemistry System Electrochemiluminescence assays for InsulinModular E170s (Roche, Indianapolis, IN, USA) and Enzymatic colorimetric method for lipid profilModular Analyser (Roche, Indianapolis, IN, USA)HOMA-IR with equation proposed by Matthews et al.4.Ata et el, 2018HbA1c, Insulin, HOMA-IRInsulin: Solid-phase, chemiluminescent immunometric assayAnalyzer: Advia Centaur XP (Siemens)HOMA-IR: Calculated as (fasting insulin [µU/L] x glucose [mmol/L])/22.5 HbA1c: Immunoturbidimetric test, Analyzer: Vitros 5,1FS (Ortho Clinical Diagnostics)5.Alías-Hernández et al., 2018insulin, HOMA-IRBlood Samples: overnight fasting > 8 h; Glucose & Lipid Profil: Cobas e-501 analyser (Roche Diagnostics, Basel, Switzerland)Insulin: Cobas c-601 analyser (Roche Diagnostics, Basel, Switzerland) HOMA index: (glucose [mmol/L] × insulin [µIU/mL])/22.5 QUICKI: (1/log [fasting insulin] + log [fasting glucose])6. Ren et al., 2024HbA1cA1C EZ 2.0 POC analyzer (BioHermes Ltd., Wuxi, Jiangsu, China). Triglycerides and HDL cholesterol 1.Montazeri- Najafabady et al., 2023TC, HDL, LDL, TGSerum total cholesterol, HDL-C, and triglycerides (TG): Enzymatic reagents (Biosystems, Barcelona,Spain), A-25 Biosystem Autoanalyser LDL: Friedwald equation from calculated TG, HDL-C, and total cholesterol (TC) Non-HDL-C: subtracting HDL-C from total cholesterol2. Li et al., 2021TC, LDL-C, HDL-C, TGTC, LDL-C, HDL-C and TG: enzymatic methodsLDL-C and HDL-C: clearance methods3. Azizi-Soleiman et al., 2020TG, TC, LDL-C, HDL-C, (1, 2)Lipid profiles (TG, TC, LDL-C, HDL-C): Enzymatic colorimetric methodAnalyzer: Hitachi Automatic Analyzer 7600, LDL-C direct measurement4. Xiao et al., 2019TC, LDL-C, HDL-C, TGTotal cholesterol (TC), LDL-C, HDL-C, triglycerides (TG): Enzymatic methodAnalyzer: Hitachi 7080 automated analyzer5.Ata et el, 2018TC, HDLColorimetric testVitros 5,1FS analyzer (Ortho Clinical Diagnostics)6. Balder et al., 2018TC, HDL, LDL, TGTotal cholesterol (TC), LDL-C, HDL-C, triglycerides (TG): Vitros 5,1FS (Ortho Clinical Diagnostics)7. Greve et al., 2024TC, TG, LDL, HDL, remnant cholosterolFasting blood samples, enzymatic colorimetric method on a Roche/Hitachi cobas c system machine8. Yu et al., 2024TG, TC, HDL-C, LDL-CTG, TC, HDL-C: Roche cobas702 automatic biochemical analyzer, enzymatically measuredAbbreviations: DBP: Diastolic blood pressure; HbA1c: Hemoglobin A1c; HDL-C: High Density Lipoprotein Cholesterol; HOMA-IR: homeostasis model assessment of insulin resistance; HTN: hypertension; LDL-C: Low Density Lipoprotein Cholesterol; ND: Not described; SBP: Systolic blood pressure; TC: Total cholesterol; TG: Triglycerides; WC: Waist circumference
Statistical Modelling Approaches for Deriving Reference Curves
The reference curves in the different studies were derived predominantly by generating smoothed reference centile curves based on the Lambda-Mu-Sigma (LMS) method (n = 22) and the Generalized Additive Models for Location, Scale, and Shape GAMLSS method (n = 12). LMS is an approach to construct the normalized percentiles using Box-Cox transformation that summarizes the distribution through the median, coefficient of variation, and skewness [61]; whereas GAMLSS is a generalized regression approach to construct normalized percentiles using not only location, scale, and skewness but also kurtosis, allowing greater flexibility in modelling age-dependent distributional changes [62]. Other approaches used for percentile estimation included polynomial regression (n = 2), quantile regression (n = 2) and linear regression (n = 2). Six studies [34, 36–38, 50, 56] did not specify or provide details of the statistical method used to estimate percentiles for the reference curves.
Percentile Distribution According To Metabolic Indicators
Waist Circumference
WC reference values were derived for the healthy paediatric populations in 22 studies. The respective age- and sex-specific percentile curves reported by the individual studies are presented in Table 3 and the corresponding 90th percentiles are shown in Fig. 3. Due to differences in age-groups across studies, the reported percentiles did not cover the whole age range from 2 to 19 years in each study. Overall, the 50th and 90th percentile of the WC showed a steady increase in WC with age in both sexes (Figure S2). These results are consistent with the reference values previously reported based on the IDEFICS study population of European children [5]. Comparison of the study-specific 50th and 90th percentiles showed larger inter-study variations in WC for corresponding ages. The mean 50th percentile of the included studies agreed well with the IDECFICS reference values; however, the mean 90th percentile of the included studies was higher than the IDEFICS 90th percentile, with larger difference observed in higher age-groups. In these studies, sex-specific 90th percentile [19, 22–25, 27–29, 32, 38] was the most common cut-off to define abdominal obesity in children and adolescents. Some studies suggested 95th [27, 29] or 75th [37] percentiles as cut-off for higher risk/obesity among children and adolescents (Table 3).
Table 3. Percentile distribution according to metabolic syndrome componentsAuthor, YearBiomarkers/Anthropometric indicators evaluatedPercentiles reportedStratification variables and modeling of reference growth curvesDiagnosticWaist circumference Kulaga et al., 2023WCP3, P10, P25, P50, P75, P90, P95 shown in percentile curves; values reported for P90, P95Sex specific, Age specificAbdominal obesity:WC: P90 and P95 and cut-offs linked to adult cutoffs: boys 94 cm, girls: 80 cm Lee et al., 2022WCP3, P5, P10, P25, P50, P75, P90, P95, P97Sex specific, Age specificAbdominal obesity: WC ≥ P90Hasegawa et al., 2021WCP3, P10, P25, P50, P75, P90, P97Sex specific, Age specificP90 both sexes for normal weight Abdominal obesity: P97 boys; P96 girls Jáuregui-Ulloa et al., 2021WCP5, P10, P15, P20, P25, P30, P40, P50, P60, P70, P75, P80, P85, P90, P95Sex specific, Age specificAbdominal obesity: WC ≥ P90Marrodan Serrano et al.,2021WCP3, P5, P10, P25, P50, P75, P90, P95, P97Sex specific, Age specificAbdominal obesity: WC ≥ P90 Sarna et al., 2021WCP5, P25, P50, P75, P85, P90, P95Sex specific, Age specificAbdominal obesity: WC ≥ P90 Van Eyck et al., 2021WCP3, P5, P10, P25, P50, P75, P90, P95, P97sex specefic, Age specificND Vendula et al., 2021WCP3, P10, P25, P50, P75, P90, P97Sex specific, Age specificND Asif et al., 2020WCP5, P10, P25, P50, P75, P90, P95Sex specific, Age specificLower: P5, Higher Abdominal obesity: P95, Critical Cut-off (Abdominal Obesity): P90 Bojanic et al., 2020WCP3, P10, P25, P50, P75, P90, P97Sex specific, Age specificMidpoint (mean): P50, Abdominal obesity: P90 Cossio-Bolaños et al., 2020WCP3, P5, P10, P15, P25, P50, P75, P85, P90, P95, P97Sex specific, Age specificUnderweight: P5, Abdominal obesity: P95 Ghouili et al., 2020WCP3, P10, P25, P50, P75, P90, P97Sex specific, Age specificOptimal Percentiles of WC for cardiovascular disease P75 Shah et al., 2020WCP2, P9, P25, P50, P75, P90, P91, P98, P99,6Sex specific, Age specificAbdominal Obesity WC ≥ P90Gomez-Campos et al., 2019WCP3, P5, P10, P15, P50, P85, P95, P97Sex specific, Age specificND Sousa et al., 2019WCP3, P5, P10, P25, P50, P75, P85, P90, P95, P97Sex specific, Age specificND Andaki et al., 2018WCP5, P10, P25, P50, P75, P90, P95Sex specific, Age specificND Fredriksen et al., 2018WCP5, P10, P25, P50, P75, P90, P95Sex specific, Age specificND Karki et al., 2018WCP3, P10, P25, P50, P75, P90, P97Sex specific, Age specificAbdominal Obesity: WC cut-offs of + 1.28 SDS or > 90th percentileThangjam et al., 2018WCP5, P10, P25, P50, P70, P75, P90, P95Sex specific, Age specificND Zong et al., 2018WCP5, P10, P15, P20, P25, P50, P75, P80, P85, P90, P95Sex specific, Age specificIncreased risk of cardiovascular factors P75 & P90 (in China) Gromnatska et al., 2024WCP5, P10, P25, P50, P75, P90, P95Sex specific, Age specificAbdominal Obesity: WC ≥ P90 Alves Junior et al., 2024WCP5, P10, P25, P50, P75, P85, P95Sex specific, Age specificND Systolic and diastolic blood pressure Fujita et al., 2023SBP and DBPP50, P90, P95, P99 for following percentiles of height: P5, P10, P25, P50, P75, P90, P95Sex specific, Height specificND Ramgopal et al., 2023DBPP1, P2.5, P5, P10, P25, P50, P75, P90, P95, P97.5, P99Age specificAbnormal DBP (a DBP < 10th or > 90th centile) Ahmadi et al., 2020SBP and DBPP50, P90, P95, P99 for following percentiles of height: P5, P10, P25, P50, P75, P90, P95Sex specific, Agespecific, Height specificPre-hypertension: SBP & DBP > P90, Stage I Hypertension: SBP & DBP > P95 + 5mmHg, Stage II hypertension SBP & DBP > P99boysgirls + 5mmHgAlSalloum et al., 2020SBP and DBPP50, P90, P95, P99, P95 + 12 mm Hg for following percentiles of height: P5, P10, P25, P50, P75, P90, P95Sex specific, Agespecific, H eight specificNormal BP < P90, Elevated BP ≥ P90, Stage I Hypertension BP ≥ P95 to BP < P95 + 12mmHg, Stage II hypertension BP ≥ P95 + 12mmHg or ≥ 140/90mmHgboysgirls Jardim et al., 2020SBP and DBPP50, P90, P95, P99 for following percentiles of height: P5, P10, P25, P50, P75, P90, P95Sex specific, Agespecific, Height specificNo clear definition of hypertensionKeskinoglu et al., 2020SBP and DBPP50, P90, P95 for following percentiles of height: P5, P25, P50, P75, P95Sex specific, Agespecific,Height specificNormal BP < P90 percentilePreadolescent, prehypertension SBP and DBP ≥ P90 and < P95Hypertension: SBP and DBP ≥ P95boysgirls Lee et al., 2020SBP and DBPP5; P10; P25; P50; P75; P90; P95 for following percentiles of height: P50, P90, P95Sex specific, Agespecific, H eight specificPrehypertension between P90 and P94 hypertension: SBD, DPB: ≥ P90 Kim et al., 2019SBP and DBPP50; P90; P95; P99 for following percentiles of height: P5, P10, P25, P50, P75, P90, P95Sex specific, Agespecific, Height specificHypertension:SBD, DPB: ≥ P95 El-Shafie et al., 2018BP, SBP, DBPP50, P75, P90, P95Sex specific,AgespecificNormal SB: P50-P90boysgirls, high-normal SB: P90-P95boysgirls, high BP > P95 Muyumba et al., 2018SBP and DBPP50; P90; P95 for following percentiles of height: P5, P25, P50, P75, P95Sex specific, Agespecific, Height specificPrehypertension SBP & DBP ≥ P90 Hypertension SBP & DBP ≥ P95 define Metabolic Syndrome: BP ≥ P90Sooriyakanthan et al.,2018SBP and DBPP50, P90, P95 for following percentiles of height: P25; P50; P75Sex specific, agespecific, Height specificND Biomarkers of glucose metabolism and insulin resistance Hovestadt et al., 2022HbA1cP2,5, P5, P10, P25, P50, P75, P95, P97,5Sex specific, Age specificND Hu et al., 2021blood glucoseP25, P50, P75Sex specific, Age specificND Chissini et al., 2020HOMA-IRP5, P25, P50, P75, P90Sex specific, Age specificHigher Blood Pressure: P90, MetS Cut-off: P75 girls; P90 boysAta et el, 2018HbA1c, Insulin, HOMA-IRP3, P10, P25, P50, P75, P90, P97Sex specific, Age specificNDAlías-Hernández et al., 2018insulin, HOMA-IRP25, P50, P75, P90Sex specific, Age specificInsulinaemia > P90, HOMA-IR > P90 Ren et al., 2024HbA1cP1, P3, P5, P10 P25, P50, P75, P90, P95, P97, P99Sex specific, Age specificND Biomarkers for lipid metabolism Montazeri-Najafabady et al., 2023TC, HDL, LDL, TGP3, P10, P25, P50, P75, P90, P97Sex specific, Age specificTC ≥ 200 mg/dL, LDL-C ≥ 130 mg/dL, HDL C < 40 mg/dL. Furthermore,the recommended thresholds for defining hyper triglyceridemic have been ≥ 100 mg/dL and ≥ 130 mg/dL inchildren aged 0–9 and 10–19 years, respectively [31]. In thepresent study, the 97th percentile for TG, Li et al., 2021TC, LDL-C, HDL-C, TGP2,5, P5, P10, P25, P50, P75, P90, P95, P97,5Sex specific, Age specificFamilial hypercholesterolemia:- HDL: (P2,5)LDL-C, TC, TG: (P97,5) LDL-C, TC, TG: ≥ P95 high HDL-C < P10 low Azizi-Soleiman et al., 2020TG, TC, LDL-C, HDL-CP5, P10, P25, P50, P75, P90, P95Sex specific, Age specificpediatric dyslipidaemia: TC ≥ 200 mg/dL, LDL-C ≥ 130 mg/dL, HDL-C < 40 mg/dL, hypertriglyceridemia has been ≥ 100 mg/dL and ≥ 130 mg/dL in children aged 0–9 and 10–19 years Xiao et al., 2019TC, LDL-C, HDL-C, TGTC: P5, P25, P50, P75, P95, P98, P9988LDL-C: P5, P25, P50, P75, P95, P97, P99.5 HDL-C: P5, P12, P25, P50, P75, P95 TG: P5, P25, P50, P75, P93, P95, P98Sex specific, Age specificTC:- Borderline-High: boys (P98), girls (P97)- high: boys (P99.8), girls (P99.6)LDL-C:- Borderline-High: boys (P97), girls (P97)- high: boys (P99.5), girls (99.4)HDL-C:- low: boys (P12), girls (P5)TG:- Borderline-High: boys (P93), girls (P97)- high: boys (P98), girls (99.3)Ata et el, 2018TC, HDLP3, P10, P25, P50, P75, P90, P97Sex specific, Age specificND Balder et al., 2018TC, HDL, LDL, TGP5, P10, P25, P50, P75, P90, P95Sex specific, Age specificND Greve et al., 2024TC, TG, LDL, HDL, remnant cholosterolP2,5, P5, P10, P25, P50, P75, P90, P95, P97,5Sex specific, Age specific95% Reference interval: total cholesterol boys = 2.88–5.38 mmol/l and girls = 3.00–5.79 mmol/l, HDL cholesterol boys = 0.94–2.22 mmol/l and girls = 0.92–2.33 mmol/l, LDL cholesterol boys = 1.21–3.51 mmol/l and girls = 1.32–3.76 mmol/l, triglycerides boys = 0.31–1.36 mmol/l and girls = 3.00–5.79 mmol/l and remnant cholesterol boys = 0.08–0.63 and girls = 0.11–0.70 Yu et al., 2024TG, TC, HDL-C, LDL-C, nHDL-CP2,5, P5, P10, P25, P50, P75, P90, P95, P97,5Sex specific, Age specificDyslipidemia: TG mmol/L (mg/dL) ≥ 1.58 (140) TC mmol/L (mg/dL) ≥ 5.70 (220) HDL-C mmol/L (mg/dL) ≤ 1.04 (40) LDL-C mmol/L (mg/dL) ≥ 3.63 (140)Abbreviations: DBP: Diastolic blood pressure; HbA1c: Hemoglobin A1c; HDL-C: High Density Lipoprotein Cholesterol; HOMA-IR: homeostasis model assessment of insulin resistance; HTN: hypertension; LDL-C: Low Density Lipoprotein Cholesterol; ND: Not described; SBP: Systolic blood pressure; TC: Total cholesterol; TG: Triglycerides; WC: Waist circumference
Fig. 3. Reference values for WC by age and sex (absolute values) 90th percentile curves of included studies, corresponding intervals bands covering all studies (light grey) and 50% of studies (dark grey) and mean 90th percentile The red line shows 90th percentile reference from IDEFICS definition by Ahrens et al., 2014 [5]
Blood pressure: Overall, eleven independent studies collectively provided reference values for both SBP and DBP (Table 3). A comparative analysis of the study-specific reference values demonstrated considerable variability in the age- and sex-specific 50th (Figure S3) and 90th (Figures: 4 & 5) values across the evaluated studies. Most of the studies proposed age-, sex-, height-specific 90th [12, 13, 18, 41, 42, 46] or 95th [12, 45] percentiles of SBD and/or DBP as diagnostic cut-off to define pre-hypertension/hypertension (Figs. 4). Two studies did not propose any diagnostic criteria [40, 47] (Table 3). Although, the 90th percentiles of DBP varied across studies, the 90th percentiles of the included studies spread around the 90th percentile of IDEFICS study definition [5] (Figures: 4a & 4b).
Fig. 4. Reference values for systolic blood pressure (Panel A) and diastolic blood pressure (Panel B) by age and sex (absolute values) The black line shows 90th percentile reference from IDEFICS definition by Ahrens et al., 2014 [5]
Fig. 5. Reference values for HOMA-IR by age and sex (absolute values) The black lines show 50th and 90th percentiles from IDEFICS definition by Ahrens et al., 2014 [5]
Biomarkers for glucose metabolism/insulin resistance
Three studies developed HOMA-IR reference curves for various age groups (Table 3). Due to differences in the age-groups across different studies, these reference curves were not directly comparable. Chissini et al. [50] used 90th percentile as a threshold to identify elevated HOMA-IR values among 12–17 years-old children and set specific cut-off points for MetS at 75th percentile for girls and 90th percentile for boys. Alías-Hernández et al. [52] similarly identified HOMA-IR levels above the 90th percentile as high-risk indicators for metabolic complications in 2–10 years old children. Significant discrepancies were observed between the study-specific 50th and 90th percentiles and the IDEFICS reference percentiles (Fig. 4). Separately, three studies reported HbA1c percentile distributions which showed substantial inter-study variation based on age and sex (Fig. 6). Notably, these studies failed to provide defined cut-offs for identifying individuals with elevated risk [48, 49, 51]. [Figure 6]. The lack of publicly available HbA1c reference values from IDEFICS study did not allow to reconstruct the reference curves for comparison. For fasting glucose, only one study provided constructed percentiles [49]; however, that study did not propose a specific cut-off value to identify high-risk individuals.
Fig. 6. Reference values for HbA1c by age and sex (absolute values) 3rd, 5th, 10th and 90th, 95th and 97th percentile curves for HbA1c from the included studies The black lines show 50th and 90th percentiles from IDEFICS definition by Ahrens et al., 2014 [5]
Biomarkers for Lipid Metabolism
Eight studies provided reference curves for lipid profiles, including TC (8 studies), LDL-C (6 studies), and HDL-C (8 studies). A comparison of the TC reference curves demonstrated good overall agreement for age- and sex-specific 50th and 90th percentiles (Figure S4, Fig. 7 Panel A). While slight variations were noted in the age- and sex-specific HDL-C percentiles across studies, the LDL-C reference values were comparable among the three studies that reported them. Three studies utilized these percentiles to present specific diagnostic criteria for TC, LDL-C, TG, and HDL-C [55, 57, 63] or cut-off points [54, 64], while another three studies did not mention any diagnostic criteria [51, 56, 58]. Dyslipidaemia definitions varied across the included studies, utilizing different thresholds and diagnostic criteria. The overlay plot analysis revealed minimal variation among studies for the 10th and 90th percentiles of TC, LDL-C, and HDL-C. However, due to inherent differences in age stratification, the IDEFICS definition of dyslipidaemia was not directly comparable to other studies’ lipid reference values, particularly in children under 6 or 7 years of age. For children aged 7–11 years, the 90th percentile of the lipid profile biomarkers from the included studies generally clustered around the corresponding 90th reference percentile established by the IDEFICS definition, with the exception of TC.
Fig. 7. Reference values for lipid parameters by age and sex (absolute values) Panel 7A: 10th and 90th percentile curves of the TC from the included studies Panel 7B: 10th and 90th percentile curves of HDL-C from the included studies Panel 7C: 2.5th, 3rd and/or 97th/97.5th percentile curves of LDL-C, from the included studies The black lines show 10th and 90th percentiles reference from Ahrens et al., 2014 [5]
Risk of Bias Assessment
The results of the risk of bias assessment for all included studies are presented in detail in Table S2. Overall, the evidence base was found to have a high level of internal validity, with the vast majority of the 46 included studies rated as having high to moderate quality. Specifically, 35 studies were classified as high quality (scoring 18–20 points), and 10 studies were identified as moderate-to-high quality (15–17 points). Only one study received a score of 14 points, indicating the lowest quality within the included literature.
Discussion
This systematic review provides a comprehensive summary of the recent evidence regarding reference curves for MetS components in paediatric populations. Based on data from 46 studies, notable variations were observed in the reference curves and definitions of abdominal obesity based on waist circumference and impaired glucose metabolism, both across studies and in comparison, to existing definition based on data of the IDEFICS study, comparatively smaller variations were observed for hypertension and dyslipidaemia (TC and HDL-C only) from the existing definitions. Results from this review revealed limited data availability for young age-group (0–4 years), as well as substantial heterogeneity in study methodologies including differences in study design, assays and statistical approaches used to derive reference curves. These findings underscore the need for standardized protocols, with data from covering diverse populations to develop harmonized reference curves for consistent definition of MetS and its components.
Majority of the included studies proposed reference curves on waist circumference, emphasizing its role as an important indicator for abdominal obesity and subsequent risk of chronic diseases. Despite this acknowledgement, varying percentile cut-offs were used to define elevated risk complicating clinical interpretation. Nevertheless, most of the studies adopted the 90th percentile as cut-off for abdominal obesity, which is in line with existing evidence [20, 21] that WC above 90th percentile is associated higher risk of developing cardiovascular diseases in later life. Nonetheless, large variations were observed in 90th percentile of WC across studies, which could be attributed to both the methodological heterogeneity in studies and biological variation (e.g. differences in fat distribution by country or ethnicity). These differences undermine direct comparison between studies and highlight importance of standardized protocols in development of reference curves, to ensure a reliable definition of abdominal obesity in children and adolescents.
The evidence for glucose metabolism markers remains limited. Only small number of studies reported reference curves for biomarkers of glucose metabolism and a corresponding definition of impaired glucose metabolism. Large heterogeneity across studies, including age-specific differences in study samples makes the direct comparison difficult. However, it could point to the methodological and logistical challenges of assessing these biomarkers in paediatric populations especially in children 0–5 years. Still, it is of utmost importance to increase efforts in collecting markers of glucose metabolism in this age group. Previous research has shown that physiological transient insulin resistance develops in children during puberty and decreases again until adulthood, regardless of obesity [65]. The decline in insulin sensitivity during the pubertal period is believed to result in an increase in glucose-stimulated insulin secretion [66]. Given the rising prevalence of type 2 diabetes and the corresponding risk factors, it is important to establish harmonized definition of impaired glucose metabolism in a sample comprising large diverse populations using standardized protocols.
In this review, comparatively consistent reference curves especially 90th and 95th percentile of DBP for some studies were identified that aligned with the established standard IDEFICS study definition [5]. Despite methodological differences in the studies, this consistency for some studies may reflect stricter protocols and/or smaller measurement variations. Similarly, comparatively consistent median (50th) and higher (90th) percentiles were observed for reference curves of TC, HDL-C, and LDL-C. However, differences exist in the definition of lipidemic as some studies used fixed cut-offs whereas others relied on percentiles. Normal cholesterol concentrations vary with age and sex; therefore, fixed cut-offs may under- or over-estimate dyslipidaemia in children [67].
Methods to derive references curves also varied across studies. Studies employed LMS, GAMLSS or other regression approach for reference curves. Among these methods, simple linear regression is not able to capture the skewness of the distributions or non-linear age dependencies. The difference in statistical approaches on modelling the reference curves highlights the need for standardized approaches [68], since these differences can introduce perceived difference in estimated reference values and diagnostic thresholds among different populations. For this review, we chose reference curves proposed by researchers of the IDEFICS study [5] for reference because this is based on internationally derived, harmonized paediatric reference curves based on large multi-center cohort.
Although, the included studies in this review came from large number of countries spanning four continents, representation of studies with biomarkers were significantly low for middle- and lower-income countries (LMIC), especially from Africa. The low availability of data, especially the blood-based biomarker data, from LMIC is a particular concern, given the high proportion of infants, children, and adolescents suffering from stunting, acute malnutrition and micronutrient deficiencies. Many LMIC today are undergoing a coexistence of the double burden of underweight and overweight/obesity exposing these population to the risk of metabolic complications. This is a significant gap in evidence as the overall paediatric population and burden of metabolic disorders is already higher in many of these countries [69, 70]. Lack of studies from these regions preclude the possibility of developing region or ethnicity specific reference curves.
The strengths of this review are the large number of studies included, covering a wide range of countries and regions. This diversity provides a more comprehensive understanding of paediatric health indicators on a global level, offering useful insights into variations in different populations. Moreover, we focused on recently published literature to capture the recent development in the field. However, there are also some limitations. One important limitation is the range of publication years covered by the review since important findings published in years prior to 2018 were not included. We used the BIOCROSS tool to evaluate the quality/risk of bias in the included studies [17]. However, the tool may not be suitable for studies that reuse data. For example, Hu et al. [49] used National Health and Nutrition Examination Survey (NHANES) data for their analysis but did not provide brief description of the study methodology with reference and was subsequently rated as having low quality, using this scale Nevertheless, it should be noted that the overall strength of the evidence base was consistently high, with 45 of the 46 included studies demonstrating high to moderate internal validity. Thus, the potential misclassification of a single secondary analysis study’s quality does not appear to compromise the robust nature of the synthesized findings.Furthermore, the review highlights significant gaps in the evidence base, specifically a lack of data from middle- and lower-income countries and limited biomarker information for children aged 0–4 years. These findings are further complicated by substantial methodological heterogeneity, as variations in study designs, laboratory assays, and statistical approaches—combined with inconsistent percentile cut-offs—hinder direct comparisons and underscore the urgent need for standardized assessment protocols across diverse global populations.
Conclusion
This review identified large variability in the reference curves for defining abdominal obesity and impaired glucose metabolism in paediatric populations. In contrast, the indicators denoting early-life hypertension and dyslipidaemia showed comparatively better consistency with existing definitions, though inter-study variation exists. The variation and inconsistent definitions of various MetS components underscore the need for harmonized evidence-based definition based on a sample of a diverse population. Such reference curves would be key for an early and accurate diagnosis and effective intervention planning for clinicians and health practitioners.
Supplementary Information
Below is the link to the electronic supplementary material.
Supplementary Material 1(DOCX.666 KB)
The reference list from the paper itself. Each links out to its DOI / PubMed record.
- 1Lozano P, Henrikson NB, Morrison CC, Dunn J, Nguyen M, Blasi P, Whitlock EP. Lipid screening in childhood for detection of multifactorial dyslipidemia. a systematic evidence review for the US preventive services task force; 2016.27559550 · pubmed ↗
- 2Population Reference Bureau. 2024 World Population Data Sheet. https://2024-wpds.prb.org/wp-content/uploads/2024/09/2024-World-Population-Data-Sheet-Booklet.pdf Population.