Percutaneous aspiration and sclerotherapy for simple hepatic cysts: a systematic review and meta-analysis
Tomohiro Matsumoto, Rika Yoshimatsu, Marina Osaki, Junki Shibata, Kana Miyatake, Tomoaki Yamanishi, Takuji Yamagami

TL;DR
Percutaneous aspiration and sclerotherapy is a safe and effective treatment for simple hepatic cysts, providing high symptom relief with low complication rates.
Contribution
This study provides a systematic review and meta-analysis of PAS for SHCs, highlighting its efficacy and safety profile.
Findings
PAS achieved an 86.9% pooled rate of symptomatic relief or disappearance.
Cyst volume reduction rate was 86.4%, though with high heterogeneity.
Minor complications occurred in 13.6% for pain and 7.4% for fever.
Abstract
This systematic review aims to assess the efficacy and safety of percutaneous aspiration and sclerotherapy (PAS) for patients with symptomatic simple hepatic cysts (SHCs). We systematically searched the electronic databases of PubMed, Embase, the Cochrane Library and Ichushi-Web for studies published up to November 2024, reporting outcomes of PAS for symptomatic SHCs. The primary outcomes were rates of symptomatic relief or disappearance of symptoms. The secondary outcomes were cyst volume reduction rates and complication rates. Subgroup analyses compared ethanol with the other sclerosants. Single-arm meta-analyses were performed, with meta-regression conducted when substantial heterogeneity (I2 > 50%) was observed. Risk of bias was assessed using the Cochrane RoB2 tool for randomized controlled trials and RoBANS2 for non-randomized studies. Sixteen studies were included. Fourteen…
Genes, proteins, chemicals, diseases, species, mutations and cell lines named across the full text — each resolved to its canonical identifier and authoritative record.
Click any figure to enlarge with its caption.
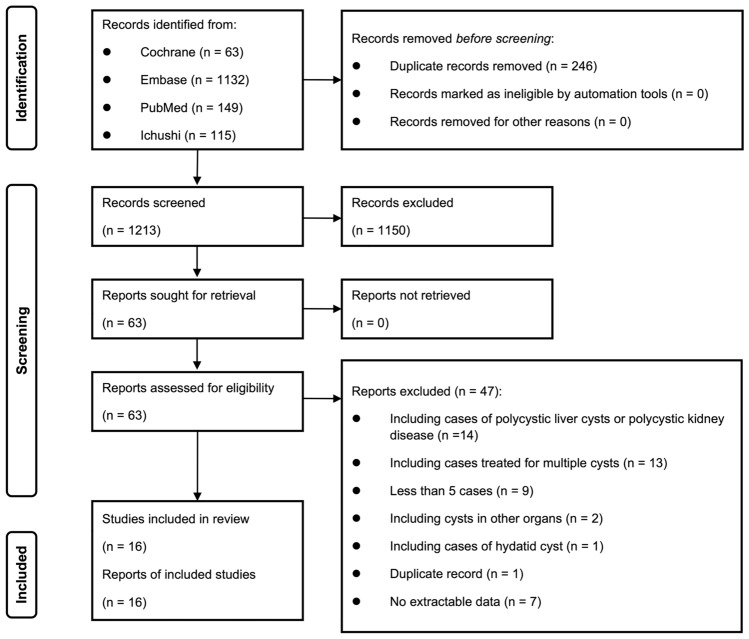 Figure 1
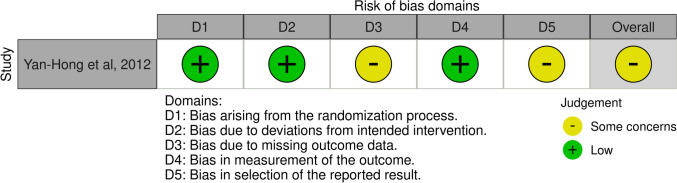 Figure 2
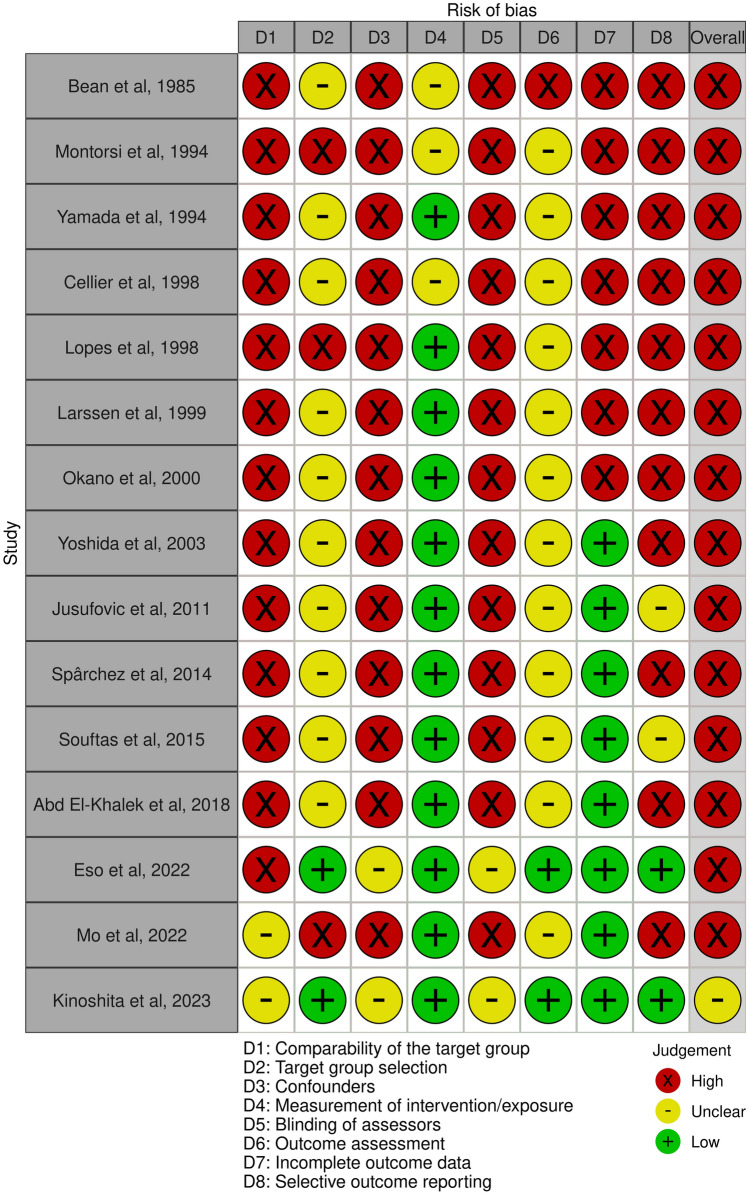 Figure 3
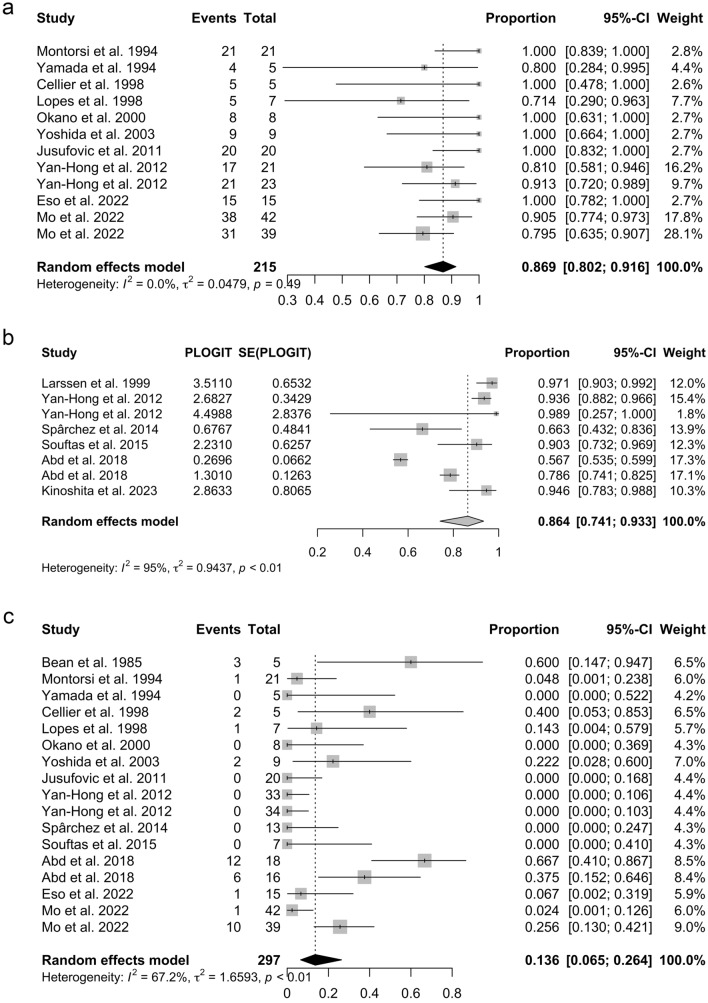 Figure 4
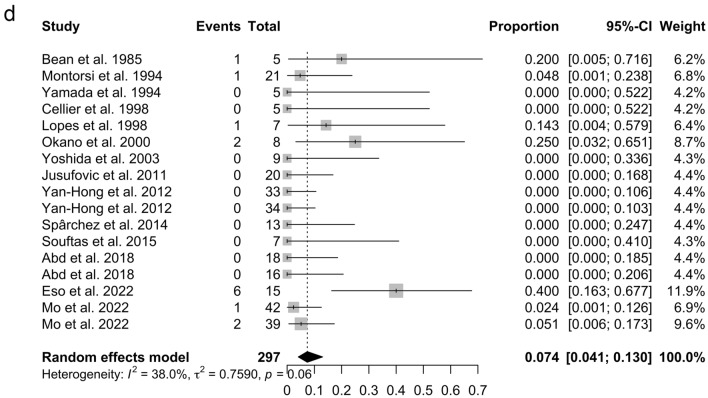 Figure 4
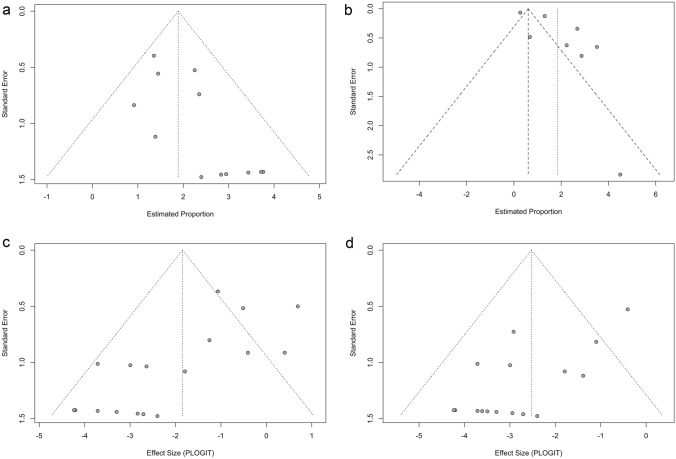 Figure 5
Peer Reviews
No public reviews on file for this paper yet. If you reviewed it on a platform where reviews are public (OpenReview, ICLR, NeurIPS, ICML), you can paste yours below so the community can read it here.
Videos
No videos yet. Explain this paper in a talk, walkthrough, or lecture? Add one.
Taxonomy
TopicsGenetic and Kidney Cyst Diseases · Hedgehog Signaling Pathway Studies · Renal and related cancers
Introduction
Simple hepatic cysts (SHCs), which are among the most commonly diagnosed benign liver lesions, are found in 18% of the general population following abdominal CT scans performed for unrelated conditions [1]. Although most SHCs are asymptomatic, they may become sufficiently large to cause symptoms such as abdominal distension, discomfort, and liver dysfunction [2, 3]. In such cases treatment is required, and there are several options available including percutaneous aspiration and sclerotherapy (PAS), and open or laparoscopic cyst deroofing [4]. Ethanol has long been the most commonly used sclerosant [5]; however, there has been increasing interest in other sclerosants such as minocycline, and tetracycline, which may have potentially fewer side effects or comparable efficacy [6–8]. Both surgical treatments versus PAS for symptomatic SHCs have been the subjects of a systematic review and meta-analysis [4]. To date, no dedicated systematic review and meta-analysis has focused exclusively on PAS for symptomatic SHCs, nor has there been a systematic analysis of how different sclerosants and procedural techniques may impact its efficacy. We aimed to fill this gap by systematically reviewing the available evidence on PAS using various sclerosants in patients with symptomatic SHCs.
Materials and methods
We used guidelines from the Preferred Reporting Items for Systematic reviews and Meta-Analyses (PRISMA) to compile this report. The protocol was registered in PROSPERO (CRD42024585617).
Search strategy
We systematically searched the electronic databases of the Cochrane Library, PubMed, Embase, and Ichushi-Web (Igaku Chuo Zasshi; Japan Medical Abstracts Society) for studies published up to November 2024. The literature search was carried out with the assistance of librarians (Supplementary Table S1).
Inclusion and exclusion criteria
The inclusion criteria were as follows: (1) availability of full-text studies; (2) studies reporting data from PAS for patients with symptomatic SHCs (when studies also included other types of cysts—such as polycystic liver disease or mucinous cystic neoplasms—only patients with SHC were included); (3) studies of PAS for a solitary SHC and studies of PAS for only one cyst among multiple SHCs (in studies containing patients with multiple SHCs, only those patients for whom one cyst was treated were included); (4) studies published in English or Japanese. The exclusion criteria were as follows: (1) case reports; (2) review articles; (3) letters and editorials; (4) studies with a sample size of less than five cases; (5) studies with no extractable data; (6) a mean or median follow-up < 1 month; and (7) studies with data included in subsequent studies or duplicate reports.
Outcomes and data extraction
The primary outcome was the clinical success rate, which was defined as symptomatic relief or disappearance of symptoms. The following secondary outcomes were also investigated: technical success rate (which was defined as procedure completion), major and minor complication rate, and cyst volume reduction rate and recurrence rate.
For each study, two reviewers (T. M. and J. S.) independently retrieved information on the outcomes and study characteristics, including the first author, publication year, study country, study design, and patient characteristics. For all studies, the following data were extracted separately for PAS for SHCs: clinical success, technical success, procedure details of PAS (including type of modality for puncture), whether a needle or catheter was used for sclerosant injection, aspiration volume, type and dosage of sclerosants, number of sessions (a pre-planned multi-procedure treatment was also defined as a single procedure), cyst volume reduction rate, sclerosant retention time, change in patient position, and sclerosant removal status. The complications were categorized in accordance with the classification system of the Cardiovascular and Interventional Radiological Society of Europe (CIRSE), i.e., from grade 1 (no complication) to grade 6 (death). Grades 3–6 were defined as major complications [9].
Risk-of-bias assessment in the included studies
The quality of the included studies was assessed using version 2 of the Cochrane Collaboration tool for randomized controlled trials (RCTs) (RoB2) [10] and the revised Risk of Bias Assessment tool for Non-randomized Studies (RoBANS2) [11]. For the summary of risk of bias using RoBANS2, studies were considered to have an overall low risk of bias if they were classified as low risk in all eight domains. Studies were classified as having an unclear risk of bias if at least one domain was rated as unclear risk, provided that no domains were rated as high risk. Studies were considered to have a high risk of bias if at least one domain was rated as high risk.
Subgroup analyses
Subgroup analyses were conducted where applicable to compare ethanol with other sclerosants.
Statistical analyses
We performed single-arm meta-analyses, incorporating subgroup analysis and meta-regression models to control for confounding variables when comparing treatments. Where comparative studies were available, single-arm data were extracted from those studies and included in the meta-analysis. Considerable between-study heterogeneity was anticipated to impact the primary outcome; we therefore used a random-effects model to pool effect sizes based on the DerSimonian–Laird method. We also used Knapp–Hartung adjustments to calculate the confidence interval (CI) around the pooled effect. Forest plots were used to display outcome data, and the following heterogeneity measures were assessed: τ^2^, I^2^, and Q-statistics. For the Q statistic, a p value of < 0.05 was considered statistically significant. For the I^2^ statistic, values of 25% were defined as low heterogeneity, 25–50% were defined as moderate, and 50% were defined as high heterogeneity. Meta-regression analysis was conducted to identify the source of inter-study heterogeneity when I^2^ was greater than 50%. For meta-regression analysis, a value of p < 0.05 was set as the threshold for identification of the source of heterogeneity. Funnel plots and the Egger test were used to analyze publication bias; values of p < 0.05 were considered significant in the Egger test. The Egger test and meta-regression analysis were performed if at least four studies were selected for each meta-analysis. The same method was also used for analysis of secondary outcomes. For sensitivity analyses, we excluded studies with fewer than ten cases to reduce the impact of small case series, and studies published before 2000 to account for changes in sclerotherapy techniques and imaging guidance over time. Descriptive and basic statistics were run in Microsoft Excel (version16.94). The meta package of R software (version 4.4.0; R Foundation for Statistical Computing) was used for meta-analyses. Quality assessment plots were produced using risk-of-bias visualization ‘robvis’ [12].
Results
Search results
Initial literature searches identified 1459 records, but elimination of duplicates yielded 1213 studies. Following the evaluation of titles and abstracts, 1150 studies were eliminated, leaving 63 of these records to undergo a full-text review. Finally, 47 studies were excluded by applying the eligibility criteria, leaving 16 studies for systematic review and meta-analysis of the available evidence on PAS using various sclerosing agents in patients with symptomatic SHCs [6–8, 13–25] (Fig. 1).Fig. 1. The preferred reporting items for systematic reviews and meta-analyses (PRISMA) flow diagram of the article selection process
Risk-of-bias assessment
One study, which had reported RCT, was flagged by RoB2 as having some concerns (Fig. 2). Seven of the included studies were single-arm retrospective studies, four were single-arm prospective studies, two were retrospective cohort studies, and two were prospective cohort studies (Table 1). The bias of selected studies was assessed as high risk (n = 14) or unclear risk (n = 1) by RoBANS2 (Fig. 3).Fig. 2. Risk-of-bias assessment using version 2 of the Cochrane Risk of Bias Tool for randomized controlled trials (RoB2). Green (+) indicates low risk of bias; yellow (-) indicates unclear risk of bias; and red (×) indicates high risk of biasTable 1The characteristics of included articles for the present systematic review and meta-analysisAuthorStudy typeStudy periodCountryNo. of patientsMaleFemaleMean ageBean et al., 1985RSingle arm1982–1984United States5 of 62363Montorsi et al., 1994RSingle arm1987–1991Italy21 of 2161553Yamada et al., 1994RSingle arm1990–1992Japan5 of 90556.6Cellier et al., 1998RSingle arm1992–1994France5 of 82364.8Lopes et al., 1998RSingle arm1993–1996Portugal7 of 72552.6Larssen et al., 1999PSingle arm1993–1998Norway11 of 1111065.3Okano et al., 2000RSingle arm1986–1996Japan8 of 81771.1Yoshida et al., 2003RSingle arm1989–1998Japan9 of 92758.2Jusufovic et al., 2011PSingle armNRBosnia and Herzegovina20 of 2071352.9Yan-Hong et al., 2012RCTTwo armNRChina33 of 33274061.834 of 34Spârchez et al., 2014PSingle arm2008–2013Romania13 of 1321157.7Souftas et al., 2015PSingle armNRGreece7 of 141662.7Abd et al., 2018PTwo arm Cohort2013–2015Egypt18 of 70UnknownUnknownUnknown16 of 70Eso et al., 2022PTwo arm Cohort2016–2021Japan15 of 1521365.3Mo et al., 2022RTwo arm Cohort2013–2019China42 of 42281454.339 of 39231654.6Kinoshita et al., 2023RTwo arm Cohort2015–2019Japan7 of 112572.7No. of patients the number of patients extracted and included in this systematic review from each study, NR not reported, P prospective, R retrospective, RCT randomized controlled trialFig. 3Risk-of-bias assessment using the revised Risk of Bias Assessment tool for Non-randomized Studies (RoBANS2). Green (+) indicates low risk of bias; yellow (-) indicates unclear risk of bias; and red (×) indicates high risk of bias. For the summary of risk of bias, studies were considered to have an overall low risk of bias (green +) if they were classified as low risk in all eight domains. Studies were considered to have an unclear risk of bias (yellow -) if at least one domain was rated as unclear risk (but no domains were rated as high risk) and as high risk (red ×) if at least one domain was rated as high risk
Characteristics of the included studies
The 16 selected studies involved a total of 315 cases (Table 1); these comprised 38% males and 62% females with an average-weighted mean age of 58.7 years. Among the 16 included studies, 7 were from Asia (Japan and China) and 9 were from other regions.
The details of the procedure are summarized in Table 2. Ultrasound guidance was used for cyst puncture in 13 studies [6–8, 13–20, 23, 25], while 2 studies performed puncture under CT guidance [21, 24]. In 5 studies, the sclerosant was injected using a needle [7, 8, 14, 16, 20], while in 11 studies, it was injected via a catheter [6, 13, 15, 17–19, 21–25]. Among the catheter group, pigtail catheters were commonly used [13, 17–19, 21, 23–25]. Ethanol was used in seven studies and was the most commonly studied sclerosant [6, 13, 15, 16, 19, 22, 24]. Other sclerosants investigated included minocycline chloride in four studies [7, 14, 17, 25], polidocanol in two studies [20, 23], tetracycline chloride in one study [8], 20% hypertonic saline solution in one study [18], OK-432 in one study [24], combination of 15% hypertonic saline and bleomycin in one study [21], and a combination of ethanol and tetracycline chloride in one study [22]. The injection volume of ethanol was set at 10–30% of the cyst volume or aspirated volume (k = 6) [6, 13, 15, 19, 22, 24] with a maximum dose of 100 mL (k = 4) [15, 16, 19, 22]. Among studies using ethanol as a sclerosant, the single-session injection method was the most used [5, 12, 14, 15, 18, 21]. In one study, repeated aspiration and instillation of ethanol was performed until the estimated alcohol concentration exceeded 80% [19]. The retention time of ethanol was 20 min in most studies (k = 5) [6, 16, 19, 22, 24]. The number of treatment sessions was most commonly reported as a single session (k = 5) [6, 13, 15, 19, 24]. Although the treatment was performed in a single session, one study adopted a two-step method in which ethanol was injected twice at a 12-h interval [24]. In one study, either one or two sessions were performed [16], and in another study, one, two, or three sessions were conducted [22]. Patient repositioning during ethanol injection was reported in four studies [6, 13, 16, 22], whereas the other three studies did not mention it [15, 19, 24]. Ethanol was aspirated after the procedure in all seven studies [6, 13, 15, 16, 19, 22, 24]. Minocycline hydrochloride was used in doses ranging from 100 to 500 mg. In two studies, the sclerosant was not aspirated [7, 14]. In two other studies, aspiration was not mentioned [17, 25]. Patient repositioning during both one and two sessions of minocycline hydrochloride injection was reported. Although the treatment was repeated daily for 7–8 days in one study [17], it was regarded as a single session in our analysis. There were reports of polidocanol being injected as a 3% solution [20] and as foam [23]. In one study using 3% polidocanol solution, 4–8 mL was injected per session and the sclerosant was not aspirated [20]. In one study using polidocanol foam (16 mL of 1% polidocanol per session), the catheter was left unclamped for open drainage until the next morning [23].Table 2. Procedure details of percutaneous aspiration and sclerotherapyAuthorModality for punctureDevices used for sclerosant injectionReduction rateType of SclerosantTreatment strategyNo. of sessionsSclerosant retention time (min)Patient position changeSclerosant removal statusBean et al., 1985USC (side hole)NR95% EtOH< 400 mL: Inject 25% of the cyst volume> 400 mL: Two or more treatments at the same session120YesYesMontorsi et al., 1994USC (pigtail)NR95% EtOHInject 25% of the cyst volume120–30YesYesYamada et al., 1994USN (21G)NRMINO200 mg dissolved in 9 mL saline, mixed with 1 mL of 2% mepivacaine hydrochloride100–600 mg (depending on its size)Repeated aspiration and injection of remaining cystic fluid including MINO several times1, 2NANRNoCellier et al., 1998USN (22G)NRMINO100–500 mg dissolved in 10 mL saline1 mg MINO per 1 mL cyst contentMaximum dose: 500 mg10 mL of 1% lidocaine into the cyst1NANRNoLopes et al., 1998USN (22G)NRTC1000 mg dissolved in 10–80 mL saline1NANRNRLarssen et al., 1999USC (details unknown)97.1 ± 6.196% EtOHInject 10% of the cyst volumeMaximum dose: 100 mL1Up to 20NRYesOkano et al., 2000USN (21G)NR99% EtOH20–100 mL1, 220YesYesYoshida et al., 2003USC (pigtail)NRMINO200 mg dissolved in 10 mL salineFlushed with 10 mL of salineCatheter clamped for 30 minProcedure Repeated daily for 7–8 days1NANRNRJusufovic et al., 2011USC (pigtail)96.320% HSInject 30% of the aspirated volumeMaximum dose: 100 mL1120YesYesYan-Hong et al., 2012USC (pigtail)93.6 ± 11.899% EtOHInfused 10–15 mL 1% lidocaine20–30% of the volume of the aspirated fluidMaximum dose: 100 mL120NRYesC (pigtail)98.9 ± 1.899% EtOHInfused 10–15 mL 1% lidocaineRepeated aspiration and instillation of alcohol until the estimated alcohol concentration exceeded 80%1NRNRYesSpârchez et al., 2014USN (18G)66.3 ± 39.03% PLDInject 2–4 V (4–8 mL)1, 2NANRNoSouftas et al., 2015CTC (pigtail)90.3 ± 14.515% HS and BLMDrained by gravity for 24 hTwo injections and reabsorptions of 15% NaCl (20–25% of the cyst volume)Three times repetition of the same procedure with the addition of bleomycin hydrochloride (100 mg/m^2^)13–5NRYesAbd et al., 2018NRC (details unknown)56.7 ± 6.995% EtOHInject 20–25% of the aspirated fluidMaximum dose: 100 mL1, 2, 320YesYesC (details unknown)78.6 ± 8.595% EtOH and TCLower amount of alcoholMixed with saline in 10 mL and injected without reaspiration1,2NRYesNAEso et al., 2022USC (pigtail)NRPLD foam4 mL of 1% polidocanol with 8–12 mL of CO_2_16 mL of 1% polidocanol per sessionCatheter was clamped for 15–20 min after the foam sclerosant injectionCatheter unclamped for open drainage until the next morning1, 2, 3NAYesNAMo et al., 2022CTC (pigtail)NROK-4320.1 mg of OK-432 dissolved in 10 mL of 0.9% saline0.1 mg OK-432 per 10 mL cyst contentMaximum dose: 100 mL1NANRNoC (pigtail)NR99% EtOHInject 25% of the aspirated fluidPerformed twice with an interval of 12 hLeft open for natural drainage between the injectionsMaximum single dose: 50 mL120NRYesKinoshita et al., 2023USC (pigtail)94.6 ± 10.9MINOInject 500 mg of MINO dissolved in 20 mL of saline1, 2NRNRNRBLM bleomycin, C catheter, EtOH ethanol, G gauge, HS hypertonic saline, MINO minocycline hydrochloride, N needle, NA not applicable, NR not reported, PLD polidocanol, TC tetracycline chloride
Analysis of the primary and secondary outcomes
The pooled clinical success rate was 86.9% (95% CI 80.2–91.6%, I^2^ = 0%, p = 0.49) (Fig. 4a). There was a significant publication bias for the pooled clinical success rate when assessed by Egger’s test (p = 0.017) and the funnel plot (Fig. 5a). The technical success rate was 100% in the included studies. The pooled cyst volume reduction rate was 86.4% (95% CI 74.1–93.3%, I^2^ = 95%, p < 0.01) (Fig. 4b). There was a significant publication bias for the pooled cyst volume reduction rate when assessed by Egger’s test (p = 0.037) and the funnel plot (Fig. 5b). Meta-regression analysis of the pooled cyst volume reduction rate revealed no significant association with sample size, publication year, or study region (Asia vs. other regions) (Table 3). The overall pooled rate of pain and fever classified as a minor complication was 13.6% (95% CI 6.5–26.4%, I^2^ = 67.2%, p < 0.01) (Fig. 4c) and 7.4% (95% CI 4.1–13.0%, I^2^ = 38%, p = 0.06) (Fig. 4d), respectively. There was a significant publication bias for the overall pooled rate of pain and fever when assessed by Egger’s test (p = 0.002 and 0.0008, respectively) and the funnel plots (Fig. 5c, 5d). Meta-regression analysis of the pooled proportion of pain revealed no significant association with sample size, publication year, or study region (Asia vs. other regions) (Table 3). Alcohol intoxication as a minor complication was reported in 4 out of 18 patients (22%) in one of the included studies [22]. Nausea as a minor complication was reported in one out of 15 patients (6%) in one of the included studies [23]. There were no major complications in any of the studies, and recurrence (1 out of 7 cases at 3 months) was only observed in one study [8].Fig. 4. Forest plots of primary and secondary outcomes of percutaneous aspiration and sclerotherapy (PAS) for simple hepatic cysts (SHCs). a The forest plot of the pooled clinical success rates of PAS for SHCs. b The forest plot of the pooled cyst volume reduction rate of PAS for SHCs. c The forest plot of the pooled pain rate of PAS for SHCs. d The forest plot of the pooled fever rate of PAS for SHCsFig. 5Funnel plots of the primary and secondary outcomes of percutaneous aspiration and sclerotherapy (PAS) for simple hepatic cysts (SHCs). a The funnel plot of the pooled clinical success rates of PAS for SHCs. b The funnel plot of the pooled cyst volume reduction rate of PAS for SHCs. c The funnel plot of the pooled pain rate of PAS for SHCs. d The funnel plot of the pooled fever rate of PAS for SHCsTable 3Meta-regression analysis of volume reduction rate and pain rateVariableR^2^ (%)95% CIp valueVolume reduction ratePublication year30.2− 0.21 to 0.010.08Sample size0− 0.09 to 0.100.85Region (Asia or elsewhere)31.1− 3.00 to 0.120.07PainPublication year0− 0.09 to 0.050.56Sample size2.7− 0.1 to 0.020.15Region (Asia or elsewhere)18.4− 0.3 to 2.90.09CI confidence interval
Subgroup analysis
Subgroup analysis comparing ethanol and other sclerosants for clinical success rate, cyst volume reduction rate, and rate of pain and fever as minor complications (Table 4) revealed no significant differences. However, substantial heterogeneity was observed for pain incidence in the ethanol subgroup (I^2^ = 83.6%), indicating variability in study results. Similarly, high heterogeneity was observed for cyst volume reduction rate in both the ethanol group (I^2^ = 95.9%) and the other sclerosant group (I^2^ = 60.3%).Table 4. Subgroup analysis of PAS for SHCOutcomeRate (%)95% CII^2^ (%)p for subgroup analysisClinical success rate (k = 12)0.32Ethanol (k = 5)84.370.0–92.59.4Other sclerosants (k = 7)89.479.1–95.00Volume reduction rate (k = 8)0.48Ethanol (k = 4)91.057.6–98.795.9Other sclerosants (k = 4)82.469.6–90.560.3Rate of pain (k = 17)0.37Ethanol (k = 7)9.91.5–45.183.6Other sclerosants (k = 10)19.610.6–33.323.7Rate of fever (k = 17)0.45Ethanol (k = 7)5.71.7–17.333.2Other sclerosants (k = 10)8.94.1–18.239.4CI confidence interval, PAS percutaneous aspiration and sclerotherapy, SHC simple hepatic cyst
Sensitivity analyses
The results of the sensitivity analyses largely overlapped with those of the primary analyses, showing similar outcomes and indicating the robustness of the findings (Supplementary Table S2).
Discussions
This systematic review and meta-analysis evaluated the efficacy and safety of PAS for symptomatic SHCs and examined differences between ethanol and other sclerosants in subgroup analyses. Our findings provide insights into PAS for symptomatic SHCs and may serve as a valuable reference for clinical decision-making. However, the pooled clinical success rate in our meta-analysis was lower than that reported by Furumaya et al. [4]. We believe that this discrepancy may be explained by differences in the meta-analysis methodology, including our use of the DerSimonian–Laird random-effects model with Knapp–Hartung adjustment instead of the Freeman–Tukey double-arcsine transformation. In addition, we included several recently published studies (e.g., Mo et al. [24]) with relatively lower success rates but larger sample sizes, which contributed higher weights to the pooled estimate. Although further research is warranted, PAS appears to be a relatively safe and effective treatment option for symptomatic SHCs. In line with Furumaya et al. [4], a step-up approach, in which surgical interventions such as laparoscopic cyst deroofing are reserved for cases of recurrence after PAS, may be considered; however this needs confirmation through comparative studies.
The most studied sclerosant in this systematic review was ethanol, which destroys the epithelial lining of the cystic cavity, thereby inhibiting cystic fluid secretion [6]. Ethanol was most often introduced via the single-session injection method, as it is simple and can be completed quickly [6, 13, 15, 16, 19, 22]. The ethanol retention time was generally around 20–30 min [6, 15, 16, 19, 22], and some studies also mentioned patient repositioning during the procedure [6, 13, 16, 22]. Therefore, the single-session injection method using ethanol is a relatively robust technical procedure. None of the included studies reported major complications, either in the ethanol group or in other sclerosant group, suggesting a favorable safety profile for both approaches. Ethanol, however, may leak from the cystic cavity into the peritoneum or bile ducts and be systemically absorbed, potentially leading to hypotension, liver abscess, pleuritis, cholangitis, and intracystic hemorrhage [26]. Subgroup analysis revealed no significant differences in the clinical success rate (p = 0.32) and volume reduction rate (p = 0.48) between ethanol and other sclerosants. For clinical success, heterogeneity was low in the ethanol group (I^2^ = 9.4%) and absent in the other sclerosant group (I^2^ = 0%), suggesting that the pooled estimates were relatively consistent across studies. In contrast, volume reduction rate showed considerable heterogeneity in both groups: I^2^ = 95.9% in the ethanol group and I^2^ = 60.3% in the other sclerosant group. In the ethanol group, treatment protocols included not only the single-session injection method, but also other techniques, while the number of studies on alternative sclerosants was limited and procedural techniques varied widely across those studies. Therefore, the subgroup results for volume reduction rates should be interpreted with caution. Moreover, subgroup analysis revealed no significant differences in minor complications, such as pain (p = 0.37) and fever (p = 0.45), between ethanol and other sclerosants. However, the incidence of pain in the ethanol group showed substantial heterogeneity (I^2^ = 83.6%), likely due to differences in pain assessment criteria across studies. Thus, careful interpretation of these findings is warranted. Despite variability in pain incidence and volume reduction rates, ethanol remains the most technically stable and widely studied sclerosant for PAS in the treatment of symptomatic SHCs. However, alternative sclerosants could also be effective, given our findings that they elicited similar symptom relief rates and cyst volume reduction rates as ethanol. Further studies are needed to better evaluate the efficacy and safety of these alternative sclerosants.
Due to insufficient data on mean age and sex ratio in some studies, meta-regression analyses could not be performed for these factors in relation to cyst volume reduction and pain. Although we explored potential regional heterogeneity through meta-regression, the studies from Asia were limited to Japan and China, which may limit the generalizability of our findings across the entire Asian region. Furthermore, even after performing a meta-regression analysis using the available data, no significant factors were identified to explain the heterogeneity in cyst volume reduction and pain. This suggests that the clinical outcomes of PAS may be influenced by factors beyond these common variables, which were not examined in this study. In particular, treatment strategies varied among the included studies [15, 19–22, 25], potentially affecting the assessment of cyst volume reduction. Therefore, standardizing future treatment strategies will be essential to ensure a more accurate evaluation of PAS outcomes.
Significant publication bias was observed across all outcomes in this study. This bias may be attributed to the tendency for positive results to be published, while negative results are often rejected or not even submitted. This limitation highlights the need for a more balanced and comprehensive evidence base. Additionally, the limited number of comparative studies and the predominance of retrospective designs may have introduced further biases, potentially affecting the reliability of the findings. Future high-quality prospective studies with standardized evaluation criteria are needed to confirm these results and further assess the efficacy and safety of different sclerosants.
This study has several limitations. First, our systematic review and meta-analysis focused on symptomatic relief or the disappearance of symptoms as the primary outcome, which is a subjective measure. Ideally, assessments should be conducted using validated tools such as the visual analog scale (VAS), quality of life (QOL) scores, or symptom evaluation scales. However, none of the included studies utilized these measures for evaluation. Future studies are expected to incorporate these standardized measures. Second, most of the included studies had a retrospective design and a high overall risk of bias. Third, only five comparative studies were identified, limiting the ability to conduct comparative meta-analyses. Consequently, this study focused on obtaining single-arm pooled estimates and performing subgroup analyses. Given the predominance of single-arm studies, further prospective comparative studies are warranted to confirm these findings. Despite these limitations, this systematic review and meta-analysis provides valuable insights into the current clinical utility of PAS for symptomatic SHCs.
In conclusion, our study suggests that PAS appears to be a relatively safe and effective treatment option for patients with symptomatic SHCs and provides high rates of symptomatic relief with low complication rates.
Supplementary Information
Below is the link to the electronic supplementary material.Supplementary material 1 (DOCX 32 KB)