A novel vascular model yields increased MR perfusion metrics compared to conventional dynamic susceptibility contrast algorithms in untreated glioblastoma
Jonas Reis, Robert Stahl, Katharina J Müller, Philipp Karschnia, Nico Teske, Antonia Neubauer, Louisa von Baumgarten, Niklas Thon, Florian Ringel, Thomas Liebig, Nathalie L Albert, Patrick N Harter, Robert Forbrig

TL;DR
A new MRI model shows better detection of blood flow in brain tumors compared to standard methods, which could improve diagnosis and treatment.
Contribution
A novel Bayesian-based vascular model improves perfusion metric estimation in untreated glioblastoma compared to conventional DSC algorithms.
Findings
NVM produced higher median normalized perfusion values than vendor algorithms (P < .001).
NVM-derived rCBV was significantly higher at 3.0 T than at 1.5 T (P = .008).
NVM showed enhanced hotspot delineation and excellent inter-rater reliability (κ and ICC ≥0.86).
Abstract
Malignant gliomas are heterogeneous brain tumors with extensive neovascularization. Conventional gradient-echo dynamic susceptibility contrast (GRE-DSC) perfusion MRI may underestimate microvascular alterations. We hypothesized that a novel vascular model (NVM), based on Bayesian voxel-wise transit time distribution analysis, could yield higher perfusion metrics in untreated isocitrate dehydrogenase (IDH)-wild-type glioblastoma compared to standard vendor GRE-DSC algorithms. In this retrospective, single-center study, 89 patients with neuropathologically confirmed glioblastoma underwent pretherapeutic GRE-DSC perfusion MRI at 1.5 or 3.0 T. Perfusion maps were generated using both the NVM and default vendor algorithms. Using co-registered T1-post-contrast and T2/FLAIR images, two neuroradiologists independently assessed perfusion conspicuity of color-coded maps for each algorithm and…
Genes, proteins, chemicals, diseases, species, mutations and cell lines named across the full text — each resolved to its canonical identifier and authoritative record.
Click any figure to enlarge with its caption.
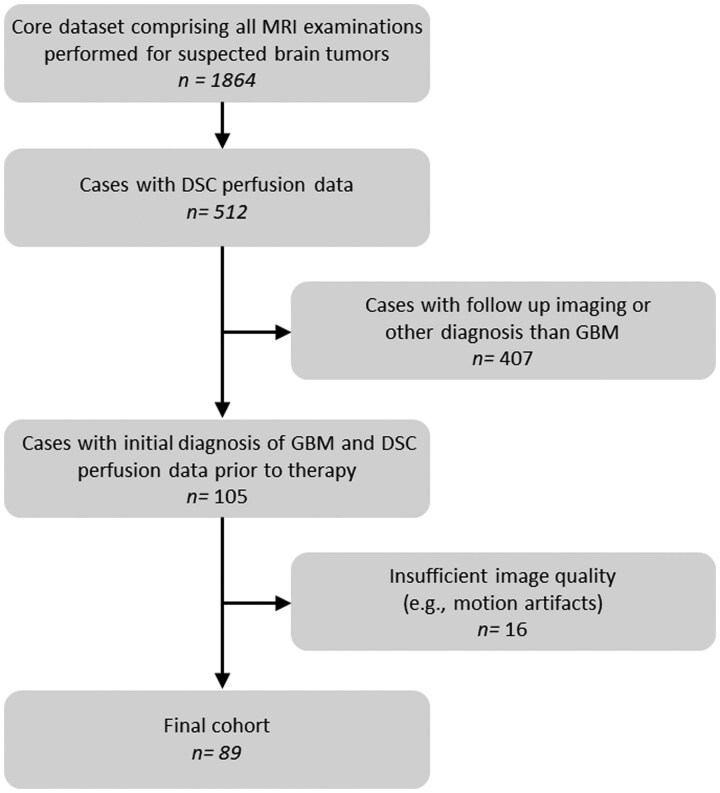 Figure 1
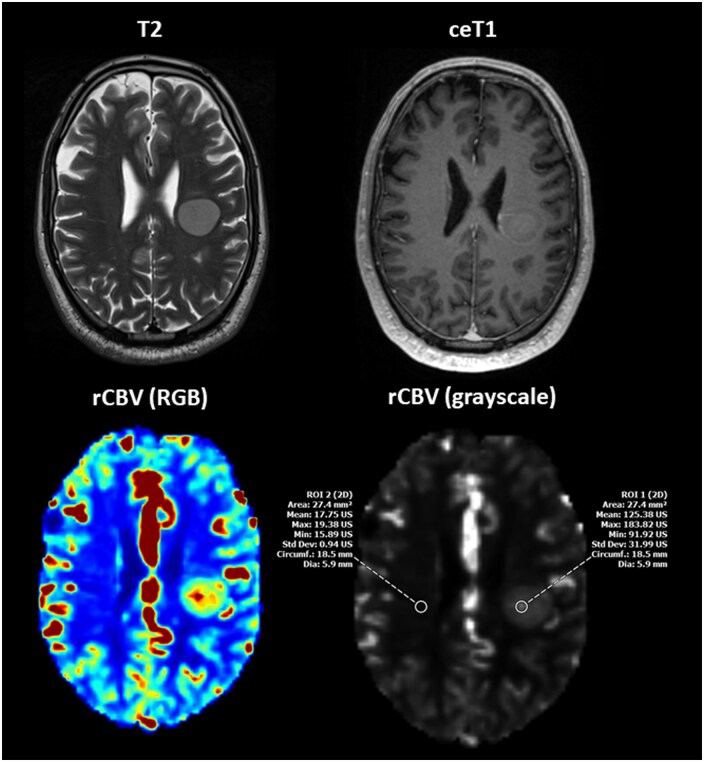 Figure 2
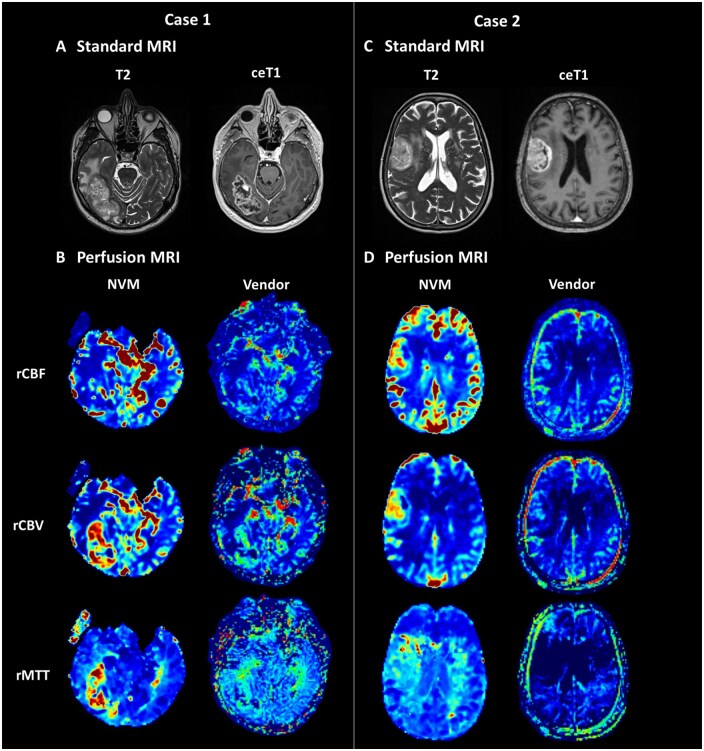 Figure 3
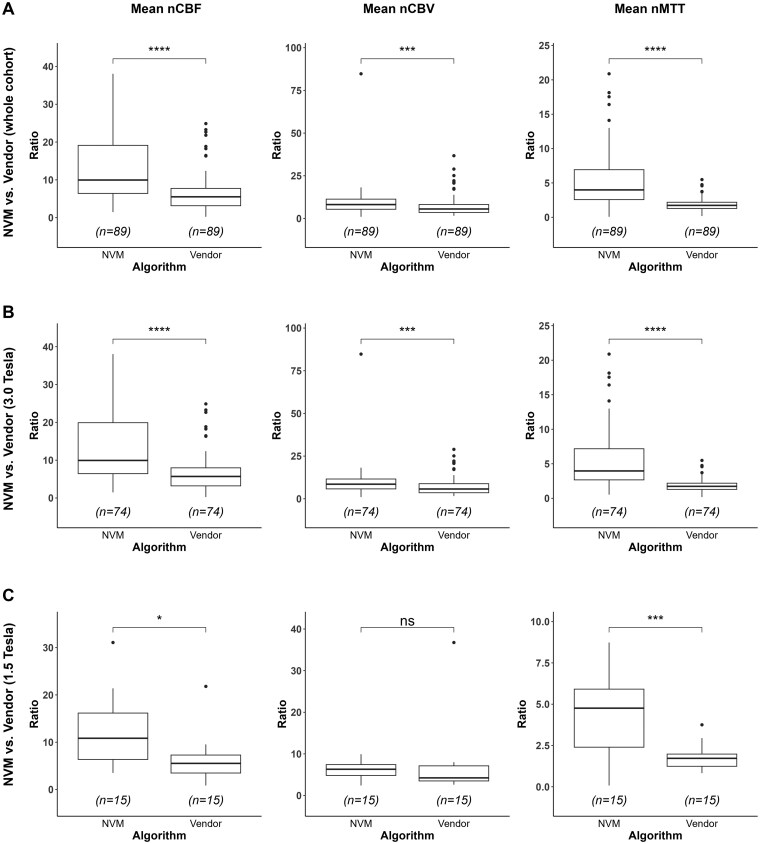 Figure 4
| Scanner | TR (ms) | TE (ms) | Flip angle (°) | Temporal resolution (s) |
|---|---|---|---|---|
| GE Signa HD | 1400 | 20 | 60 | 1.40 |
| Siemens Magnetom Vida | 1600 | 30 | 90 | 1.60 |
| Siemens Magnetom Sola fit | 2770 | 31 | 90 | 2.77 |
| Age (years) | 66.0 ± 11.9 (39-89) |
|---|---|
| Sex | |
| Female | 37 (41.6%) |
| Male | 52 (58.4%) |
| TERT promoter | |
| C228T mutation | 51 (57.3%) |
| C250T mutation | 25 (28.1%) |
| no mutation | 11 (12.4%) |
| n.a. | 2 (2.2%) |
| MGMT promoter | |
| No/partial methylation | 58 (65.2%) |
| methylation | 31 (34.8%) |
| Ki-67 proliferation index | |
| 0 | 3 (3.4%) |
| 1 | 21 (23.6%) |
| 2 | 55 (61.8%) |
| 3 | 10 (11.2%) |
| Neuropathological diagnosis | |
| Histological and molecular criteria | 85 (95.5%) |
| Molecular criteria only | 4 (4.5%) |
| NVM | Vendor |
| |
|---|---|---|---|
| Image quality | |||
| rCBF 1) | 2 [1; 2] | 1 [0.5; 1] |
|
| rCBV 1) | 2 [2; 2] | 1 [1; 1] |
|
| rMTT 1) | 2 [1; 2] | 0 [0; 1] |
|
| Signal ratio | |||
| All scanners | |||
| nCBF (mean) 2) | 9.96 [6.42; 19.13] | 5.52 [3.16; 7.75] |
|
| nCBV (mean) 2) | 8.15 [5.41; 11.33] | 5.56 [3.52; 8.18] |
|
| nMTT (mean) 2) | 3.99 [2.57; 6.92] | 1.73 [1.29; 2.19] |
|
| 3.0 T | |||
| nCBF (mean)3) | 9.93 [6.44; 19.91] | 5.69 [3.20; 7.97] |
|
| nCBV (mean)3) | 8.54 [5.80; 11.58] | 5.73 [3.54; 8.83] |
|
| nMTT (mean)3) | 3.96 [2.67; 7.18] | 1.73 [1.29; 2.19] |
|
| 1.5 T | |||
| nCBF (mean)4) | 10.83 [6.36; 16.17] | 5.52 [3.48; 7.29] |
|
| nCBV (mean)4) | 6.31 [4.82; 7.42] | 4.23 [3.50; 7.12] | .107 |
| nMTT (mean)4) | 4.76 [2.40; 5.91] | 1.72 [1.24; 1.98] |
|
| GE MRI1) | Siemens MRI2) |
| |
|---|---|---|---|
| Vendor at 3.0 T | |||
| nCBF (mean) | 5.53 [2.97; 8.19] | 6.17 [3.98; 7.08] | .45 |
| nCBV (mean) | 4.65 [3.15; 8.15] | 6.95 [5.67; 9.57] |
|
| nMTT (mean) | 1.72 [1.29; 2.18] | 1.74 [1.31; 2.52] | .59 |
| NVM at 3.0 T | |||
| nCBF (mean) | 9.60 [4.70; 20.17] | 10.39 [7.58; 19.13] | .27 |
| nCBV (mean) | 8.55 [5.77; 11.36] | 8.44 [5.87; 11.58] | .92 |
| nMTT (mean) | 3.79 [2.57; 7.26] | 4.50 [6.92; 17.54] | .6 |
Peer Reviews
No public reviews on file for this paper yet. If you reviewed it on a platform where reviews are public (OpenReview, ICLR, NeurIPS, ICML), you can paste yours below so the community can read it here.
Videos
No videos yet. Explain this paper in a talk, walkthrough, or lecture? Add one.
Taxonomy
TopicsAdvanced MRI Techniques and Applications · MRI in cancer diagnosis · Advanced Neuroimaging Techniques and Applications
Magnetic resonance imaging (MRI), including dynamic susceptibility contrast (DSC) perfusion, is a cornerstone in the diagnosis and monitoring of glioblastoma as it provides detailed insights such as tumor morphology, vascularization, metabolism, and treatment response. DSC perfusion applies the so-called indicator-dilution theory, interpreting the first-pass T_2_ signal drop after an intravascular gadolinium bolus as a surrogate concentration-time curve.1^,^2 Among available MRI perfusion techniques, gradient-echo DSC (GRE-DSC) is most widely used to quantify cerebral blood flow (CBF), cerebral blood volume (CBV) and mean transit time (MTT).3 Relative CBV (rCBV) is particularly valuable: elevated values correlate with micro-vascular density, tumor grade and molecular characteristics as well as patient prognosis4-7 and help to distinguish true progression from treatment-related changes.8^,^9
Conventional GRE-DSC post-processing relies on singular-value-decomposition (SVD) deconvolution, which is delay-sensitive10 and prone to oscillatory residue functions of limited physiological plausibility.11 To overcome both acquisition and analysis shortcomings, a Bayesian Novel Vascular Model (NVM) was developed that fits a gamma-distributed capillary transit-time residue and outputs capillary-transit-time heterogeneity (CTH) from core GRE-DSC data.12 CTH is clinically relevant because widening of the transit-time distribution impairs oxygen extraction and can precipitate ‘malignant’ micro-vascular shunting.13
Thus—alongside CBF, CBV, and MTT—the NVM is particularly capable to generate oxygenation-related metrics (eg oxygen-extraction fraction [OEF] and cerebral metabolic rate of oxygen [CMRO_2_]) from CTH. These metrics have shown promise in stroke and glioma imaging,12^,^13 and may help discriminate true glioblastoma progression from pseudoprogression or differentiate de novo tumors from recurrent lesions.14^,^15
The primary objective of this study is to directly compare NVM-derived CBF, CBV and MTT measurements of tumor hotspots with standard vendor algorithm estimates in untreated IDH-wild-type glioblastoma patients. We hypothesize that these perfusion metrics differ systematically of each other, reflecting the NVM’s proposed enhanced ability to detect microvascular perfusion abnormalities.
Material and Methods
Patients
In this retrospective, single-center study we analyzed GRE-DSC perfusion MRI datasets of patients with first diagnosis of IDH-wild-type glioblastoma acquired between January 2019 and September 2024. Regarding patient selection, a database was created by merging the results of a PACS full-text and sequence search, respectively. The resulting patient pool was then filtered by cross-referencing clinical and histological data. Only patients with histologically confirmed and/or molecularly characterized IDH-wild-type glioblastoma who underwent GRE-DSC perfusion MRI prior to any therapeutic intervention were included. Neuropathologically, molecular characterization was performed according to the latest WHO CNS tumor classification.16 Out of the resulting cases, datasets exhibiting motion artifacts, absence of hyperperfusion in the target regions, or other substantial imaging distortions were excluded. Detailed inclusion and exclusion criteria are presented in Figure 1.
Flowchart of the patient selection process for this retrospective study. The diagram shows how 89 patients with untreated IDH-wildtype glioblastoma were identified, screened for eligibility, and ultimately included or excluded based on predefined criteria (eg motion artifacts, missing hyperperfusion). DSC = dynamic susceptibility contrast; GBM = glioblastoma; n = number.
Imaging Acquisition
MRI was performed on three scanners: Signa HD (3 Tesla (T); GE Healthcare, Illinois, USA), Magnetom Vida (3 T; Siemens Healthineers, Erlangen, Germany) and Magnetom Sola Fit (1.5 T; Siemens Healthineers). The standard protocol comprised T2 and T2-FLAIR (fluid-attenuation inversion recovery) sequences as well as non-contrast and contrast-enhanced T1-weighted imaging. GRE-DSC perfusion was acquired with the vendor-recommended tumor protocols summarized in Table 1. All GRE-DSC runs used gadobutrol (1.0 mmol ml^−1^; Gadovist, Bayer Vital, Leverkusen, Germany) with a 0.05 mmol kg^−1^ preload bolus followed by a 0.1 mmol kg^−1^ dose at 3-5 ml s^−1^, chased by 20 ml saline.
Vendor Perfusion Pipelines
GE BrainStat (SIGNA Works DV26-29, AW 4.6) automatically averages early arterial voxels into one global arterial input function (AIF), then deconvolves all tissue curves with a block-circulant SVD (oSVD) kernel.10 A post-fit baseline restoration yields a leakage-indicator map (K_2_) and nominal rCBV/rCBF/rMTT; only CBV is partly corrected for T_1_/T_2_* tailing.17 Siemens syngo. MR Neuro Perfusion (XA50/60) derives a slice-specific local AIF and applies the same oSVD kernel. It produces rCBV/rCBF/rMTT maps without leakage correction.
NVM Perfusion Pipeline
The NVM pipeline (Neurosuite, v16.1, Cercare Medical, Aarhus, Denmark) first selects a single global arterial-input function automatically and applies it voxel-wise.11 Rather than SVD deconvolution, each voxel’s concentration-time curve is fitted with a physiologically constrained gamma residue using a Bayesian expectation-maximization algorithm.11^,^12 The fit updates CBF, MTT, macrovascular delay and noise variance; CBV is then computed as CBF × MTT. A co-estimated, unidirectional leakage term (Kapp) removes T_1_/T_2_* tailing before the fit, yielding leakage-corrected rCBV, rCBF and rMTT maps; 18 To note, Kapp is an empirical correction, not a pharmacokinetic Ktrans.
Qualitative Analysis
By matching the T2/FLAIR as well as non-contrast and contrast-enhanced T1-weighted sequences, qualitative hyperperfusion hotspot conspicuity was assessed independently by two board-certified neuroradiologists (6- and 12-years’ experience in diagnostic neuroradiology). Color-encoded maps (rCBV, rCBF, rMTT, respectively) were exported with the native window/level presets of each pipeline, displayed on identical calibrated monitors, renamed with random numeric identifiers, and presented side-by-side in random order to reduce reader recognition of the processing method. A three-point ordinal scale was applied: 0 = inadequate hyperperfusion hotspot delineation, 1 = adequate hyperperfusion hotspot delineation, 2 = good hyperperfusion hotspot delineation.
Quantitative Analysis
For quantitative hyperperfusion hotspot analysis, two board-certified neuroradiologists (6- and 12-years’ experience in diagnostic neuroradiology) independently performed manual region of interest (ROI) placement (circular, 20–30 mm^2^) on every grey-scale perfusion map (rCBF, rCBV, rMTT, respectively) under evaluation.19 Color-coded maps and co-registered T1-post-contrast and T2/FLAIR images were used to refine the placement (Figure 2). Macroscopically visible vessels and necrotic areas were excluded to avoid perfusion inflation. An identically sized control ROI was placed in contralateral normal-appearing white matter (NAWM). Datasets were displayed in randomized order with anonymized file names, reducing pipeline recognition. Normalized metrics were calculated per map as nMetric = rMetric(hotspot)/rMetric(NAWM) for CBF, CBV, MTT, respectively. Mean normalized values were then entered into predefined comparisons:
Example of ROI placement in a 42-year-old male with newly diagnosed left subcentral glioblastoma (MGMT-methylated, TERT C228T mutation), scanned at 3.0 T. Axial T2-weighted (T2) and contrast-enhanced T1-weighted (ceT1) images show a well-delineated, homogeneous lesion with minor rim enhancement. The NVM-derived rCBV (RGB) and rCBV (grayscale) maps illustrate ROI placement: ROI 1 is located within the perfusion hotspot identified on the color-coded (RGB) rCBV map, while ROI 2 is placed in contralateral normal-appearing white matter, each ROI measuring 22.4 mm2. Despite initially atypical MRI morphology, histology revealed the characteristic features of a malignant glioma. Six-week follow-up imaging (not shown) demonstrated typical rim enhancement and central necrosis as well as mild perifocal edema. ROI = region of interest; rCBV = relative cerebral blood volume; RGB = red-green-blue.
NVM vs vendor (all scanners and field strengths).NVM vs vendor at different field strengths (at 3.0 T and 1.5 T, respectively).Siemens scanner vs GE scanner (at 3.0 T and NVM processing only).Siemens pipeline vs GE pipeline (at 3.0 T)
Statistics
Inter-rater reliability was evaluated for qualitative analyses by application of Cohen’s kappa and quantitative analyses by application of consistency- and agreement-based intraclass correlation coefficients (ICC). The normality of continuous data was assessed using the Shapiro–Wilk test. As most variables did not follow a normal distribution, descriptive statistics are reported as medians and interquartile ranges (25th and 75th percentiles). Non-parametric tests were used for group comparisons: the Wilcoxon signed-rank test for paired comparisons between NVM and vendor algorithms, and the Mann-Whitney U test for independent samples comparing scanner field strengths and manufacturers. For binary variables (eg sex) and categorical variables (eg distribution of molecular biomarkers), contingency tables were created. The independence of these variables was assessed using the Chi-squared test or Fisher’s exact test, as appropriate. Statistical analyses were performed using R (version 4.3.2, R Core Team, 2023) with a significance level of α = .05.
Results
In total, 89 patients (37 female, mean age 66.0 years) with first diagnosis of IDH-wild-type glioblastoma were analyzed, with most scans acquired on 3.0 T systems (74/89 patients, 83%) and an approximately equal distribution between GE and Siemens scanners (45 vs. 44 patients). Of the assessed molecular markers, a MGMT promoter methylation was documented in 31/89 (34.8%) patients and a TERT promoter mutation in 76/89 (85.4%) patients. Further patient and neuropathological characteristics are provided in Table 2.
Qualitative and Quantitative Analysis
Detailed statistics of qualitative assessments and for each quantitative parameter are provided in Tables 3 and 4.
Regarding inter-rater reliability of qualitative DSC-GRE perfusion analysis Kappa values ranged from 0.85 to 0.93 (P < .0001), with ratings on NVM perfusion maps being significantly higher compared to vendor perfusion maps (rCBF, rCBV, rMTT; P < .0001, each). Illustrative cases are shown in Figure 3.
Illustrative DSC-MRI perfusion comparisons between the novel vascular model (NVM) and vendor algorithms in two glioblastoma cases. Axial T2-weighted (T2) and contrast-enhanced T1-weighted (ceT1) images in (A) a 65-year-old male with temporo-occipital glioblastoma (unmethylated MGMT, TERT C228T mutation) at 3.0 T and (C) a 74-year-old female with right frontal glioblastoma (unmethylated MGMT, TERT C228T) at 1.5 T. Tumors exhibit rim enhancement, central necrosis, and varying degrees of perifocal edema (A, C). Corresponding color-coded RGB maps for rCBF, rCBV, and rMTT derived from either the NVM or vendor algorithm (B, D). NVM maps show more pronounced hyperperfusion (rCBF, rCBV) and prolonged transit times (rMTT) with improved spatial resolution and higher SNR. In contrast, vendor maps display less distinct hyperperfusion and increased image noise, particularly for rMTT in case 2. DSC = dynamic susceptibility contrast; T = Tesla; rCBF = relative cerebral blood flow; rCBV = relative cerebral blood volume; rMTT = relative mean transit time; RGB = red-green-blue; SNR= signal-to-noise ratio.
For quantitative analysis of DSC-GRE MRI perfusion parameters, intraclass correlation coefficients ranged from 0.86 to 0.94 across consistency- and agreement-based calculations. NVM-derived ratios were significantly higher compared to those obtained from vendor algorithms (mean nCBF, mean nCBV, mean nMTT; *P *< .001, each; Figure 4A). When comparing NVM and vendor algorithms at 3.0 T, NVM-derived ratios were significantly higher (nCBF, nCBV, and nMTT, P < .001, each; Figure 4B). At 1.5 T, NVM-derived nCBF and nMTT ratios were significantly higher than vendor ratios (P < .05), whereas nCBV did not reach statistical significance (Figure 4C). Subgroup analysis of NVM at 1.5 T vs. 3.0 T showed that nCBV was significantly higher at 3.0 T (P = .008), whereas nCBF and nMTT remained consistent across field strengths (P > .05, each). At 3.0 T, intragroup comparison of the vendor pipelines showed that Siemens produced significantly higher nCBV values than GE, whereas no significant differences were detected for nCBF or nMTT. Within the NVM pipeline at 3.0 T, no significant differences in nCBF, nCBV, or nMTT were observed between the GE and Siemens scanners. Furthermore, no significant group-wise differences in demographic or molecular characteristics were identified.
Quantitative analysis of normalized DSC-MRI perfusion parameters comparing the NVM with vendor algorithms. Box plots display nCBF, normalized cerebral blood volume nCBV, and normalized mean transit time nMTT for the whole cohort (A), 3.0 T subgroup (B), and 1.5 T subgroup (C). Asterisks indicate significance levels: * = P < .05, *** = P < .001; ns = not significant. DSC = dynamic susceptibility contrast; NVM = novel vascular model; nCBF = normalized cerebral blood flow; nCBV = normalized cerebral blood volume; nMTT = normalized mean transit time; T = Tesla.
Discussion
In this retrospective cohort of 89 untreated IDH-wild-type glioblastomas, the NVM consistently yielded higher normalized perfusion ratios and more distinct visual hotspot delineation than the two applied vendor pipelines with excellent inter-reader agreement. The improvement was most significant for nCBF and nMTT known to be most vulnerable to delay-related under-estimation in conventional SVD processing, utilized by vendor pipelines.10 Importantly, the numerical gains of NVM were vendor-agnostic: similar gains were observed over both vendor pipelines, indicating that most of the benefit stems from the NVM rather than MRI platform-specific differences. These results extend previous simulations and small-series reports suggesting that conventional GRE-DSC perfusion may rather under-detect high-flow and heterogeneous transit components,11^,^20 by demonstrating a tangible clinical impact on hotspot conspicuity in a contemporary, multi-scanner glioblastoma cohort.
Previous validations of the NVM were confined to simulations and small patient samples relative to oSVD, but not benchmarked against vendor software.11^,^12 The significant elevations we observed in nCBF, nCBV, and nMTT when applying the NVM are concordant with phantom simulations and in-vivo studies demonstrating that block-circulant oSVD underestimates perfusion when the bolus is delayed or dispersed.10^,^20 We extend these theoretical and small-scale observations by demonstrating that the numerical gain translates into more distinct hot-spot conspicuity on routine clinical images, a link not previously reported.
Our intent was a pragmatic head to head comparison against conventional vendor DSC processing that reflects how GRE DSC perfusion is typically used at the scanner console and in clinical workstations. This baseline choice is directly relevant to translation and adoption. Consistent with this design, we report preload dosing, contralateral NAWM normalization, and excellent inter reader agreement, and we carefully limit claims to relative numerical differences and conspicuity rather than biological accuracy. The observation that the largest gains occurred in nCBF and nMTT, metrics comparatively less sensitive to residual leakage effects after preload, further supports that the effect is not solely explained by leakage correction.
Vendor pipelines that rely on oSVD remain vulnerable to these bolus-timing and dispersion effects, which are common in malignant gliomas.10^,^21 NVM circumvents the hard threshold by fitting a gamma-distributed residue in a Bayesian framework, recovering capillary transit components,11 that oSVD suppresses and thus yielding higher perfusion metrics. However, GRE-DSC perfusion scales with the square of vessel radius, probably over-representing larger vessels relative to capillaries.22^,^23 In contrast, spin-echo (SE) DSC perfusion, whose signal scales with the fourth power of radius, is inherently more capillary-specific yet suffering from lower signal-to-noise ratio (SNR) and limited brain coverage.24^,^25 Given these constraints, consensus guidelines still recommend application of GRE-DSC (instead of SE-DSC or dual-echo acquisitions) for MR perfusion imaging in glioma patients,26 leaving micro-vascular alterations difficult to quantify.
In this study, an explicit leakage correction was solely applied by the NVM, whereas the vendor outputs were analyzed in their nominally uncorrected form. Several aspects, however, limit the extent of resulting bias. First, we administered a standard preload, to reduce underestimation of rCBV while exerting negligible influence on CBF and MTT.27 Second, all perfusion metrics were normalized to contralateral NAWM to abolish leakage-related differences between corrected and uncorrected nCBV.17 Consistent with these precautions, the largest numerical gains occurred in nCBF and nMTT, parameters largely insensitive to leakage effects after preload. Furthermore, significantly higher nCBV observed with the uncorrected Siemens pipeline compared to the GE pipeline with baseline-restoration (at 3.0 T, respectively) undermines the assumption about the influence of leakage correction.28 This indicates that the principal advantage of NVM stems from its physiology-based modelling rather than from leakage correction alone, although some of the nCBV increase may reflect NVM’s additional leakage term.
The extent of NVM’s numerical gains over both vendor pipelines within tumor “hotspots” in this study was depended on the applied field strength. At 3.0 T, the NVM increased nCBV significantly relative to vendor software, whereas at 1.5 T the nCBV gain did not reach significance; nCBF and nMTT remained significantly higher at both field strengths. The most plausible explanation is the higher SNR at 3.0 T, which provides the NVM with richer information, while threshold-based oSVD benefits less.26 This indicates that the advantages at higher field strengths may be driven by the modelling strategy rather than by manufacturer implementation and aligns with clinical comparisons showing superior lesion conspicuity at 3.0 T relative to 1.5 T for conventional DSC sequences.29
Both the increased normalized perfusion ratios and improved hotspot conspicuity obtained with NVM may have several translational benefits. First, a clearer delineation of hyperperfused tumor components could refine stereotactic-biopsy targeting, potentially reducing sampling errors that limit the radiology-histology concordance (eg Ki-67).5 Second, advanced multiparametric MRI including GRE-DSC perfusion have shown to correlate with IDH-mutation and MGMT promoter methylation status in glioblastomas,30 reinforcing NVM’s potential beyond quantitative perfusion estimates to provide biologically relevant imaging biomarkers that may aid in noninvasive tumor classification. Third, the NVM could improve the robustness of dedicated semi-quantitative perfusion scores to further refine detection of glioma recurrence.31 Fourth, the NVM’s advantage against standard algorithms was observed across different manufacturers and field strengths, respectively, indicating that its specific approach accounts rather more for the observed improvement than scanner hardware. Finally, because NVM is a post-processing pipeline, it allows incorporation into emerging multi-parametric frameworks such as MRI-based RANO 2.0 and PET-RANO 1.0 criteria to provide complementary vascular information alongside various imaging modalities capturing both perfusion and metabolism features of malignant gliomas.32–34 Preliminary studies combining sequential GRE-DSC perfusion MRI with FET-PET have already demonstrated superior discrimination of true tumor progression from treatment-related changes.35 However, to date, harmonization of MRI- and PET-based data remains a critical issue in neuro-oncology.36
Addressing the NVM’s evidence gap, coordinated multi-center trials are required that validate its output against independent biological standards, ideally by co-registering voxel-wise perfusion maps with stereotactic biopsies or vessel-size imaging, to determine whether the observed numerical gains truly reflect microvascular biology.13 Harmonized GRE-DSC protocols across 1.5 T and 3.0 T platforms, augmented by optional dual-echo acquisitions, would clarify how far the model can narrow the residual vessel-size bias noted in consensus guidelines.26 A further priority is to test the clinical utility of the NVM-specific oxygenation metrics (CTH, OEF, CMRO_2_) in longitudinal glioma cohorts that include post-therapy scans and IDH-mutant tumors. Finally, algorithmic refinements, such as incorporating bidirectional leakage models or adaptive AIF selection, may further reduce residual bias in perfusion estimates and facilitate fully automated, vendor-neutral deployment in routine neuro-oncology practice.
Several methodological constraints limit the interpretation of our findings. First, this was a single-center, retrospective study exclusively applying GRE-DSC perfusion MRI. The known vessel-size bias of GRE-DSC and its greater susceptibility to macroscopic artefacts at 3.0 Tesla remain only partially mitigated by the NVM and cannot be eliminated without spin-echo or dual-echo acquisitions.22^,^23^,^25^,^37 Second, although NVM’s Bayesian fit probably elevates CBF, CBV and MTT, no external gold standard (ie vessel-size imaging or quantitative histology) was available to confirm that these calculated numerical gains are indeed biologically more accurate.11^,^12 Third, leakage-correction may inflate NVM values, although its impact is likely modest given the preload dose, contralateral normalization, and the finding that the largest gains occurred in CBF and MTT, indices largely unaffected by leakage after preload.27 In this context, by design, we did neither implement research grade leakage corrected SVD comparators nor automatic volumetric tumor segmentation. Both would redefine the estimand and endpoints from hotspot conspicuity to volume wide descriptors. Fourth, the broader dynamic range of NVM color-coded maps, combined with each pipeline’s distinctive texture and fixed window/level preset, introduces a risk of classification bias unrelated to physiology. Although inter-reader agreement for manual ROI placement was excellent, the use of circular ROIs still samples only a small portion of these highly heterogeneous tumors. Finally, the study was limited to pre-treatment IDH-wild-type glioblastomas; applicability to post-therapy assessment or other molecular subtypes and/or IDH-mutant gliomas remains to be verified in prospective cohorts.
In conclusion, in this GRE-DSC MRI perfusion study of patients with untreated IDH-wild-type glioblastoma NVM post-processing yielded consistently higher normalized CBF, CBV and MTT values than two widely used vendor pipelines, particularly when applying 3.0 Tesla. We emphasize that our claims are confined to relative improvements over conventional vendor processing within the stated design and do not imply biological superiority of any map. But these findings underscore the promise of model-based vascular analysis for routine perfusion MRI; however, the approach inherits the echo-regime bias of GRE-DSC data and remains partly susceptible to leakage effects and AIF selection. Prospective, multi-center studies with histopathologic correlation are therefore required before NVM metrics may qualify as quantitative markers.
The reference list from the paper itself. Each links out to its DOI / PubMed record.
- 1Shiroishi MS , Castellazzi G, Boxerman JL, et al Principles of T 2 *-weighted dynamic susceptibility contrast MRI technique in brain tumor imaging. J Magn Reson Imaging. 2015;41:296-313.24817252 10.1002/jmri.24648 · doi ↗ · pubmed ↗
- 2Meier P , Zierler KL. On the theory of the indicator-dilution method for measurement of blood flow and volume. J Appl Physiol. 1954;6:731-744.13174454 10.1152/jappl.1954.6.12.731 · doi ↗ · pubmed ↗
- 3Jespersen SN , Østergaard L. The roles of cerebral blood flow, capillary transit time heterogeneity, and oxygen tension in brain oxygenation and metabolism. J Cereb Blood Flow Metab. 2012;32:264-277.22044867 10.1038/jcbfm.2011.153PMC 3272609 · doi ↗ · pubmed ↗
- 4Law M , Yang S, Babb JS, et al Comparison of cerebral blood volume and vascular permeability from dynamic susceptibility contrast-enhanced perfusion MR imaging with glioma grade. AJNR Am J Neuroradiol. 2004;25:746-755.15140713 PMC 7974484 · pubmed ↗
- 5Hu LS , Baxter LC, Smith KA, et al Relative cerebral blood volume values to differentiate high-grade glioma recurrence from posttreatment radiation effect: direct correlation between image-guided tissue histopathology and localized dynamic susceptibility-weighted contrast-enhanced perfusion MR imaging measurements. AJNR Am J Neuroradiol. 2009;30:552-558.19056837 10.3174/ajnr.A 1377 PMC 7051449 · doi ↗ · pubmed ↗
- 6Emblem KE , Mouridsen K, Bjornerud A, et al Vessel architectural imaging identifies cancer patient responders to anti-angiogenic therapy. Nat Med. 2013;19:1178-1183.23955713 10.1038/nm.3289 PMC 3769525 · doi ↗ · pubmed ↗
- 7Chida D , Okita Y, Utsugi R, et al Dynamic susceptibility contrast‑enhanced perfusion magnetic resonance imaging parameters for predicting MGMT promoter methylation and prognostic value in newly diagnosed patients with glioblastoma. Oncol Lett. 2024;28:610.39493435 10.3892/ol.2024.14741 PMC 11528182 · doi ↗ · pubmed ↗
- 8Law M , Young RJ, Babb JS, et al Gliomas: predicting time to progression or survival with cerebral blood volume measurements at dynamic susceptibility-weighted contrast-enhanced perfusion MR imaging. Radiology. 2008;247:490-498.18349315 10.1148/radiol.2472070898 PMC 3774106 · doi ↗ · pubmed ↗